

Abstract
The ability to target discrete features within tissue using liquid surface extractions enables the identification of proteins while maintaining the spatial integrity of the sample. Here, we present a liquid extraction surface analysis (LESA) workflow, termed microLESA, that allows proteomic profiling from discrete tissue features of ~110 μm in diameter by integrating nondestructive autofluorescence microscopy and spatially targeted liquid droplet micro-digestion. Autofluorescence microscopy provides the visualization of tissue foci without the need for chemical stains or the use of serial tissue sections. Tryptic peptides are generated from tissue foci by applying small volume droplets (~250 pL) of enzyme onto the surface prior to LESA. The microLESA workflow reduced the diameter of the sampled area almost 5-fold compared to previous LESA approaches. Experimental parameters, such as tissue thickness, trypsin concentration, and enzyme incubation duration, were tested to maximize proteomics analysis. The microLESA workflow was applied to the study of fluorescently labeled Staphylococcus aureus infected murine kidney to identify unique proteins related to host defense and bacterial pathogenesis. Proteins related to nutritional immunity and host immune response were identified by performing microLESA at the infectious foci and surrounding abscess. These identifications were then used to annotate specific proteins observed in infected kidney tissue by MALDI FT-ICR IMS through accurate mass matching.
Graphical Abstract
The ability to determine the spatial distribution of endogenous proteins and their various proteoforms (e.g., post-translational modifications) is critical for interrogating biological processes related to health and disease.1–5 In many cases, this is done using matrix-assisted laser desorption/ionization (MALDI) by either collecting individual spectra from discrete foci as a histology guided profiling experiment,6,7 or by imaging the tissue by rastering the sample to collect spectra at every pixel location.8,9 However, identification of proteins directly from tissue using MALDI can be challenging. Sequencing peptides or proteins for identification relies on tandem mass spectrometry (MS/MS) technologies, such as collision-induced dissociation (CID) or electron-transfer dissociation (ETD).10–13 Both of these approaches require high charge states (typically >3) for efficient peptide or protein fragmentation.14,15 MALDI primarily produces protein ions with low charge states, usually + 1 or +2, limiting the ability to efficiently fragment and identify proteins directly from tissue.16 To overcome this challenge, tandem may be completed using electrospray ionization (ESI) using traditional bottom-up and top-down mass spectrometry workflows. However, these experiments require additional strategies for molecular extraction prior to proteomic analysis.9,17–21 Traditionally, homogenized tissue extractions have been used to compliment MALDI experiments and provide identifications.2,3,22,23 These methods have proven to be effective and allow for relative and absolute quantification of the analytes extracted from tissue.24,25 Although bulk homogenization of the sample maximizes analyte extraction,26,27 the process leads to a complete loss of the spatial information making identification of protein signals from distinct foci difficult.
Recently, spatially targeted protein identification strategies have been developed that extract material from tissue surfaces using spatially targeted means to correlate proteomic identifications with specific tissue foci observed in spatially targeted MALDI experiments.28 Proteomic profiling of discrete tissue foci has been accomplished using different approaches: tissue punch biopsies,29,30 laser capture microdissection (LCM),4,31–34 hydrogel extractions,35–37 and liquid microjunctions.38–40 Liquid extraction surface analysis (LESA), in particular, has been shown to be an effective, high-throughput approach for spatially targeted protein identifications.40–42 The LESA experiment utilizes small volumes of solvent (~0.5–3.0 μL) that can be manipulated on the tissue section surface to extract analytes. Briefly, a glass capillary delivers and dispenses the solvent on the tissue while maintaining a liquid microjunction between the tip, liquid, and sample allowing for the extraction of endogenous molecules into the solvent. Following surface contact, the liquid can be aspirated off the sample and collected for off-line workflows or directly injected into a mass spectrometer for analysis. Commercial platforms are available that employ robotics to increase accuracy and reproducibility of surface extraction and modifications to these platforms have allowed for direct coupling with HPLC.43–46 However, these systems have a limited achievable LESA droplet diameter on tissue of approximately 400–500 μm.44 The ability to resolve small histological foci using MALDI has created the need to advance these complementary molecular identification technologies to achieve similar spatial fidelity.8,47–49
The deposition of small volume droplets (<500 pL) of liquid (matrix or trypsin) is used routinely to profile discrete regions of tissue by MALDI MS.9,50 This type of droplet-based deposition has been demonstrated to enable MS analysis of these tissue areas. For trypsin droplet deposition experiments, MALDI is typically used for analysis but LESA has also been demonstrated to be effective for extracting peptides from areas digested using LESA-based approaches. Quanico et al. combined droplet-based trypsin deposition with liquid micro-extractions to decrease the area of the region to be subjected to enzymatic digestion.51 This approach bypasses the typical limitations imposed by LESA (i.e., large extraction droplet diameter on tissue) by targeting tryptic peptides that are produced only in the tissue foci where the droplet-based microdigest has been performed. Using regions defined from previous IMS data, they were able to identify proteins in areas as small as 250 μm. Although this represents an improvement over traditional LESA workflows, further development is needed to improve spatial resolution and precision so that spatially targeted proteomics experiments can be performed on specific tissue substructures and cell types.
Herein, we report a new workflow combining LESA with nondestructive autofluorescence (AF) microscopy and histology directed micro-digestions for spatial proteomics experiments. By utilizing the fluorescence from endogenous biomolecules, AF provides a high-spatial resolution, morphologically rich microscopy modality that does not require chemical staining, allowing for downstream molecular analysis.52 This enables histological determination of tissue regions-of-interest (ROI) to be defined on the same tissue section prior to spatially targeted proteomics, bypassing complicated registration procedures between serial tissue sections. A piezoelectric spotting system with a robotic stage was used for spotting micro-digestions solutions after ROI identification on the AF image; a new workflow referred to as microLESA herein. Optimization of digestion sensitivity, trypsin concentration, digest spot size, and digestion time are all reported. As a proof-of-concept, the microLESA workflow was applied to study the host–pathogen interface in mouse kidney that was infected with Staphylococcus aureus. This unique workflow allows for advanced spatially targeted proteomics experiments, guided by nondestructive AF microscopy, to be performed on tissue substructures down to ~110 μm.
METHODS AND MATERIALS
Chemicals.
Acetonitrile (ACN), acetic acid, formic acid (FA), trifluoroacetic acid, ethanol, ammonium bicarbonate, and chloroform were purchased from Fisher Scientific (Pittsburgh, PA, USA). Mass spectrometry sequence-grade trypsin from porcine pancreas and 2,6-dihydroxyacetophenone (DHA) were purchased from Sigma-Aldrich Chemical, Co. (St. Louis, MO, USA).
Bacterial Strains.
To create a stable GFP+ strain of S. aureus for subsequent murine infections and fluorescence microscopy, the region containing the sarA promoter driving sfGFP was first amplified out of pCM1153 using primers 5′-GTTGTTTCTAGACTGATATTTTTGACTAAACCA-AATG-3′ and 5′- GTTGTTGAGCTCTTAGTGGTGGTG-GTG-3′ (restriction sites underlined). The resulting PCR amplification product was then ligated into the XbaI and SacI site of pJC1111 to create pNP1. pNP1 was then chromosomally integrated into the SaPI1 site of S. aureus as previously described.54 The region encompassing the chromosomal SaPI1 integration was then transduced into S. aureus strain LAC (AH1263) using phi80a. Integration of Psar-A_sfGFP at the SaPI1 site was confirmed using primers JC0717 and 719.54
Animals.
Frozen rat liver was purchased from Pel-Freeze Biologicals (Rogers, AR, USA), and stored at −80 °C until sectioning. All in-house animal experiments were performed with approval by the Vanderbilt Institutional Animal Care and Use Committee. Six to eight-week old female C57BL6/J mice were anesthetized with isoflurane and retro-orbitally infected with 3.6 × 10⁷ colony forming units (CFUs) of Staphylococcus aureus LAC carrying a genomic sfGFP reporter under control of the sarA promoter (see above). Mice were humanely sacrificed at 10 days post infection (DPI). Kidneys for imaging and microLESA experiments were aseptically removed and frozen on dry ice.
MALDI Protein IMS.
Protein MALDI IMS was performed on a modified Bruker SolariX 15T Fourier transform ion cyclotron resonance (FT-ICR) mass spectrometer (Bruker Daltonics, Billerica, MA, USA).55 The source pressure of the instrument was decreased to 950 mTorr to maximize the transmission efficiency of larger intact protein species by regulating the gas flow through the ESI port. Tissue preparation strategies and instrumental parameters are discussed in the Supporting Information.
Micro-Digestions and Autofluorescence Microscopy.
For the microLESA experiments, trypsin was dissolved in a 12:88 v/v solution of acetic acid (100 mM) and ammonium bicarbonate (100 mM) to a final concentration of 75 ng/μL, except for the trypsin concentration optimization experiments (detailed in Results and Discussion). A piezoelectric spotting system (sciFLEXARRAYER S3, Princeton, NJ, USA) was utilized with a piezoelectric dispenser capillary nozzle (PDC 50, type 3) for trypsin deposition. For all experiments, either bright field or AF microscopy images were acquired (Eclipse 90i, Nikon Instruments Inc. Melville, NY, USA) prior to any spotting. For microLESA of S. aureus infected murine kidney, an AF image was acquired prior to spotting using FITC and DAPI filters (FITC excitation λ, 465–495 nm; emission λ, 515–555 nm; DAPI excitation λ, 340–380 nm; emission λ, 435–485 nm). All microscopy images were collected with either a 4X or 10X objective, generating images with a resolution of 2.29 and 0.92 μm/pixel, respectively. Microscopy exposure times were set to 200 ms for both filters. ROIs for trypsin spotting were annotated using microscopy images in ImageJ (U.S. National Institutes of Health, Bethesda, MD, USA) and converted into relative coordinates for the piezoelectric spotter using an in-house developed Python script. The spotter was optimized to generate ~250 pL droplets while dispensing trypsin. A detailed description of piezoelectric spotter parameters is available in the Supporting Information Methods. Following trypsin deposition, slides were incubated at 37 °C for 2 h except for the incubation optimization experiments (detailed in Results and Discussion).
Liquid Extraction Surface Analysis (LESA).
Liquid surface extractions were completed using a TriVersa Nano-Mate (Advion Inc., Ithaca, NY, USA) with the LESAplusLC modification.43,44 Images of digested tissue were scanned using a flatbed scanner, uploaded, and annotated using the Advion ChipSoft software. LESA was performed by aspirating 5 μL of extraction solvent (2:8 acetonitrile/water, with 0.1% formic acid) into the glass capillary. The capillary was then lowered to a height of approximately 0.5 mm above the tissue surface, and 2.5 μL of solvent was dispensed onto the tissue surface. The liquid junction was maintained for 10 s, and a volume of 3.0 μL was reaspirated back into the capillary. The initially drawn 5 μL volume was then dispensed into a 96-well plate containing 200 μL of water/0.1% formic acid. For each digested ROI, two LESA extracts were gathered from the region and combined. To prevent sample carryover, three wash cycles were completed between each ROI set. All extracts were dried down under vacuum and stored at −80 °C until LC-MS/MS analysis. Control and blank samples were gathered from undigested rat liver and a plain glass slide to account for endogenous peptides and contaminates, prior to digestion.
Bottom-Up LC-MS/MS and Data Analysis.
All bottom-up proteomic LC-MS/MS data were collected using Orbitrap platforms (Thermo Scientific, San Jose, CA, USA) and were completed using standard approaches detailed in the Supporting Information.
RESULTS AND DISCUSSION
Optimization of the MicroLESA Protocol.
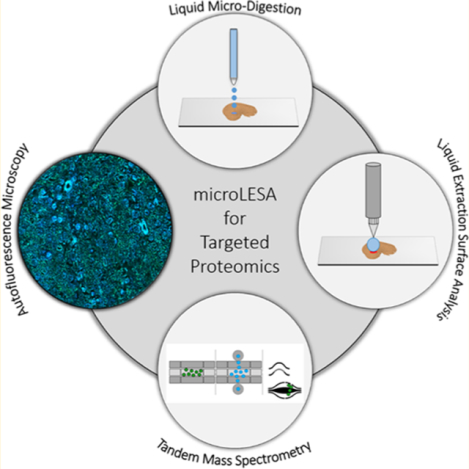
The microLESA workflow, depicted in Figure 1, utilizes both autofluorescence microscopy and liquid micro-digestions to target discrete features on the tissue surface for enzymatic digestion. Once digested, peptides are extracted using a traditional LESA. To achieve a robust digest, experimental parameters, such as micro-digestion spotting conditions, trypsin concentration, incubation time, and tissue thickness were optimized.
Figure 1.

Overview of microLESA workflow. (A) Briefly, the tissue is sectioned and mounted onto a microscope slide. An autofluorescence microscopy image is acquired to identify foci for spatially targeted micro-digestions. Trypsin droplets are dispensed onto the tissue surface and incubated at 37 °C. Digested peptides are then extracted from the tissue using traditional LESA. (E) The digested area on tissue is dictated by the area of the microdigest of trypsin, represented by a solid red circle. The digested peptides are collected from tissue using traditional LESA (purple circle) that is larger than the digested area (red circle).
MicroLESA Spatial Resolution.
To determine the achievable spatial resolution for the microLESA workflow, a series of trypsin droplet dispensing conditions were tested. A trypsin solution (0.075 μg/μL) was deposited onto water-sensitive paper, while varying the number of drops during each dispense event (Figure S1). Water-sensitive paper was used to allow more accurate size measurements to be made and because it is a good proxy for tissue as trypsin spot size differences between the surfaces is minimal (<15%, data not shown). As shown in Figure S1A, when a single 220 pL drop was dispensed 21 separate times (60 s between droplets), the final trypsin spot on surface was ~112 μm (RSD 4.33%). It is noted that 21 drops was chosen to mimic the total volume of trypsin used for prior studies (~4.5 nL).56 This trypsin microdigest spot size is 5X smaller than previously reported LESA spot size.44 An increase in trypsin spot diameter was observed as the number of droplets during a single dispensing event increased. For example, when dispensing 7 drops during a single event the trypsin spot increased ~95% in diameter (~220 μm, RSD 3.82%), as seen in Figure S1D. Although the throughput of the spotting experiment is increased by dispensing more droplets at once, minimizing the droplet diameter was of greater importance for the remaining experiments, and a single drop per dispensing event was employed throughout the remainder of this study.
Micro-Digestion Trypsin Concentration and Digest Sensitivity.
To determine an optimal trypsin concentration for the micro-digestion, varying trypsin concentrations (0.75, 7.5, and 75 ng/μL) were tested by digesting rat liver hepatocytes. Each concentration of trypsin was tested in triplicate by dispensing single ~250 pL droplets until a total volume of 2.5 nL was deposited per digest spot. A rat liver tissue section was divided into 3 regions, one for each trypsin concentration. Tissue regions had 3 separate digest regions for technical replicates, each containing 3 individual microdigest spots (depicted in Figure 2A). LESA was used to extract peptides from each digest region. Bottom-up proteomics analysis of the digests with varying trypsin concentrations (0.75, 7.5, and 75 ng/μL) resulted in 61 ± 11 (RSD 17.3%), 308 ± 40 (RSD 12.8%), and 614 ± 6 (RSD 0.9%) unique protein identifications, respectively. Moving an order of magnitude in concentration, 75 down to 7.5 ng/μL, lead to a ~ 50% loss in the total number of protein IDs, and thus the remaining experiments were completed with trypsin concentrations of 75 ng/μL. Because of the volume of trypsin solution required for the piezoelectric spotting platform (0.5 mL), higher concentrations were not tested (e.g., 750 ng/μL) as the experiment becomes cost prohibitive.
Figure 2.

Optimization of trypsin concentration for microLESA digestion. (A) A section of rat liver was divided into 3 regions. For each microLESA extract collected (purple circle outline), 3 separate trypsin microdigests were performed (red filled circle). Each concentration was tested in triplicate, extracting digested peptides from the 3 microdigested spots. (B) The number of unique proteins identified as a function of trypsin concentration increased as the concentration increased. (C) The overlap in protein identifications is depicted for each trypsin concentration, with the majority of the proteins identified in the 0.75 and 7.5 ng/μL samples being found in the 75 ng/μL samples.
Aside from the concentration of trypsin deposited onto a tissue surface, varying the number of microdigest spots to be targeted by a single LESA will also affect the total protein counts (i.e., increasing the number of digest spots within one traditional LESA spot). To evaluate the importance of this parameter, the number of micro digest spots per LESA extract was varied from 1 to 5 (Figure 3). Micro-digestion spots, each with a total volume of ~2.5 nL, were deposited onto rat liver hepatocytes for analysis. The number of identifications scaled linearly (R2 = 0.921, m =88.1) from 372 unique protein identifications for a single microdigest spot to 756 unique protein IDs collected from 5 micro digested areas. It is significant that a large number of proteins are identifiable, relative to the area interrogated, by digesting one single microdigest spot on tissue. In cases where targeted foci are widely dispersed across a tissue at distances larger than the LESA diameter (~500–1000 μm), protein identifications would necessarily be derived from only a single microdigestion spot.
Figure 3.

Total number of unique proteins identified as a function of microdigest areas per LESA extract. Trypsin was deposited onto rat liver (total volume of ~2.5 nL per digest spot), and the total number of digest spots per LESA extraction area was increased from 1 to 5.
Micro-Digestion Incubation Time and Tissue Thickness.
The LESA extraction takes only a few minutes to complete and requires minimal sample preparation steps. The major factors limiting throughput in the microLESA experiment are the chromatography and the time allotted for the digestion to occur. To determine optimal trypsin spot incubation times, 12 μm sections of rat liver underwent the microLESA workflow using 30 min, 1, 2, and 5 h incubation times (incubation temperature = 37 °C). Following digestion, two separate 2 μL LESA extracts of the peptides from each digest region were combined and subjected to offline LC-MS/MS. The 30 min digestion produced 528 ± 99 (RSD = 18.7%) unique protein identifications. This number was somewhat lower in the number of proteins identified, as well as higher in variability between the sample sets than the other conditions. For example, 1 and 2 h incubations resulted in 732 ± 8 (RSD = 1.1%) and 714 ± 22 (RSD = 3.1%) unique protein identifications, respectively. The 5 h digestion generated 568 ± 159 (RSD = 27.9%) unique protein identifications. The high degree of variability for this longer time point is likely a result of over digestion.57 Because long digestion times did not yield a greater number of protein identifications, 1–2 h digestions were determined to be optimal for microLESA experiments. Tissue thickness was also tested by applying the microLESA workflow to extract peptides from rat liver tissue sections that varied in thickness from 8 to 30 μm. It was determined that the thickness of the tissue section has no effect on the number of proteins identified. The results from this experiment are displayed in Figure S2.
microLESA Case Study: Elucidating the Proteomic Drivers of Host-Pathogen Interactions.
Staphylococcus aureus is a widely studied Gram positive bacteria that is responsible for half of all antibiotic resistance-related deaths.58 S. aureus infections often lead to the generation of purulent, inflammatory foci known as an abscess. Here, the immune system deploys immune cells, most commonly neutrophils, to fight the progression of the bacteria.59 MALDI IMS has successfully been used to study the infection as it allows for the ex vivo analysis of key molecules involved in the infections progression and association of them to specific cellular areas. For example, using MALDI IMS the metal-chelating heterodimer calprotectin, consisting of the subunits S100A8 and S100A9, was found to localize to the site of infection, where it binds and removes metals which are essential to the bacteria’s growth and progression.60,61 The major hurdle in imaging proteins from the infectious foci is identifying the resulting peaks in the average mass spectrum. Commonly, orthogonal approaches, such as tissue homogenization or LESA, are used to gather spatially targeted identifications.38,40,62 Although useful, these approaches are severely limited in their ability to target small foci. Tissue abscesses vary dramatically in size and bacterial colonies are on the order of 10–20 μm in diameter making them difficult to target specifically using traditional spatial proteomic approaches. The ability to visualize overall tissue morphology with AF microscopy and then perform micro-digestion specifically within an infectious abscess makes microLESA the ideal approach for this application. Moreover, this case study demonstrates the broad applicability of the microLESA approach for the analysis of any tissue, where targeted substructures can be visualized without the need for chemical stains or antibody-based approaches using autofluorescence microscopy.52,63
As a proof-of-concept, kidney tissue from a mouse infected with GFP+ labeled S. aureus bacteria was subjected to the microLESA workflow and MALDI IMS. The fluorescence image (tissue autofluorescence and fluorescently labeled bacteria) of the kidney is depicted in Figure 4. The autofluorescence signal makes evident the many abscesses present within the tissue (labeled, Figure 4). Because within this plane of the tissue the largest bacterial colonies were observed in the bottom abscess, this region was selected for microLESA. Five ROIs were chosen for trypsin spotting covering both the bacterial colonies and surrounding necrotic regions within the abscess. Following incubation, LESA was performed three times to ensure all digested peptides were extracted for LC-MS/MS analysis resulting in ~2700 unique protein identifications. Mouse immune response proteins were identified, such as neutrophil response factors like the S100A9 protein (Uniprot ID P31725), which is known to localize to the abscess during infection to sequester Mn2+ and Zn2+.64 Also identified are neutrophil secretory proteins such as neutrophil elastase (Uniprot ID Q3UP87), a serine protease responsible for killing bacteria but can be inhibited by serine protease inhibitors released from S. aureus during infection.65 Upward of 65 unique S. aureus specific proteins were identified. Staphylococcal complement inhibitor (Uniprot ID A6QIG6) is known to counteract the host immune response by reducing phagocytosis, following opsonization, and blocks all the downstream effector functions by selectively binding and inhibiting C3 convertases, which play a role in the complement system activated during inflammation.66 Also identified from the colony digests is the protein Iron-regulated surface determinant protein B (isdB, Uniprot ID A6QG30). It is known that S. aureus needs iron to replicate and continue to grow, but the host immune response is primarily aimed at sequestering and removing all iron at the site of infection to limit growth and kill the invading pathogens. IsdB is part of the iron-regulated surface determinant system responsible for binding heme, bringing it through the cell wall and membrane of the bacteria, where it can then be degraded to free iron to be used as a nutrition source for the bacteria.67 The identification of proteins involved in bacterial growth and survival directly from infected tissue is crucial in understanding the evolution and progression of a S. aureus infection. A list of selected S. aureus and neutrophil-specific proteins identified from the abscess using the microLESA workflow are presented in Table 1.
Figure 4.

Autofluorescence microscopy and MALDI IMS images of fluorescently labeled S. aureus infected mouse kidney tissue. (A) Autofluorescence microscopy images were acquired to visualize the abscess and bacterial colonies targeted for digestion. The interrogated abscess is circled in purple and a “zoomed-in” capture highlights the colonies that were targeted for digestion (red circles) using the microLESA workflow. (E) MALDI FT-ICR IMS was used to investigate the distribution of intact proteins present in the tissue. Selected proteins are presented that were identified using the data collected from the microLESA experiment, correlating the identifications by accurate mass matching.
Table 1.
Unique Protein Identifications from the Abscess of a S. aureus Infected Murine Kidneya
| Staphylococcus aureus protein identifications | |
| |Q2FGF0| UPF0365 protein | |Q2FFF8| staphylococcal complement inhibitor |
| |Q2FH00| alanine dehydrogenase 1 | |Q2FFJ6| aspartyl/glutamyl-tRNA(Asn/Gln) amidotransferase subunit B |
| |Q2FH01| L-threonine dehydratase catabolic TdcB | |Q2FFQ5| foldase protein PrsA |
| |Q2FHG3| ribonuclease J 2 | |Q2FFV5| phosphoenolpyruvate carboxykinase (ATP) |
| |Q2FHG9| translation initiation factor IF-2 | |Q2FG18| 30S ribosomal protein S4 |
| |Q2FHI1| elongation factor Ts | |Q2FG27| acetate kinase |
| |Q2FHI2| 30S ribosomal protein S2 | |Q2FG28| putative universal stress protein |
| |Q2FHI3| GTP-sensing transcriptional pleiotropic repressor CodY | |Q2FG40| pyruvate kinase |
| |Q2FHR7| carbamate kinase 1 | |Q2FG54| threonine-tRNA ligase |
| |Q2FHS7| FPRL1 inhibitory protein | |Q2FG61| trigger factor |
| |Q2FHT6| thioredoxin | |Q2FGD8| 30S ribosomal protein S20 |
| |Q2FHV1| iron-regulated surface determinant protein A | |Q2FGE3| chaperone protein DnaK |
| |Q2FHV2| iron-regulated surface determinant protein B | |Q2FJG3| nucleoid-associated protein SAUSA300_0453 |
| |Q2FIB3| glucose-6-phosphate isomerase | |Q2FJN4| alkyl hydroperoxide reductase C |
| |Q2FIG2| UPF0337 protein SAUSA300_0816 | |Q2FJP8| ribosomal protein S6 |
| |Q2FIK4| extracellular matrix protein-binding protein emp | |Q2FK15| ribitol-5-phosphate cytidylyltransferase 1 |
| |Q2FIL7| enolase | |Q2FK29| L-lactate dehydrogenase 1 |
| |Q2FIS2| lipoteichoic acid synthase | |Q2FK44| formate acetyltransferase |
| |Q2FJ31| alcohol dehydrogenase | |Q2FK96| heme oxygenase (staphylobilin-producing) 2 |
| |Q2FJ87| uncharacterized epimerase/dehydratase SAUSA300_0538 | |Q2FDQ4| fructose-bisphosphate aldolase class 1 |
| |Q2FJ92| elongation factor Tu | |Q2FDQ7| L-lactate dehydrogenase 2 |
| S100 protein identifications | |
| |P31725| protein S100-A9 | |P97816| mouse protein S100-G |
| |P50543| protein S100-A11 | |P27005| protein S100-A8 |
| |P07091| protein S100-A4 | |P97352| protein S100-A13 |
| neutrophil protein identifications | |
| |Q09014| neutrophil cytosol factor 1 | |O70138| neutrophil collagenase |
| |O70145| neutrophil cytosol factor 2 | |P11672| neutrophil gelatinase-associated lipocalin O |
| |O08692| neutrophilic granule protein | |P97369| neutrophil cytosol factor 4 |
| |Q3UP87| neutrophil elastase | |
Proteins identified from the bacterial colonies present in the abscess are listed, as well as proteins secreted by neutrophils to fight the infection. Proteins were identified with at least 2 peptides per protein, with a false discovery rate of 1%.
Protein identifications from microLESA extracts were used to annotate specific proteins observed in MALDI IMS data acquired from a serial section of S. aureus infected mouse kidney, demonstrating the utility of integrating microLESA into MALDI IMS workflows. Protein IMS was completed at 60 μm spatial resolution on a modified 15T FT-ICR MS (reduced source pressure = 950 mTorr).55 The resulting image consisted of protein distributions ranging from ~3–29 kDa, with a number of signals localizing to the abscesses. Both S100A8 and S100A9, the proteins that noncovalently bind to form the heterodimer calprotectin, were found localized intensely to the abscess regions. MALDI FT-ICR IMS provided the mass accuracy necessary to determine that S100A9 is both acetylated and methylated (mass accuracy = 1.13 ppm). Calprotectin is a metal-chelating host protein complex that accounts for an estimated 60% of the cytosolic protein content of neutrophils.68,69 Because bacteria require elemental nutrients for survival, metal sequestration is a primary mechanism for resisting bacterial pathogen proliferation within vertebrates, a process known as nutritional immunity.70,71
N-term acetylated cytochrome C oxidase subunit 6C (Cox6c) was also identified by microLESA and observed by IMS. Cox6c is one of the subunits of the large cytochrome c oxidase complex that is part of oxidative phosphorylation in mitochondria.72,73 The ability to identify proteins while maintaining spatial fidelity is critical for providing biological context to IMS results. MicroLESA provides a higher throughput, targeted approach to generate these identifications that when combined with IMS produce integrated data sets with both high spatial and molecular content.
CONCLUSIONS
The ability to maintain spatial context while providing deep proteomics analysis is critical for discovering relationships between molecular constituents and elucidating the underlying mechanisms of biological processes. Although there are other approaches that achieve this goal (e.g., LCM), the microLESA workflow described in this study provides a unique combination of spatial fidelity, proteomics performance, and throughput to enable next-generation spatial-omics applications. This new workflow incorporates autofluorescence microscopy to generate nondestructive images that allow for the visualization of target features on the same section of tissue that undergoes digestion. The incorporation of a microdigest allows for bottom-up proteomics experiments to be performed on tissue foci as small as ~110 μm in diameter. The microLESA workflow was characterized and optimized with regards to tissue thickness, incubation duration, and trypsin concentration. An attractive feature of the targeted micro-digestion is the ability to run the experiment from any tissue that displays autofluorescence. Broadly, microLESA can be applied to any tissue that displays autofluorescence. As a case-study, we demonstrated the capabilities of this workflow for the study of host-pathogen molecular interactions in a murine model. Autofluorescence enabled the gross morphology of the kidney tissue to be visualized, including abscesses, and utilizing genetically modified S. aureus provided the means to target bacterial colonies specifically. The resulting proteomics experiments produced thousands of protein identifications including a large number of bacterial proteins and proteins associated with host immune response. By integrating these data with imaging mass spectrometry, this workflow provides a way to effectively annotate species observed by MALDI IMS and delivers a more complete spatial proteomics description of a sample.
Supplementary Material
ACKNOWLEDGMENTS
This work was supported by grants from the National Institutes of Health (NIH) National Institute of General Medical Sciences (5P41 GM103391-07 awarded to RM.C.), NIH National Institute of Allergy and Infectious Diseases (1R01 AI138581-01A1 awarded to E.P.S. and J.M.S.; R01AI132560 and K08AI113107 awarded to J.E.C.), and from the NIH Shared Instrumentation Grant Program (1S100D012359-01) awarded to R.M.C. J.E.C. is also supported by a Burroughs Wellcome Fund Career Award for Medical Scientists. The authors also wish to thank Kristie Rose and Zach Jenkins of the Mass Spectrometry Resource Center at Vanderbilt University for their aid in the proteomics analyses.
Footnotes
Supporting Information
The Supporting Information is available free of charge on the ACS Publications website at DOI: 10.1021/acs.anal-chem.8b05889.
Measured droplet diameters, protein identifications using microLESA as a function of tissue thickness, microspotting settings, bottom-up LC-MS/MS settings, MALDI IMS acquisition settings, and proteomic identifications (PDF)
The authors declare no competing financial interest.
REFERENCES
- (1).Grey AC; Schey KL Invest Ophthalmol Visual Sci. 2009, 50 (9), 4319–4329. [DOI] [PMC free article] [PubMed] [Google Scholar]
- (2).Jones EE; Powers TW; Neely BA; Cazares LH; Troyer DA; Parker AS; Drake RR Proteomics 2014, 14 (7–8), 924–35. [DOI] [PMC free article] [PubMed] [Google Scholar]
- (3).Maccarrone G; Nischwitz S; Deininger SO; Hornung J; König FB; Stadelmann C; Turck CW; Weber F J. Chromatogr. B: Anal Technol Biomed. Life Sei 2017, 1047, 131–140. [DOI] [PubMed] [Google Scholar]
- (4).Dilillo M; Ait-Belkacem R; Esteve C; Pellegrini D; Nicolardi S; Costa M; Vannini E; de Graaf EL; Caleo M; McDonnell LA Sei. Rep 2017, 7, 603. [DOI] [PMC free article] [PubMed] [Google Scholar]
- (5).Stauber J; Lemaire R; Franck J; Bonnel D; Croix D; Day R; Wisztorski M; Fournier I; Salzet M J. Proteome Res 2008, 7 (3), 969–978. [DOI] [PubMed] [Google Scholar]
- (6).Meding S; Nitsche U; Balluff B; Elsner M; Rauser S; Schone C; Nipp M; Maak M; Feith M; Ebert MP; Friess H; Langer R; Hofier H; Zitzeisberger H; Rosenberg R; Walch A J. Proteome Res. 2012, 11 (3), 1996–2003. [DOI] [PubMed] [Google Scholar]
- (7).Labas V; Spina L; Belleannee C; Teixeira-Gomes AP; Gargaros A; Dacheux F; Dacheux JL J. Proteomics 2015, 113, 226–243. [DOI] [PubMed] [Google Scholar]
- (8).Spraggins JM; Rizzo DG; Moore JL; Noto MJ; Skaar EP; Caprioli RM Proteomics 2016, 16 (11–12), 1678–1689. [DOI] [PMC free article] [PubMed] [Google Scholar]
- (9).Wenke JL; Rose KL; Spraggins JM; Schey KL Invest. Ophthalmol. Visual Sci 2015, 56 (12), 7398–7405. [DOI] [PMC free article] [PubMed] [Google Scholar]
- (10).Sleno L; Volmer DA J. Mass Spectrom. 2004, 39 (10), 1091–1112. [DOI] [PubMed] [Google Scholar]
- (11).Sobott F; Watt SJ; Smith J; Edelmann MJ; Kramer HB; Kessler BM J. Am. Soc. Mass Spectrom 2009, 20 (9), 1652–1659. [DOI] [PubMed] [Google Scholar]
- (12).Syka JEP; Coon JJ; Schroeder MJ; Shabanowitz J; Hunt DF Proc. Natl. Acad. Sci. U. S. A 2004, 101 (26), 9528–9533. [DOI] [PMC free article] [PubMed] [Google Scholar]
- (13).Medzihradszky KF; Campbell JM; Baldwin MA; Falick AM; Juhasz P; Vestal ML; Burlingame AL Anal. Chem 2000, 72 (3), 552–558. [DOI] [PubMed] [Google Scholar]
- (14).Downard KM; Biemann K J. Am. Soc. Mass Spectrom 1994, 5 (11), 966–975. [DOI] [PubMed] [Google Scholar]
- (15).Good DM; Wirtala M; McAlister GC; Coon JJ Mol. Cell. Proteomics 2007, 6 (11), 1942–1951. [DOI] [PubMed] [Google Scholar]
- (16).Liu ZL; Schey KL J. Am. Soc. Mass Spectrom 2008, 19 (2), 231–238. [DOI] [PMC free article] [PubMed] [Google Scholar]
- (17).Catherman AD; Skinner OS; Kelleher NL Biochem. Biophys. Res. Commun 2014, 445 (4), 683–693. [DOI] [PMC free article] [PubMed] [Google Scholar]
- (18).Gundry RL; White MY; Murray CI; Kane LA; Fu Q; Stanley BA; Van Eyk JE Curr. Protoc. Mol. Biol 2001, 88, 10.25.1–10.25.23. [DOI] [PMC free article] [PubMed] [Google Scholar]
- (19).Maier SK; Hahne H; Gholami AM; Balluff B; Meding S; Schoene C; Walch AK; Kuster B Mol. Cell. Proteomics 2013, 12 (10), 2901–2910. [DOI] [PMC free article] [PubMed] [Google Scholar]
- (20).Wildburger NC; Wood PL; Gumin J; Lichti CF; Emmett MR; Lang FF; Nilsson CL J. Proteome Res. 2015, 14 (6), 2511–2519. [DOI] [PMC free article] [PubMed] [Google Scholar]
- (21).Llombart V; Trejo SA; Bronsoms S; Morancho A; Feifei M; Faura J; Garcia-Berrocoso T; Simats A; Rosell A; Canals F; Hernandez-Guillamon M; Montaner J J. Proteomics 2017, 152, 243–253. [DOI] [PubMed] [Google Scholar]
- (22).Schey KL; Hachey AJ; Rose KL; Grey AC Proteomics 2016, 16 (11–12), 1767–1774. [DOI] [PubMed] [Google Scholar]
- (23).Na CH; Hong JH; Kim WS; Shanta SR; Bang JY; Park D; Kim HK; Kim KP Mol. Cells 2015, 38 (7), 624–629. [DOI] [PMC free article] [PubMed] [Google Scholar]
- (24).Kim W; Bennett EJ; Huttlin EL; Guo A; Li J; Possemato A; Sowa ME; Rad R; Rush J; Comb MJ; Harper JW; Gygi SP Mol. Cell 2011, 44 (2), 325–340. [DOI] [PMC free article] [PubMed] [Google Scholar]
- (25).Pelkonen L; Sato K; Reinisalo M; Kidron H; Tachikawa M; Watanabe M; Uchida Y; Urtti A; Terasaki T Mol. Pharmaceutics 2017, 14 (3), 605–613. [DOI] [PubMed] [Google Scholar]
- (26).Boersema PJ; Raijmakers R; Lemeer S; Mohammed S; Heck AJ R. Nat. Protoc. 2009, 4 (4), 484–494. [DOI] [PubMed] [Google Scholar]
- (27).Gygi SP; Rist B; Gerber SA; Turecek F; Gelb MH; Aebersold R Nat. Biotechnol 1999, 17 (10), 994–999. [DOI] [PubMed] [Google Scholar]
- (28).Caprioli RM; Farmer TB; Gile J Anal. Chem 1997, 69 (23), 4751–4760. [DOI] [PubMed] [Google Scholar]
- (29).Steurer S; Seddiqi AS; Singer JM; Bahar AS; Eichelberg C; Rink M; Dahlem R; Huland H; Sauter G; Simon R; Minner S; Burandt E; Stahl PR; Schlomm T; Wurlitzer M; Schluter H Anticancer Res. 2014, 34 (5), 2255–2261. [PubMed] [Google Scholar]
- (30).Meding S; Balluff B; Elsner M; Schone C; Rauser S; Nitsche U; Maak M; Schafer A; Hauck SM; Ueffing M; Langer R; Hofler H; Friess H; Rosenberg R; Walch A Journal of Pathology 2012, 228 (4), 459–470. [DOI] [PubMed] [Google Scholar]
- (31).Datta S; Malhotra L; Dickerson R; Chaffee S; Sen CK; Roy S Histology and Histopathology 2015, 30 (11), 1255–1269. [DOI] [PMC free article] [PubMed] [Google Scholar]
- (32).Cahill JF; Kertesz V; Weiskittel TM; Vavrek M; Freddo C; Van Berkel GJ Anal. Chem 2016, 88 (11), 6026–6034. [DOI] [PubMed] [Google Scholar]
- (33).Mollee P; Boros S; Loo D; Ruelcke JE; Lakis VA; Cao KAL; Renaut P; Hill MM Clin. Proteomics 2016, 13, 30. [DOI] [PMC free article] [PubMed] [Google Scholar]
- (34).Dilillo M; Pellegrini D; Ait-Belkacem R; de Graaf EL; Caleo M; McDonnell LA J. Proteome Res 2017, 16 (8), 2993–3001. [DOI] [PubMed] [Google Scholar]
- (35).Harris GA; Nicklay JJ; Caprioli RM Anal. Chem 2013, 85 (5), 2717–2723. [DOI] [PMC free article] [PubMed] [Google Scholar]
- (36).Rizzo DG; Prentice BM; Moore JL; Norris JL; Caprioli RM Anal. Chem 2017, 89 (5), 2948–2955. [DOI] [PubMed] [Google Scholar]
- (37).Taverna D; Pollins AC; Nanney LB; Sindona G; Caprioli RM Experimental Dermatology 2016, 25 (2), 143–146. [DOI] [PMC free article] [PubMed] [Google Scholar]
- (38).Wisztorski M; Quanico J; Franck J; Fatou B; Salzet M; Fournier I Methods Mol. Biol 2017, 1618, 49–63. [DOI] [PubMed] [Google Scholar]
- (39).Sarsby J; Griffiths RL; Race AM; Bunch J; Randall EC; Creese AJ; Cooper HJ Anal. Chem 2015, 87 (13), 6794–6800. [DOI] [PubMed] [Google Scholar]
- (40).Sarsby J; Martin NJ; Lalor PF; Bunch J; Cooper HJ J. Am. Soc. Mass Spectrom 2014, 25 (11), 1953–1961. [DOI] [PMC free article] [PubMed] [Google Scholar]
- (41).Schey KL; Anderson DM; Rose KL Anal. Chem 2013, 85 (14), 6767–6774. [DOI] [PMC free article] [PubMed] [Google Scholar]
- (42).Wisztorski M; Desmons A; Quanico J; Fatou B; Gimeno JP; Franck J; Salzet M; Fournier I Proteomics 2016, 16 (11–12), 1622–32. [DOI] [PubMed] [Google Scholar]
- (43).Lamont L; Baumert M; Ogrinc Potocnik N; Allen M; Vreeken R; Heeren RMA; Porta T Anal. Chem 2017, 89 (20), 11143–11150. [DOI] [PMC free article] [PubMed] [Google Scholar]
- (44).Ryan DJ; Nei D; Prentice BM; Rose KL; Caprioli RM; Spraggins JM Rapid Commun. Mass Spectrom. 2018, 32 (5), 442–450. [DOI] [PMC free article] [PubMed] [Google Scholar]
- (45).Van Berkel GJ; Kertesz V Rapid Commun. Mass Spectrom 2013, 27 (12), 1329–1334. [DOI] [PubMed] [Google Scholar]
- (46).Kertesz V; Van Berkel GJ J. Mass Spectrom 2010, 45 (3), 252–260. [DOI] [PubMed] [Google Scholar]
- (47).Guenther S; Rompp A; Kummer W; Spengler B Int. J. Mass Spectrom 2011, 305 (2–3), 228–237. [Google Scholar]
- (48).Duenas ME; Klein AT; Alexander LE; Yandeau-Nelson MD; Nikolau BJ; Lee YJ Plant J. 2017, 89 (4), 825–838. [DOI] [PubMed] [Google Scholar]
- (49).Sarabia LD; Boughton BA; Rupasinghe T; van de Meene ML; Callahan DL; Hill CB; Roessner U Metabolomics 2018, 14 (5), 63. [DOI] [PMC free article] [PubMed] [Google Scholar]
- (50).Groseclose MR; Andersson M; Hardesty WM; Caprioli RM J. Mass Spectrom 2007, 42 (2), 254–262. [DOI] [PubMed] [Google Scholar]
- (51).Quanico J; Franck J; Cardon T; Leblanc E; Wisztorski M; Salzet M; Fournier I Biochim. Biophys. Acta, Proteins Proteomics 2017, 1865 (7), 891–900. [DOI] [PubMed] [Google Scholar]
- (52).Patterson NH; Tuck M; Lewis A; Kaushansky A; Norris J; Van de Plas R; Caprioli RM Anal. Chem 2018, 90 (21), 12404–12413. [DOI] [PMC free article] [PubMed] [Google Scholar]
- (53).Lauderdale KJ; Malone CL; Boles BR; Morcuende J; Horswill AR J. Orthop. Res 2009, 28 (l), 55–61. [DOI] [PubMed] [Google Scholar]
- (54).Chen J; Yoong P; Ram G; Torres VJ; Novick RP Plasmid 2014, 76, 1–7. [DOI] [PMC free article] [PubMed] [Google Scholar]
- (55).Prentice BM; Ryan DJ; Van de Plas R; Caprioli RM; Spraggins JM Anal. Chem 2018, 90, 5090–5099. [DOI] [PMC free article] [PubMed] [Google Scholar]
- (56).Casadonte R; Caprioli RM Nat. Protoc 2011, 6 (11), 1695–1709. [DOI] [PMC free article] [PubMed] [Google Scholar]
- (57).Hildonen S; Halvorsen TG; Reubsaet L Proteomics 2014, 14 (17–18), 2031–2041. [DOI] [PubMed] [Google Scholar]
- (58).Zipperer A; Konnerth MC; Laux C; Berscheid A; Janek D; Weidenmaier C; Burian M; Schilling NA; Slavetinsky C; Marschal M; Willmann M; Kalbacher H; Schittek B; Brotz-Oesterhelt H; Grond S; Peschel A; Krismer B Nature 2016, 535 (7613), 511–516. [DOI] [PubMed] [Google Scholar]
- (59).Cheng AG; DeDent AC; Schneewind O; Missiakas D Trends Microbiol. 2011, 19 (5), 225–232. [DOI] [PMC free article] [PubMed] [Google Scholar]
- (60).Wakeman CA; Moore JL; Noto MJ; Zhang YF; Singleton MD; Prentice BM; Gilston BA; Doster RS; Gaddy JA; Chazin WJ; Caprioli RM; Skaar EP Nat. Commun 2016, 7, 11951. [DOI] [PMC free article] [PubMed] [Google Scholar]
- (61).Attia AS; Schroeder KA; Seeley EH; Wilson KJ; Hammer ND; Colvin DC; Manier ML; Nicklay JJ; Rose KL; Gore JC; Caprioli RM; Skaar EP Cell Host Microbe 2012, 11(6), 664–673. [DOI] [PMC free article] [PubMed] [Google Scholar]
- (62).Moore JL; Becker KW; Nicklay JJ; Boyd KL; Skaar EP; Caprioli RM Proteomics 2014, 14 (7–8), 820–828. [DOI] [PMC free article] [PubMed] [Google Scholar]
- (63).Patterson NH; Tuck M; Van de Plas R; Caprioli RM Anal. Chem 2018, 90 (21), 12395–12403. [DOI] [PubMed] [Google Scholar]
- (64).Corbin BD; Seeley EH; Raab A; Feldmann J; Miller MR; Torres VJ; Anderson KL; Dattilo BM; Dunman PM; Gerads R; Caprioli RM; Nacken W; Chazin WJ; Skaar EP Science 2008, 319 (5865), 962–5. [DOI] [PubMed] [Google Scholar]
- (65).Stapels DAC; Ramyar KX; Bischoff M; von Kockritz-Blickwede M; Milder FJ; Ruyken M; Eisenbeis J; McWhorter WJ; Herrmann M; van Kessel KPM; Geisbrecht BV; Rooijakkers SHM Proc. Natl. Acad. Sci. U. S. A 2014, 111 (36), 13187–13192. [DOI] [PMC free article] [PubMed] [Google Scholar]
- (66).Rooijakkers SHM; Milder FJ; Bardoel BW; Ruyken M; van Strijp JAG; Gros P J. Immunol 2007, 179 (5), 2989–2998. [DOI] [PubMed] [Google Scholar]
- (67).Skaar EP; Schneewind O Microbes Infect. 2004, 6 (4), 390–397. [DOI] [PubMed] [Google Scholar]
- (68).Steinbakk M; Naess-Andresen CF; Lingaas E; Dale I; Brandtzaeg P; Fagerhol MK Lancet 1990, 336 (8718), 763–5. [DOI] [PubMed] [Google Scholar]
- (69).Clohessy PA; Golden BE Scand. J. Immunol 1995, 42 (5), 551–6. [DOI] [PubMed] [Google Scholar]
- (70).Hood MI; Skaar EP Nat. Rev. Microbiol 2012, 10 (8), 525–537. [DOI] [PMC free article] [PubMed] [Google Scholar]
- (71).Kehl-Fie TE; Skaar EP Curr. Opin. Chem. Biol 2010, 14 (2), 218–24. [DOI] [PMC free article] [PubMed] [Google Scholar]
- (72).Ludwig B; Bender E; Arnold S; Huttemann M; Lee I; Kadenbach B ChemBioChem 2001, 2 (6), 392–403. [DOI] [PubMed] [Google Scholar]
- (73).Wikstrom MK Nature 1977, 266 (5599), 271–3. [DOI] [PubMed] [Google Scholar]
Associated Data
This section collects any data citations, data availability statements, or supplementary materials included in this article.