Abstract
Background:
Epicardial fat (EF) is the visceral fat of the heart deposited under the visceral layer of the pericardium and has the same origin as abdominal visceral fat, which is shown to be strongly related to the development of coronary artery disease (CAD). We measured the volume of EF (EFV) by 64‐multidetector computed tomography (MDCT) and studied the relationship between EFV and the severity of CAD.
Hypothesis
Epicardial fat volume increases steeply in patients with significant coronary artery stenosis and in those with severe coronary artery calcification.
Methods
We studied 197 patients with suspected CAD who underwent 64‐MDCT and coronary angiography. Cross‐sectional tomographic cardiac slices (3.0 mm thick) from base to apex (30 to 40 slices per heart) were traced semiautomatically and EFV was measured by assigning Hounsfield units ranging from −30 to −250 to fat.
Results
Epicardial fat volume was 99.4 ± 40.0 ml (range, 11.6 to 263.8 mL) and coronary artery calcium score (CACS) was 267.2 ± 605.1 (range, 0 to 3780). There was a significant relationship between EFV and CACS (r = 0.210, P = 0.003). Patients with EFV >100 had a CACS that was significantly higher than in those with EFV <100 (384.0 ± 782.0 vs 174.8 ± 395.6; P = 0.016). The incidence of significant CAD was significantly higher in patients with EFV >100 compared with those with EFV <100 (40.2% vs 22.7%; P = 0.008). The EFV was significantly higher in patients with severe coronary artery stenosis and in those with severe coronary artery calcification (CACS >400).
Conclusions
Our results showed that EFV was associated with coronary atherosclerosis, and EFV increased steeply in patients with severe coronary artery stenosis and in those with severe coronary artery calcification. © 2011 Wiley Periodicals, Inc.
The authors have no funding, financial relationships, or conflicts of interest to disclose.
Introduction
Epicardial fat (EF) is the visceral fat of the heart deposited under the visceral layer of the pericardium and has the same origin as abdominal visceral fat, which is shown to be strongly related to the development of coronary artery disease (CAD). The accumulation of EF is known to be a rich source of free fatty acids and a number of inflammatory cytokines.1., 2., 3.
Several studies using echocardiography show the contradictory results between EF thickness and CAD severity.4., 5., 6.
Recent studies demonstrate that 64‐multidetector computed tomography (64‐MDCT) is suitable for volumetric quantitation of EF with higher accuracy than measurement of EF thickness by echocardiography.7., 8., 9. Several reports studied the relationship between EF volume (EFV) and CAD severity.10., 11., 12., 13. Although a modest relationship was found between EFV and severity of CAD, most studies did not find stepwise increase of EFV with increasing severity of coronary atherosclerosis.
Thus, we hypothesized that EFV increased steeply in patients with significant coronary artery stenosis and in those with severe coronary artery calcification. We measured the volume of EF by 64‐MDCT and studied the relationship between EFV and the severity of CAD.
Methods
Patients
From June 2008 through May 2009, 515 patients underwent 64‐MDCT for the evaluation of suspected CAD. We selected patients who underwent diagnostic coronary angiography following 64‐MDCT.
Patients were excluded who had: (1) history of myocardial infarction, heart failure, or coronary revascularization; (2) acute coronary syndrome; (3) electrocardiographic (ECG) evidence of Q‐wave myocardial infarction; and (4) wall‐motion abnormality on echocardiography. Thus we selected 197 patients.
First, we divided the 197 patients into 4 groups according to the severity of coronary artery stenosis measured by quantitative coronary angiography. Patients in group 1 were defined to have no coronary artery stenosis. Patients in groups 2, 3, and 4 were defined to have coronary artery stenosis with percent‐diameter stenosis between 10% and 49%, 50% and 69%, and 70% and 90%, respectively.14 Significant coronary artery stenosis was defined as stenosis >50% diameter.
Next, we divided these patients into 4 groups according to their CACS. Patients in groups A, B, C, and D were defined to have a CACS between 0 and 10, 11 and 100, 101 and 400, and >400, respectively. Significant coronary artery calcium was defined as CACS >400.
Multidetector Computed Tomography
All patients were scanned with a 64‐MDCT scanner (SOMATOM Sensation 64 Cardiac; Siemens Medical Solutions, Erlangen, Germany).
Patients with a heart rate >70 beats per minute received oral metoprolol (20 mg) before the 64‐MDCT scan. To achieve coronary vasodilation, we administered sublingual nitroglycerin 0.8 mg before the scan.
A native scan without contrast dye was performed to determine the total calcium burden of the coronary tree (sequential scan with 32 × 0.6‐mm collimation, tube current 60 mA at 120 kV). Contrast‐enhanced CT angiography data were acquired with the use of a spiral scan with 32 × 0.6‐mm collimation, 330‐ms gantry rotation, pitch of 0.2, and tube voltage at 120 kV.
A total of 64 overlapping 0.6‐mm slices per rotation were acquired with the use of a focal spot periodically moving in the longitudinal direction (z‐flying focal spot). Tube current was modulated according to the ECG, with a maximum current of 850 to 950 mA during a time period of approximately 330 ms centered at 375 ms before the next R‐wave and reduction by 80% during the remaining cardiac cycle. Contrast agent (60 to 70 mL; 370 mg iodine/mL) was injected intravenously (4.0 mL/second) followed by a 30‐mL saline chaser. Transaxial images were reconstructed using an ECG‐gated half‐scan reconstruction algorithm (temporal resolution 164 ms) and kernel B30f.
Image Interpretation
Computed tomography datasets were transferred to an offline workstation (Aquarius NetStation; TeraRecon Inc., San Mateo, CA) for image analysis. The total calcium score of all patients was calculated with dedicated software and expressed as Agatston scores.15 An independent reviewer evaluated the contrast‐enhanced 64‐MDCT scans with maximum intensity and curved multiplanar reconstruction techniques along multiple longitudinal axes and transversely. Standard display settings were used for the evaluation of the contrast‐enhanced 64‐MDCT scans (window width 800 Hounsfield units [HU]; window center 250 HU).
An independent observer identified coronary segments using a modified American Heart Association classification.16 Segments were classified as normal (smooth parallel or tapering borders), as having nonsignificant stenosis (luminal irregularities or <50% stenosis), or as having significant stenosis.
Measurement of Epicardial Fat Volume
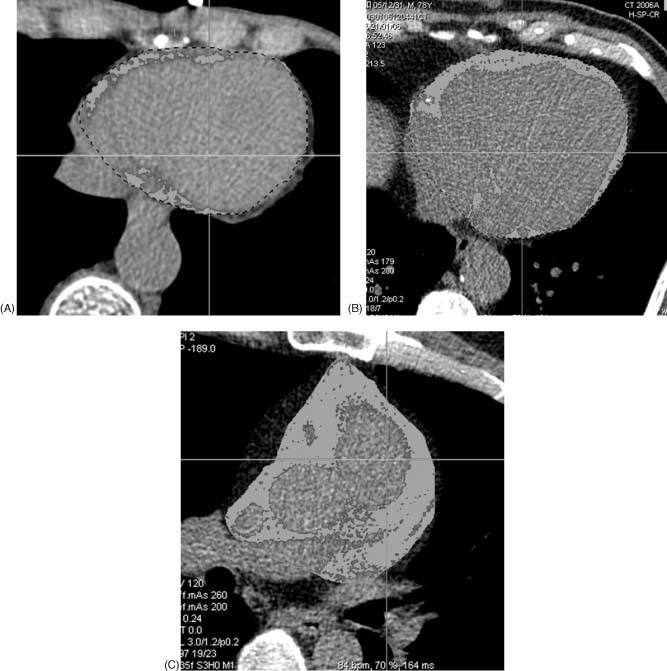
Epicardial fat was defined as the adipose tissue between the surface of myocardium and the visceral layer of the pericardium (visceral epicardium). Using the 3.0‐mm‐thick axial slices used for calcium scoring, we manually traced the parietal pericardium in every fourth slice starting from the aortic root to the apex. The computer software then automatically interpolated and traced the parietal pericardium in all slices interposed between the manually traced slices. The total number of slices was 30 to 40 per heart. All automatically traced slices were examined and verified for accuracy. Fat voxels were identified using threshold attenuation values of −30 to −250 HU (Figure 1). Intraobserver and interobserver variability for quantitation of EFV was <5%.
Figure 1.

Representative case of EF showing (A) normal EF (EFV 21 mL), (B) moderately increased EF (EFV 98 mL), and (C) markedly increased EF (EFV 253 mL). Abbreviations: EF, epicardial fat; EFV, epicardial fat volume.
Statistical Analysis
Data are expressed as mean ± SD. Continuous variables were compared by 2‐sided t test. Discrete variables were expressed as counts or percentages and compared with the χ 2 test or the Fisher exact test. We used 1‐factor ANOVA to determine the differences of EFV among the 4 groups. Also, we used Spearman rank correlation to determine the differences of incidence of EFV >100 among the 4 groups. A P value <0.05 was considered statistically significant.
Results
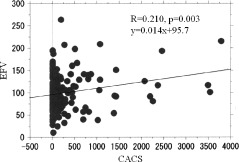
The clinical characteristics of the studied patients are shown in the Table 1. Epicardial fat volume was 99.4 ± 40.0 mL (range, 11.6 to 263.8 mL, median 93.0 mL) and CACS was 267.2 ± 605.1 (range, 0 to 3780; median 32). There was a significant but modest relationship between EFV and CACS (Figure 2). In patients with EFV >100, CACS was significantly higher than it was in those with EFV <100 (384.0 ± 782.0 vs 174.8 ± 395.6; P = 0.016).
Table 1.
Clinical Characteristics of Studied Patients (n = 197)
| Age, y | 65.1 ± 9.9 |
| Male sex | 123 (62.4) |
| Risk factors | |
| Hypertension | 118 (59.9) |
| Hyperlipidemia | 94 (47.7) |
| DM | 51 (25.9) |
| Smoking | 30 (15.2) |
| Obesity | 52 (26.4) |
| Laboratory data | |
| TG (mg/dL) | 171.0 ± 121.8 |
| HDL (mg/dL) | 47.4 ± 12.7 |
| LDL (mg/dL) | 112.9 ± 33.1 |
| Total cholesterol (mg/dL) | 189.5 ± 39.0 |
| Blood sugar (mg/dL) | 121.2 ± 33.8 |
| Medication | |
| Aspirin | 121 (61.4) |
| Statin | 119 (60.4) |
| ACEI/ARB | 70 (35.5) |
| CCB | 65 (33.0) |
| β‐Blocker | 53 (26.9) |
Abbreviations: ACEI, angiotensin‐converting enzyme inhibitor; ARB, angiotensin receptor blocker; CCB, calcium channel blocker; DM, diabetes mellitus; HDL, high‐density lipoprotein cholesterol; LDL, low‐density lipoprotein cholesterol; TG, triglycerides. Data are expressed as n (%) or mean ± SD.
Figure 2.

Relationship between EFV and CACS. Abbreviations: CACS, coronary artery calcification score; EFV, epicardial fat volume.
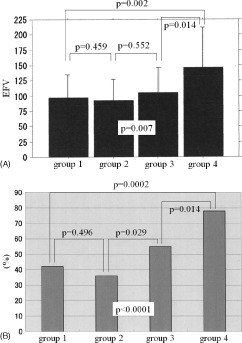
The incidence of significant CAD, defined as percent‐diameter stenosis >50%, was significantly higher in patients with EFV >100 compared with those with EFV <100 (40.2% vs 22.7%; P = 0.008). However, the incidence of CAD was not significantly different between the 2 groups (74.7% vs 71.8%; P = 0.649). As for the degree of coronary stenosis, the number of patients in groups 1, 2, 3, and 4 was 53, 50, 51, and 43, respectively. The EFV was significantly different among the 4 groups, at 97.0 ± 36.9 mL, 92.4 ± 34.8 mL, 105.2 ± 41.1 mL, and 146.4 ± 63.9 mL, respectively (ANOVA P = 0.0068; Figure 3A). Also, the percentage of patients with EFV >100 was significantly different among the 4 groups, at 42%, 36%, 55%, and 78%, respectively (P < 0.0001; Figure 3B).
Figure 3.

Results in groups 1 to 4 indicating (A) EFV and (B) incidence of patients with EFV >100 in each group. Abbreviations: EFV, epicardial fat volume.
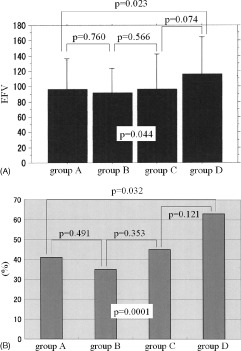
As for the CACS, the number of patients in groups A, B, C, and D was 79, 47, 38, and 35, respectively. The EFV was significantly different among the 4 groups, at 97.2 ± 37.7 mL, 92.2 ± 31.8 mL, 97.0 ± 44.1 mL, and 116.2 ± 46.5 mL, respectively (P = 0.044; Figure 4A). Also, the percentage of patients with EFV >100 was significantly different among the 4 groups, at 41%, 35%, 45%, and 63%, respectively (P = 0.0001; Figure 4B).
Figure 4.

Results in groups A to D indicating (A) EFV and (B) incidence of patients with EFV >100 in each group. Abbreviations: EFV, epicardial fat volume.
Discussion
Our results showed that EFV was associated with coronary artery stenosis and coronary artery calcification. Particularly, EFV increased steeply in patients with significant coronary artery stenosis, defined as percent‐diameter stenosis >50%, and in those with severe coronary artery calcification, defined as CACS >400.
Previous studies using echocardiography showed contradictory results between EF and CAD.4., 5., 6. There are several suggested reasons for this discrepancy. First, there are differences in measurement technique and study populations among these studies. Second, echocardiographic measurement of EF quantity is limited to the free wall of the right ventricle, which is not necessarily a reliable and accurate representative of total EF quantity. Third, measurement of EF may be inaccurate due to lower resolution of echocardiography. Fourth, delineation of EF and pericardial fat may be difficult in some patients.
Due to its high temporal and spatial resolution, 64‐MDCT provides an accurate and reproducible quantitation of EF.7., 8., 9. Gorter et al demonstrated that volumetric quantitation of EF using cardiac CT is highly reproducible compared with more simple measurements such as EF thickness and area.17
Previous studies using MDCT demonstrated the association between EF and traditional risk factors. Rosito et al, in a substudy of the Framingham Heart Study, found that pericardial fat was correlated with multiple measures of adiposity and cardiovascular disease risk factors.18 They also found that pericardial fat was associated with coronary artery calcification, whereas intrathoracic fat was associated with abdominal aortic calcification. The study of de Vos et al showed that pericoronary EF thickness was strongly related to vascular risk factors and coronary calcification in postmenopausal women.19 The positive correlation between EF and the number of metabolic alterations suggests that EF might be a valuable quantitative marker of metabolic impairments and systemic atherosclerosis, and provides us with a clue to risk stratification for CAD.
Recent studies investigated the relationship between EFV and severity of CAD.10., 11., 12., 13. Although they found a modest relationship between EFV and CAD severity, most studies did not find stepwise increase of EFV with increasing severity of coronary atherosclerosis. Gorter et al measured epicardial adipose tissue volume in 128 patients and found that it was not associated with severity of coronary atherosclerosis and the extent of coronary artery calcification, although they found the relationship in patients with body mass index <27.12 Djaberi et al found that epicardial adipose tissue volume did not increase with increasing severity of atherosclerosis despite significant relation between epicardial adipose tissue volume and presence of coronary atherosclerosis.10
In contrast, our results showed that EFV was significantly higher only in patients with the most severe coronary artery stenosis and most severe coronary artery calcification compared with those without coronary artery stenosis and with no or little coronary artery calcium. Ueno et al found that increased EFV was the strongest independent determinant of the presence of totally occluded lesions.13 Thus, our results suggest that EF accumulation does not increase stepwise with increasing severity of coronary atherosclerosis, but increases steeply with the development of severe coronary artery stenosis and severe coronary artery calcification.
Epicardial fat is more closely related to visceral adipose tissue than total‐body fat. A role has been suggested for EF in the pathogenesis of CAD. Significant proinflammatory and proatherogenic biochemical and cellular differences have been shown between epicardial and subcutaneous adipose tissue in patients undergoing coronary artery bypass surgery.1 In addition, expression of adiponectin is significantly lower in the epicardial adipose tissue of patients with CAD than in healthy controls.2 Some reports have suggested a crucial role of EF in the development of coronary atherosclerosis through changes in adipocytokine expressions in EF, which promote proinflammatory characteristics, thereby possibly facilitating the progression of coronary atherosclerosis.1., 2., 3. Adipose tissue surrounding coronary arteries is in close contact with the adventitia and may aggravate vessel‐wall inflammation and stimulate the progression of atherosclerosis from “outside to inside.” The severity of the proinflammatory state may increase steeply in patients with severe atherosclerosis. Some studies suggest that atherosclerotic plaques in patients with large amounts of EF contain abundant prothrombotic and proinflammatory particles and are susceptible to plaque rupture and thrombus formation.20., 21., 22. However, the precise pathophysiologic interaction between EF and the coronary wall with respect to development of coronary atherosclerosis remains to be elucidated.
There are some limitations in our study. First, the number of studied patients was relatively small. Second, the patients were referred for evaluation of suspected CAD; thus, this study may be affected by selection bias. Third, this study was restricted to the evaluation of the association between EFV and coronary atherosclerosis. The pathophysiological effect of EF accumulation on predisposition to atherosclerosis was not investigated. Fourth, no follow‐up data were available. Although it would be interesting to observe the outcome in these patients, it is not available. Thus, the prognostic value of EFV was not elucidated.
Conclusion
Our results showed that EFV was associated with coronary atherosclerosis, and EFV increased steeply in patients with significant coronary artery stenosis and in those with severe coronary artery calcification. Quantitation of EF may be useful, in addition to coronary artery calcium score and coronary angiography, to identify patients at risk for CAD.
References
- 1. Mazurek T, Zhang L, Zalewsky A, et al. Human epicardial adipose tissue is a source of inflammatory mediators. Circulation. 2003;108:2460–2466. [DOI] [PubMed] [Google Scholar]
- 2. Iacobellis G, Pistilli D, Gucciardo M, et al. Adiponectin expression in human epicardial adipose tissue in vivo is lower in patients with coronary artery disease. Cytokine. 2005;29:251–255. [DOI] [PubMed] [Google Scholar]
- 3. Baker AR, Silva NF, Quinn DW, et al. Human epicardial adipose tissue expresses a pathogenic profile of adipocytokines in patients with cardiovascular disease. Cardiovasc Diabetol. 2006;5:1. [DOI] [PMC free article] [PubMed] [Google Scholar]
- 4. Chaowalit N, Somers VK, Pellikka PA, et al. Subepicardial adipose tissue and the presence and severity of coronary artery disease. Atherosclerosis. 2006;186:354–359. [DOI] [PubMed] [Google Scholar]
- 5. Jeong JW, Jeong MH, Yun KH, et al. Echocardiographic epicardial fat thickness and coronary artery disease. Circ J. 2007;71: 536–539. [DOI] [PubMed] [Google Scholar]
- 6. Ahn SG, Lim HS, Joe DY, et al. Relationship of epicardial adipose tissue by echocardiography to coronary artery disease. Heart. 2008;94:e7. [DOI] [PubMed] [Google Scholar]
- 7. Taguchi R, Takasu J, Itani Y, et al. Pericardial fat accumulation in men as a risk factor for coronary artery disease. Atherosclerosis. 2001;157:203–209. [DOI] [PubMed] [Google Scholar]
- 8. Wheeler GL, Shi R, Beck SR, et al. Pericardial and visceral adipose tissue measured volumetrically with computed tomography are highly associated in type 2 diabetic families. Invest Radiol. 2005;40:97–101. [DOI] [PubMed] [Google Scholar]
- 9. Abbara S, Desai JC, Ricardo CC, et al. Mapping of epicardial fat with multi‐detector computed tomography to facilitate percutaneous transepicardial arrhythmia ablation. Eur J Radiol. 2006;57:417–422. [DOI] [PubMed] [Google Scholar]
- 10. Djaberi R, Schuijf JD, van Werkhoven JM, et al. Relation of epicardial adipose tissue to coronary atherosclerosis. Am J Cardiol. 2008;102:1602–1607. [DOI] [PubMed] [Google Scholar]
- 11. Sarin S, Wenger C, Marwaha A, et al. Clinical significance of epicardial fat measured using cardiac multislice computed tomography. Am J Cardiol. 2008;102:767–771. [DOI] [PubMed] [Google Scholar]
- 12. Gorter PM, de Vos AM, van der Graaf Y, et al. Relation of epicardial and pericoronary fat to coronary atherosclerosis and coronary artery calcium in patients undergoing coronary angiography. Am J Cardiol. 2008;102:380–385. [DOI] [PubMed] [Google Scholar]
- 13. Ueno K, Anzai T, Jinzaki M, et al. Increased epicardial fat volume quantified by 64‐multidetector computed tomography is associated with coronary atherosclerosis and totally occlusive lesions. Circ J. 2009;73:1927–1933. [DOI] [PubMed] [Google Scholar]
- 14. Stadius ML, Alderman EL. Coronary artery revascularization: critical need for, and consequences of, objective angiographic assessment of lesion severity. Circulation. 1990;82: 2231–2234. [DOI] [PubMed] [Google Scholar]
- 15. Agatston AS, Janowitz WR, Hildner FJ, et al. Quantification of coronary artery calcium using ultrafast computed tomography. J Am Coll Cardiol. 1990;15:827–832. [DOI] [PubMed] [Google Scholar]
- 16. Austen WG, Edwards JE, Frye RL, et al. A reporting system on patients evaluated for coronary artery disease: Report of the Ad Hoc Committee for Grading of Coronary Artery Disease, Council on Cardiovascular Surgery, American Heart Association. Circulation. 1975;51(4 suppl): 5–40. [DOI] [PubMed] [Google Scholar]
- 17. Gorter PM, van Lindert AS, de Vos AM, et al. Quantitation of epicardial and peri‐coronary fat using cardiac computed tomography: reproducibility and relation with obesity and metabolic syndrome in patients suspected of coronary artery disease. Atherosclerosis. 2008;197:896–903. [DOI] [PubMed] [Google Scholar]
- 18. Rosito GA, Massaro JM, Hoffman U, et al. Pericardial fat, visceral abdominal fat, cardiovascular disease risk factors, and vascular calcification in a community‐based sample: the Framingham Heart Study. Circulation. 2008;117:605–613. [DOI] [PubMed] [Google Scholar]
- 19. De Vos AM, Prokop M, Roos CJ, et al. Peri‐coronary adipose tissue is related to cardiovascular risk factors and coronary artery calcification in post‐menopausal women. Eur Heart J. 2008;29:777–783. [DOI] [PubMed] [Google Scholar]
- 20. Croce K, Libby P. Intertwining of thrombosis and inflammation in atherosclerosis. Curr Opin Hematol. 2007;14:55–61. [DOI] [PubMed] [Google Scholar]
- 21. Libby P. Current concepts of the pathogenesis of the acute coronary syndromes. Circulation. 2001;104:365–372. [DOI] [PubMed] [Google Scholar]
- 22. Hackett D, Davies G, Chierchia S, et al. Intermittent coronary occlusion in acute myocardial infarction: value of combined thrombolysis and vasodilator therapy. N Engl J Med. 1987;317: 1055–1059. [DOI] [PubMed] [Google Scholar]


