

Abstract
Background:
Although peak creatine kinase‐myocardial band (CK‐MB) and troponin levels have been correlated with mortality among patients with acute myocardial infarction (AMI), the independent prognostic implications of these markers have not been compared.
Hypothesis:
We hypothesized that in patients with AMI, peak troponin levels (as compared to peak CK‐MB levels) would have greater prognostic value.
Methods:
We examined AMI patients in the National Cardiovascular Data Registry ACTION Registry–GWTG (Acute Coronary Treatment and Intervention Outcomes Network Registry–Get With The Guidelines) with CK‐MB and troponin I levels recorded, excluding patients who were transferred in or out. Peak marker levels, standardized by the local laboratory upper limit of normal and assay standard deviation, were fitted into the previously validated ACTION Registry–GWTG mortality model to compare prognostic value.
Results:
Between January 2007 and March 2009, 16 009 ST‐segment elevation myocardial infarction (STEMI) and 26854 non–ST‐segment elevation myocardial infarction (NSTEMI) patients were identified. Peak marker ratios were directly associated with in‐hospital mortality in both STEMI and NSTEMI patients. Peak CK‐MB had slightly greater discrimination compared with peak troponin I in predicting mortality in both STEMI (model C‐statistic 0.881 vs 0.877, P = 0.011) and NSTEMI (C‐statistic 0.831 vs 0.824, P = 0.001) patients.
Conclusions:
Both peak CK‐MB and peak troponin I levels are independently associated with in‐hospital mortality in this large contemporary database of AMI patients treated in routine practice. Peak marker values slightly improved model performance in prognosticating in‐hospital mortality; the incremental value was higher with CK‐MB than with troponin I. These findings may help to guide future risk stratification algorithms and contribute to more efficient use of serial cardiac marker measurements in clinical practice. Clin. Cardiol. 2011 DOI: 10.1002/clc.21980
This project was supported by grant number U18HS016964 from the Agency for Healthcare Research and Quality (AHRQ). The content is solely the responsibility of the authors and does not necessarily represent the official views of the AHRQ. The funding source had no role in the design or implementation of the study, or in the decision to seek publication. The authors have no other funding, financial relationships, or conflicts of interest to disclose.
Introduction
Elevated cardiac markers, such as cardiac troponin or creatine kinase‐myocardial band (CK‐MB), are central to making the diagnosis of acute myocardial infarction (AMI).1 Prior studies have separately confirmed in both ST‐segment elevation myocardial infarction (STEMI) and non–ST‐segment elevation myocardial infarction (NSTEMI) patients that the magnitude of cardiac marker elevation correlates with the extent of myocardial necrosis, and thus with the subsequent risk of adverse outcomes.2., 3., 4., 5. However, these studies have not compared the differential independent prognostic implications of peak troponin levels compared with peak CK‐MB levels for STEMI vs NSTEMI patients. Therefore, we used the National Cardiovascular Data Registry Acute Coronary Treatment and Intervention Outcomes Network Registry–Get With The Guidelines (ACTION Registry–GWTG) database to compare peak troponin and peak CK‐MB levels for their ability to predict mortality risk and whether this relationship differed between STEMI vs NSTEMI patients.
Methods
The ACTION Registry–GWTG is a voluntary registry that receives data on consecutive AMI patients at more than 300 participating hospitals in the United States.6 The individual institutional review board of each hospital approves participation in ACTION Registry–GWTG. Informed consent was not required as data were abstracted anonymously. Trained data collection personnel perform data collection via individual chart review. Data quality is maintained through mechanisms including point‐of‐entry and quarterly data quality checks and query reconciliation.
Patient Population
We initially identified 117 781 patients from 343 sites from January 2007 through March 2009 (Figure 1). We excluded patients with missing CK‐MB or troponin values, and patients from sites where missing was the most common value entered for either CK‐MB or troponin upper limit of normal (ULN). Patients with different troponin assays for baseline and peak samples or peak values below the local laboratory ULN were then excluded. Patients transferred in or out of the reporting hospital were excluded, because marker levels prior to transfer in and outcomes after transfer out could not be collected. For patients with multiple admissions, we included only the index admission. Finally, we excluded patients with troponin T levels reported, because this group made up only a small proportion of the analysis population.
Figure 1.
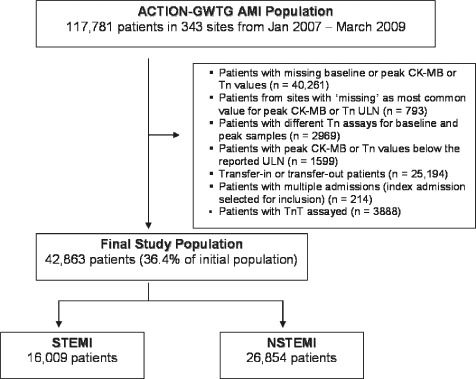
Acute Coronary Treatment and Intervention Outcomes Network–Get With The Guidelines (ACTION–GWTG) AMI population. The original ACTION Registry–GWTG AMI population is broken down by those patients who were included as well as those that were excluded from the final study population. The final study population is then displayed according to those patients with ST‐segment elevation myocardial infarction (STEMI) vs non–ST‐segment elevation myocardial infarction (NSTEMI). Abbreviations: CK‐MB, creatine kinase‐myocardial band; Tn, troponin; TnT, troponin T; ULN, upper limit of normal.
Cardiac Marker Measurements
There are multiple commercially available assays for CK‐MB and troponin I used by participating ACTION Registry–GWTG hospitals. As a result, there is unavoidable heterogeneity in local laboratory ULN among hospitals. Recognizing this limitation, we used the ratio of peak marker levels divided by the local laboratory defined ULN (peak marker ratio = peak marker level/local laboratory ULN). The use of this ratio to normalize cardiac marker results from the various marker assays available in clinical practice has been used previously for clinical trial and registry database analyses and has been included in the definitions of AMI contained within the universal definition of myocardial infarction.1., 4., 5.
Statistical Methods
Patient characteristics, cardiac markers, and in‐hospital outcomes were summarized using percentages for categorical variables and medians (1st quartile, 3rd quartile) for continuous variables.
The peak troponin I and peak CK‐MB ratios were determined for each individual patient. Because there was a large range in the ratio values, we transformed the ratios to the standardized peak marker ratios by dividing the peak marker ratio with the standard deviation of the STEMI or NSTEMI population‐specific peak marker ratio (standardized peak marker ratio = peak marker ratio/standard deviation of the peak marker ratio). The standardized peak troponin I ratio or standardized peak CK‐MB ratio was tested as a predictor to linearly or nonlinearly (using a restricted cubic spline term with 3 knots at the 10th, 50th, and 90th percentile) fit logistic generalized estimating equations models with compound symmetric working correlation matrices separately to derive the predicted in‐hospital mortality in the STEMI and NSTEMI populations. The variables used in the models were adapted from the validated ACTION Registry–GWTG in‐hospital mortality model.7 The variables were: age; baseline serum creatinine; systolic blood pressure at admission; the presence of heart failure, cardiogenic shock, or both at admission; heart rate on admission (fitted as a linear spline with knot at 70 beats per minute); and history of peripheral arterial disease. Baseline troponin ratio (included in the ACTION Registry–GWTG in‐hospital mortality model) was not included in our models because it correlated strongly with peak troponin and peak CK‐MB ratio. The predicted in‐hospital mortality risk was calculated as a function of the standardized peak marker ratio for a hypothetical patient having average values for each patient‐level covariate. The C‐statistic was calculated by observed and predicted mortality. The difference in the C‐statistics for the standardized peak troponin ratio vs standardized peak CK‐MB ratio for in‐hospital mortality models that separately evaluated STEMI and NSTEMI patients was tested with the method described by DeLong et al.8 Briefly, when 2 or more curves are constructed based on tests performed on the same set of individuals, the correlated nature of the data must be accounted for in all statistical analyses on the differences between the curves. This method analyzes the areas under correlated receiver operation characteristics curves with a nonparametric approach by using the theory on generalized U‐statistics to generate an estimated covariance matrix. This has a χ 2 distribution, and a test for significance can then be performed.
Finally, we performed a sensitivity analysis by excluding all patients who died within 24 hours of admission, as the marker levels for these patients may have continued to rise if death had not occurred. Additionally, because biomarker release may be confounded by cardiac surgery, we performed an additional sensitivity analysis by excluding all patients who had coronary artery bypass grafting (CABG) surgery during the same admission. We used an α level of 0.05 to assess statistical significance. These analyses were performed with SAS version 9.2 (SAS Institute, Cary, NC).
Results
After applying exclusions, the final study population consisted of 26 854 NSTEMI (37.6% of the initial NSTEMI population) and 16 009 STEMI (34.6% of the initial STEMI population) patients. The baseline demographics, clinical characteristics, and in‐hospital outcomes are shown in Tables 1, 2 for the final study population.
Table 1.
Patient Baseline Characteristics
| Baseline Patient Characteristics | Overall, n = 42 863 | NSTEMI, n = 26 854 | STEMI, n = 16 009 |
|---|---|---|---|
| Demographics | |||
| Age, ya | 65 (54, 77) | 68 (57, 80) | 60 (52, 72) |
| Female, % | 36.6 | 39.8 | 31.3 |
| Medical history, % | |||
| Diabetes mellitus | 30.2 | 35.0 | 22.3 |
| Hypertension | 70.6 | 75.8 | 61.8 |
| Dyslipidemia | 55.8 | 59.4 | 49.7 |
| Current or recent smoker (<1 year) | 33.2 | 27.9 | 41.9 |
| Prior MI | 25.9 | 29.7 | 19.4 |
| Prior congestive heart failure | 13.4 | 18.2 | 5.5 |
| Prior revascularization | 31.5 | 36.4 | 23.4 |
| Prior PCI | 22.9 | 25.0 | 19.5 |
| Prior CABG | 15.3 | 20.2 | 7.1 |
| Prior stroke | 8.7 | 10.8 | 5.2 |
| Peripheral arterial disease | 9.8 | 12.5 | 5.4 |
| Currently on dialysis | 2.3 | 3.0 | 1.1 |
| Features at presentation | |||
| Signs of heart failure and cardiogenic shock, % | |||
| Heart failure only | 17.0 | 22.0 | 8.6 |
| Shock only | 0.9 | 0.3 | 2.1 |
| Both | 2.0 | 1.0 | 3.5 |
| HR on admission, bpma | 82 (69, 98) | 84 (71, 100) | 78 (65, 93) |
| Systolic blood pressure, mm Hga | 142 (122, 163) | 145 (125, 166) | 138 (118, 159) |
| Baseline creatinine, mg/dL (nondialysis patients)a | 1.1 (0.9, 1.4) | 1.1 (0.9, 1.4) | 1.1 (0.9, 1.3) |
| Baseline hemoglobin, g/dLa | 13.8 (12.4, 15.0) | 13.5 (12.0, 14.7) | 14.3 (13.0, 15.3) |
| Antithrombin use, % | |||
| Any heparin | 88.0 | 88.2 | 87.7 |
| Bivalirudin | 13.6 | 13.1 | 14.3 |
| Fondaparinux | 0.3 | 0.3 | 0.3 |
| Reperfusion strategy (STEMI only), % | |||
| None | 4.6 | ||
| Thrombolytic | 1.3 | ||
| Primary PCI | 94.0 | ||
| Revascularization strategy (NSTEMI only), % | |||
| No cardiac catheterization | 25.8 | ||
| Catheterization only, no revascularization | 21.8 | ||
| PCI | 42.1 | ||
| CABG | 10.2 | ||
Abbreviations: BMI, body mass index; CABG, coronary artery bypass graft surgery; HR, heart rate; MI, myocardial infarction; NSTEMI, non–ST‐segment elevation myocardial infarction; PCI, percutaneous coronary intervention; STEMI, ST‐elevation segment elevation myocardial infarction.
Data are expressed as percentages.
Continuous variables are expressed as median (25th, 75th percentiles).
Table 2.
Peak Cardiac Marker Results
| Overall, n = 42 863 | NSTEMI, n = 26 854 | STEMI, n = 16 009 | |
|---|---|---|---|
| Median peak troponin I ratio, ×ULNa | 61.3 (14.0, 256.0) | 33.7 (8.4, 129.9) | 174.8 (44.9, 635.3) |
| Mean peak troponin I ratio, ×ULNb | 319.3 ± 731.1 | 156.5 ± 344.8 | 592.4 ± 1054.8 |
| Median standardized peak troponin I ratioa | 0.12 (0.03, 0.46) | 0.10 (0.02, 0.38) | 0.17 (0.04, 0.60) |
| Median peak CK‐MB ratio, ×ULNa | 7.8 (2.5, 24.7) | 4.3 (1.8, 12.2) | 22.0 (7.9, 46.4) |
| Mean peak CK‐MB ratio, ×ULNb | 19.3 ± 27.8 | 10.9 ± 16.4 | 33.4 ± 35.9 |
| Median standardized peak CK‐MB ratioa | 0.36 (0.13, 0.98) | 0.26 (0.11, 0.74) | 0.61 (0.22, 1.29) |
Abbreviations: CK‐MB, creatine kinase‐myocardial band; NSTEMI, non–ST‐segment elevation myocardial infarction; STEMI, ST‐segment elevation myocardial infarction; ULN, upper limit of normal.
Data presented as median (25th, 75th percentiles).
Data presented as mean ± standard deviation.
NSTEMI Patients
The median age of the NSTEMI patients was 68 years, nearly 40% were female, and almost a quarter (22%) had heart failure on admission (Table 1). Most patients (almost 90%) received some form of antithrombotic treatment, and about three‐fourths had coronary angiography performed. Almost half of the patients underwent either percutaneous coronary intervention (PCI) or CABG during their admission.
The peak troponin I value was the first measurement in 12.1% of the population. The median peak troponin I ratio was 33.7 (interquartile range [IQR], 8.4–129.9) (Table 2). Similarly, 27.7% of the patients had the first measurement as the peak CK‐MB value, and the median peak CK‐MB ratio was 4.3 (IQR, 1.8–12.2). The unadjusted in‐hospital mortality rate among NSTEMI patients was 4.5% (Table 3).
Table 3.
In‐Hospital Outcomes
| In‐Hospital Clinical Outcomes | Overall, n = 42 863, % | NSTEMI, n = 26 854, % | STEMI, n = 16 009, % |
|---|---|---|---|
| All‐cause death | 4.9 | 4.5 | 5.5 |
| All‐cause death or MI | 5.8 | 5.5 | 6.4 |
| Congestive heart failure | 7.9 | 8.3 | 7.1 |
| Cardiogenic shock | 4.1 | 2.7 | 6.4 |
| Stroke | 0.8 | 0.8 | 0.7 |
Abbreviations: MI, myocardial infarction; NSTEMI, non–ST‐segment elevation myocardial infarction; STEMI, ST‐segment elevation myocardial infarction.
STEMI Patients
STEMI patients were younger than NSTEMI patients (median age, 60 years) and almost 30% were female. More than 95% of the STEMI population received reperfusion therapy, with the vast majority undergoing primary PCI. Nearly 6% of the STEMI population had CABG during the index admission. In the STEMI population, 7.3% of peak troponin I values were at baseline. The median peak troponin I ratio was 174.8 (IQR, 44.9–635.3). For CK‐MB, 15.5% of peak CK‐MB values were the baseline measurement. The median peak CK‐MB ratio was 22.0 (IQR, 7.9–46.4) (Table 2). The unadjusted in‐hospital mortality rate among STEMI patients was 5.5%, with other adverse outcomes more common with STEMI compared with NSTEMI patients (Table 3).
Independent Prognostic Implications of Peak Cardiac Marker Levels
In NSTEMI patients, the observed in‐hospital mortality risk increased with increasing values for both peak CK‐MB and troponin I ratios (Figure 2A,B). Before incorporating standardized peak marker ratios, the in‐hospital mortality model C‐statistic was 0.816. When standardized peak CK‐MB and troponin I ratios were added separately as variables into the in‐hospital mortality model, the model C‐statistic increased to 0.831 and 0.824, respectively. The model discriminated better using standardized peak CK‐MB ratio as compared with standardized peak troponin I ratio (P = 0.0006).
Figure 2.
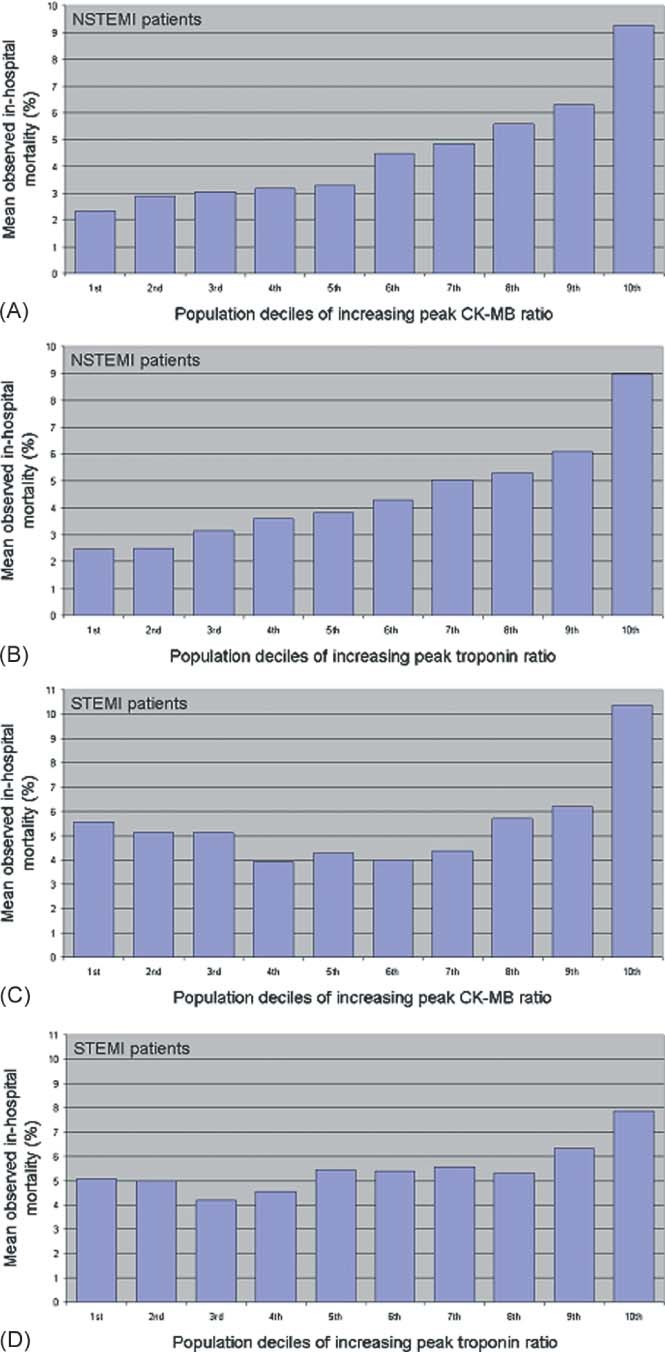
Observed in‐hospital mortality across deciles of increasing marker ratios in non–ST‐segment elevation myocardial infarction (NSTEMI) and ST‐segment elevation myocardial infarction (STEMI) patients. Displayed are the mean observed in‐hospital mortality percentages for NSTEMI patients, broken down by increasing population deciles of peak creatine kinase‐myocardial band (CK‐MB) ratio (A), as well as peak troponin I ratio (B). Displayed are the mean observed in‐hospital mortality percentages for STEMI patients, broken down by increasing population deciles of peak CK‐MB ratio (C) as well as peak troponin I ratio (D).
The relationship between peak marker ratios and observed in‐hospital mortality is more complex in STEMI patients, particularly in the lower ranges of marker ratios (Figure 2C,D). Because of this, when incorporated into the in‐hospital mortality model, both standardized peak marker ratio variables were added as nonlinearly restricted cubic spline terms. The STEMI in‐hospital mortality model, before including standardized peak marker ratios, had a C‐statistic of 0.875. Compared with when the standardized peak troponin I ratio variable was added (C‐statistic = 0.877), the model C‐statistic was greater with the standardized peak CK‐MB ratio variable incorporated into the model (C‐statistic = 0.881) (P = 0.011).
Sensitivity Analyses
In the NSTEMI population, 133 (0.5%) patients died within 24 hours. After excluding these patients, the model incorporating the standardized peak CK‐MB ratio variable still had better discrimination than the model with the troponin I ratio variable (C‐statistic 0.825 vs 0.819, P = 0.002). Similarly, after excluding 165 (1.0%) patients, the model with standardized peak CK‐MB ratio continued to perform slightly better in STEMI (C‐statistic 0.878 vs 0.873, P = 0.008).
We also repeated the analyses after excluding patients who underwent CABG during the same admission. After excluding 2759 (10.3%) NSTEMI patients, the model with the standardized peak CK‐MB ratio continued to discriminate better (C‐statistic 0.839 vs 0.830, P = 0.0001). In the STEMI population, 896 (5.6%) patients underwent CABG. After excluding these patients, the model with peak CK‐MB still performed slightly better than the model with peak troponin I (C‐statistic 0.886 vs 0.883, P = 0.012).
Discussion
In patients with AMI, serial measurements of both cardiac troponin and CK‐MB levels are commonly performed, yet the independent prognostic implications of these markers' peak values have not previously been compared by AMI classification. The results of our analysis provide insight into potential strategies of cardiac marker measurement among STEMI and NSTEMI patients.
Our results indicate that both peak CK‐MB and peak troponin I have independent incremental or additive prognostic value among patients treated in contemporary clinical practice for NSTEMI and STEMI. For STEMI patients, these findings are in keeping with the well‐established practice of repeat CK‐MB sampling to determine the peak value, which provides a relative estimate of infarct size. However, our results reveal prognostic utility for repeat marker sampling among NSTEMI patients as well. This finding is relevant as marker testing in NSTEMI patients is currently used predominantly as a diagnostic tool and a decision point for intensifying treatment.9., 10. Thus, our findings suggest that there is incremental prognostic value in identifying the peak marker value, regardless of AMI classification.
The differential contributions of troponin vs CK‐MB levels to mortality risk prediction have not been previously evaluated. In this analysis, we show that the in‐hospital mortality risk model discriminates better with the addition of peak CK‐MB levels compared with peak troponin levels in both NSTEMI and STEMI populations. Although troponin is currently the recommended marker for diagnosing AMI,1 our findings imply that after diagnosis, repeated measurements of CK‐MB may be preferable for further risk stratification. This strategy may also be preferred because CK‐MB levels are more sensitive in diagnosing reinfarction1 and can be processed at a lower cost compared with troponin levels. Therefore, a potential clinically yet cost‐effective algorithm for the management of a patient with chest pain would be to use troponin testing for AMI diagnosis, then switch to serial CK‐MB testing to guide subsequent risk stratification and treatment decision making.
Notwithstanding these suggestions, our results show that the difference in performance of the models with the addition of either peak marker level was modest. The predictive capability of the model was not substantially enhanced, as assessed by an improvement in the model C‐statistic, beyond that provided by other variables in the established model.7 This is consistent with previous studies where the addition of a single variable frequently does not substantially increase the C‐statistics of an established multivariable model.11 Therefore, initial treatment strategies for AMI patients should still be driven by early risk stratification incorporating baseline clinical and hemodynamic factors. Peak cardiac marker data can then be used to guide subsequent management decisions such as assessment of myocardial viability, intensity of secondary prevention, and timing of outpatient follow‐up or invasive procedures.
Limitations
Our study has limitations that merit discussion. First, the final study population consisted of 36.4% of the initial AMI population after exclusions; nevertheless, there were data still available for more than 42 000 patients, representing the largest patient sample to date for this type of analysis. Furthermore, as the unadjusted mortality rates in the excluded patient population were similar to the final study population in both the NSTEMI (5.6% vs 5.5%, respectively) and STEMI cohort (3.6% vs 4.5%, respectively) populations, we believe that this would not have significantly affected our findings. Second, the ACTION Registry–GWTG collects only in‐hospital outcomes; therefore, we cannot examine the association with longer‐term outcomes. Third, participation in this registry is voluntary and likely reflects an inherent interest in quality improvement. Furthermore, participating hospitals tend to be larger urban referral centers with access to PCI and CABG services. These factors may result in different outcomes for patients treated at participating hospitals compared with those treated at nonparticipating hospitals. Fourth, data on the specific type of troponin I assay used by individual hospitals were not collected in the registry. However, the available data reflect actual clinical practice and the associated information that was available to treating physicians when therapeutic decisions were made. Fifth, because data were collected retrospectively, there is no standardized schedule for biomarker testing in the registry, and it is left to the treating physician's discretion and local clinical practice standards. Additionally, only the baseline and peak values are recorded on the case‐report form, so we could not determine the temporal relation of cardiac marker assessments beyond these recorded values. Finally, the standardized form of the peak marker ratio is not a commonly used technique, but was employed because of the large variation in peak marker ratio values.
Conclusion
Both peak CK‐MB and peak troponin I levels are significantly and independently associated with in‐hospital mortality in this large contemporary database of AMI patients treated in routine clinical practice. For both STEMI and NSTEMI patients, addition of peak marker values to the risk prediction model slightly improves model performance in prognosticating in‐hospital mortality; the incremental value was higher with CK‐MB than with troponin I. These findings may help to guide future risk stratification algorithms for AMI patients and may contribute to more efficient use of serial cardiac marker measurements in clinical practice.
Acknowledgements
The authors would like to thank Erin LoFrese for her editorial contributions to this manuscript. Ms. LoFrese did not receive compensation for her contributions, except for her employment at the institution where this study was conducted.
References
- 1. Thygesen K, Alpert JS, White HD. Universal definition of myocardial infarction. Circulation. 2007;116:2634–2653. [DOI] [PubMed] [Google Scholar]
- 2. Christenson RH, Vollmer RT, Ohman EM, et al. Relation of temporal creatine kinase‐MB release and outcome after thrombolytic therapy for acute myocardial infarction. TAMI Study Group. Am J Cardiol. 2000;85:543–547. [DOI] [PubMed] [Google Scholar]
- 3. Chia S, Senatore F, Raffel OC, et al. Utility of cardiac biomarkers in predicting infarct size, left ventricular function, and clinical outcome after primary percutaneous coronary intervention for ST‐segment elevation myocardial infarction. JACC Cardiovasc Interv. 2008;1:415–423. [DOI] [PubMed] [Google Scholar]
- 4. Alexander JH, Sparapani RA, Mahaffey KW, et al. Association between minor elevations of creatine kinase‐MB level and mortality in patients with acute coronary syndromes without ST‐segment elevation. PURSUIT Steering Committee. Platelet Glycoprotein IIb/IIIa in Unstable Angina: Receptor Suppression Using Integrilin Therapy. JAMA. 2000;283: 347–353. [DOI] [PubMed] [Google Scholar]
- 5. Roe MT, Peterson ED, Li Y, et al. Relationship between risk stratification by cardiac troponin level and adherence to guidelines for non‐ST‐segment elevation acute coronary syndromes. Arch Intern Med. 2005;165:1870–1876. [DOI] [PubMed] [Google Scholar]
- 6. Peterson ED, Roe MT, Rumsfeld JS, et al. A call to ACTION (acute coronary treatment and intervention outcomes network): a national effort to promote timely clinical feedback and support continuous quality improvement for acute myocardial infarction. Circ Cardiovasc Qual Outcomes. 2009;2: 491–499. [DOI] [PubMed] [Google Scholar]
- 7. Chin CT, Chen AY, Wang TY, et al. Risk adjustment for in‐hospital mortality of contemporary patients with acute myocardial infarction: the ACTION Registry–GWTG acute myocardial infarction mortality model and risk score. Am Heart J. 2011; 161:113–122.e2. [DOI] [PubMed] [Google Scholar]
- 8. DeLong ER, DeLong DM, Clarke‐Pearson DL. Comparing the areas under two or more correlated receiver operating characteristic curves: a nonparametric approach. Biometrics. 1988;44:837–845. [PubMed] [Google Scholar]
- 9. Bassand JP, Hamm CW, Ardissino D, et al. Guidelines for the diagnosis and treatment of non‐ST‐segment elevation acute coronary syndromes. Eur Heart J. 2007;28:1598–1660. [DOI] [PubMed] [Google Scholar]
- 10. Anderson JL, Adams CD, Antman EM, et al. ACC/AHA 2007 guidelines for the management of patients with unstable angina/non ST‐elevation myocardial infarction: a report of the American College of Cardiology/American Heart Association Task Force on Practice Guidelines (Writing Committee to Revise the 2002 Guidelines for the Management of Patients With Unstable Angina/Non ST‐Elevation Myocardial Infarction): developed in collaboration with the American College of Emergency Physicians, the Society for Cardiovascular Angiography and Interventions, and the Society of Thoracic Surgeons: endorsed by the American Association of Cardiovascular and Pulmonary Rehabilitation and the Society for Academic Emergency Medicine. Circulation. 2007;116:e148–e304. [DOI] [PubMed] [Google Scholar]
- 11. Eggers KM, Lagerqvist B, Venge P, et al. Prognostic value of biomarkers during and after non‐ST‐segment elevation acute coronary syndrome. J Am Coll Cardiol. 2009;54:357–364. [DOI] [PubMed] [Google Scholar]