

Abstract
Background:
Chronic kidney disease (CKD) is associated with high cardiovascular morbidity and mortality, which is not fully explained by traditional risk factors; hence, the interest in nontraditional risk factors such as inflammation and insulin resistance (IR). Though IR is shown in nondiabetic CKD, its association with vascular disease and inflammation in this population is unknown, and is what this study aims to investigate.
Hypothesis:
IR and inflammation are related to vascular disease in nondiabetic predialysis CKD patients.
Methods:
We studied carotid‐artery intima‐media thickness (IMT) and endothelial function (brachial artery flow mediated dilation [FMD]) in 35 nondiabetic predialysis patients with stage 3–5 CKD and 35 age‐ and gender‐matched controls. Insulin resistance was measured using the homeostasis model assessment for insulin resistance score (HOMA‐IR), inflammation by high‐sensitivity CRP (hsCRP), and their relationship with FMD and IMT.
Results:
Patients with CKD showed reduced FMD (3.34 ± 2.14% vs 5.27 ± 1.78%, P<0.001) and increased IMT (0.78 ± 0.22 mm vs 0.64 ± 0.16 mm, P = 0.003) compared with controls. The CKD patients had a higher HOMA‐IR (2.20 ± 1.08 vs 1.13 ± 0.64, P<0.001) and hsCRP (3.25 ± 5.47 mg/L vs 1.10 ± 1.85 mg/L [median ± interquartile range], P = 0.02). In the study population, HOMA‐IR was directly related to hsCRP. After adjusting for traditional risk factors, high HOMA‐IR and hsCRP were significantly related to decreased FMD (adjusted β = − 0.44, 95% confidence interval [CI]: − 1.55 to − 0.08, P = 0.003 and adjusted β = − 0.51, 95% CI: − 0.51 to − 0.15, P = 0.001) and increased IMT (adjusted β = 0.62, 95% CI: 0.54–1.90, P = 0.001 and adjusted β = 0.43, 95% CI: 0.08–0.57, P = 0.011), respectively.
Conclusions:
Subjects with systemic inflammation were more insulin‐resistant, and in nondiabetic predialysis CKD, IR and systemic inflammation were independently associated with endothelial dysfunction and atherosclerosis. © 2011 Wiley Periodicals, Inc.
Dr. Debasish Banerjee and Dr. Alejandro Recio‐Mayoral are joint first authors. This study has been supported by grants awarded by the Spanish Society of Cardiology to Dr. A. Recio‐Mayoral and by the St. George's Charitable Foundation to Dr. D. Banerjee. The authors have no other funding, financial relationships, or conflicts of interest to disclose.
Introduction
Chronic kidney disease (CKD) is an important public‐health problem with high prevalence, increasing incidence, and very high morbidity and mortality.1 The mortality with predialysis CKD, which is predominantly cardiovascular (CV), is up to 5.4× higher compared with general population with estimated glomerular filtration rate (eGFR) within the normal range.2
Traditional risk factors such as hyperlipidemia and hypertension fail to fully explain this increased risk. Cholesterol‐lowering in patients on dialysis has been unsuccessful in reducing morbidity and mortality in randomized controlled trials.3, 4 Likewise, observation studies in hemodialysis patients indicate poor survival with tighter blood pressure (BP) control.5, 6, 7 These findings have prompted investigations into nontraditional risk factors as a predictor of CV disease in patients with CKD, such as systemic inflammation and insulin resistance (IR).8, 9, 10
Insulin resistance, described as a subnormal glucose response to a given dose of endogenous or exogenous insulin, has been shown in early nondiabetic CKD.8 The predisposing factors responsible for IR in the absence of diabetes mellitus (DM) or obesity in CKD are unknown, but are probably related to factors that contribute to vascular disease, such as inflammation and oxidative stress. Abnormal vascular function and its relationship with inflammation and IR have been demonstrated in patients with CKD.11 However, the relationship of IR with vascular function and inflammation in predialysis, nondiabetic CKD is not known.
This study investigated the association between IR and systemic inflammation with surrogate CV disease markers such as flow‐mediated dilation (FMD) for endothelial function and carotid‐artery intima‐media thickness (IMT), a marker of coronary atherosclerosis, in normoglycemic predialysis CKD patients.
Methods
Study Population
Data were collected on 35 adult nondiabetic CKD patients aged 20–75 years, and 35 age‐ and gender‐matched controls. All patients were recruited from general nephrology clinics at St. George's and Kingston hospitals, National Health Service Trust. We excluded patients with infection, active inflammation, autoimmune disease, malignancy, heart failure, atrial fibrillation, and acute coronary syndrome within 3 months prior to the study. Age‐ and gender‐matched controls were presumed healthy, nondiabetic staff from St. George's University. Antihypertensive, antiplatelet, and statin therapy was continued in patients on the study. Diabetes mellitus and impaired fasting glycemia were defined by the World Health Organization criteria. Thus, patients with high fasting plasma glucose (>6 mmol/L) and patients on oral antidiabetics or insulin therapy were excluded from the study. The eGFR was calculated using the abbreviated Modification of Diet in Renal Disease formula.12 Comorbidity was assessed using a standard questionnaire. Standardized anthropometric data such as height and weight (in street clothes) were recorded by a single investigator. Blood pressure was recorded in sitting position and averaged over 2 readings within 5 mm Hg systolic. The study was approved by Wandsworth research ethics committee, and all participants gave full informed written consent.
Blood Sampling and Assays
Fasting serum glucose concentration was measured by glucose oxidase method on the ADVIA 1200 Chemistry System (Siemens Healthcare Diagnostics, Deerfield, IL). Fasting serum insulin was measured using the ADVIA Centaur 2‐site sandwich immunoassay (Siemens Healthcare Diagnostics). The total coefficients of variation (%) for this assay at 3 concentrations of insulin, measured in duplicates, are 7.5, 6.5, and 6.3, and the analytical range for this assay is 0.5–300 mU/L. Serum high‐sensitivity C‐reactive protein (hsCRP) was measured using Immulite 2500 High Sensitivity CRP chemiluminescent immunometric assay (Siemens Healthcare Diagnostics). Other measurements were obtained through routine laboratory methods.
Insulin‐Resistance Assessment
Insulin resistance was assessed by the homeostasis model assessment for insulin resistance (HOMA‐IR), described by Matthews et al, using the following formula:13
 |
Endothelial Function Assessment by Brachial‐Artery Flow‐Mediated Dilation
Noninvasive assessment of endothelial function was performed by measuring endothelium nitric oxide (NO)‐ induced dilation of the brachial artery in response to forearm ischemia.14 Subjects were investigated in the vascular laboratory suite between 7 am and 11 am under standardized conditions, by a single investigator. The analysis was performed after an overnight fast for 12 hours, and patients were asked to withhold their medications until after the study. The brachial artery was scanned using an HDI 3000 ultrasound system (ATL/Philips Medical Systems, Bothell, WA) with a 5–12‐MHz linear transducer, 2–10 cm from the elbow. The ultrasound system was connected to a personal computer equipped with a frame grabber and vessel image analysis software, providing real‐time data acquisition. A baseline image of the brachial artery was obtained for 2 minutes, following which a forearm tourniquet was inflated to 300 mm Hg for 4.5 minutes to induce distal‐forearm ischemia. Brachial‐artery diameter following reactive hyperemia was recorded for 5 minutes after tourniquet release. Flow‐mediated dilation, defined as a percentage increase in brachial‐artery diameter after tourniquet release, was automatically calculated by the vessel image analysis software. Sublingual glyceryl trinitrate (300 μg) was administered at the same sitting and brachial‐artery diameter was recorded for an additional 5 minutes to determine endothelium‐independent vasodilation. All measurements were performed by a technician blinded to patient identity and study group. The overall mean (SD) intraoperator variability of this technique within our department is 0.9 (0.48)%.15
Common Carotid Intima‐Media Thickness Assessment
Common carotid‐artery imaging was performed by a single investigator in the vascular laboratory suite under standardized conditions with the ATL HDI 3000 ultrasound system, using a 5–12‐MHz linear transducer. Far‐wall measurements of common carotid‐artery IMT were performed, using B‐mode, over the distal 2‐cm segment of the common carotid, defined by the carotid flow divider, on both sides. All ultrasonic examinations were stored on a super VHS video system for offline processing. Video images were captured in end diastole triggered by electrocardiographic recording. Video images were digitized and transferred for further analysis to a personal computer. Images were analyzed by a technician blinded to patient identity and study group. Mean common carotid IMT was measured by using a semiautomated computer analysis system that detects the lumen/intima borderline and the media/adventitia borderline using a grey value algorithm. Differences between these 2 borderlines were measured along a line orthogonal to the arterial wall. Single IMT values were obtained from pixel‐to‐pixel measurements on neighboring lines, perpendicular to the vertical line, then averaged and expressed as the mean IMT for that segment. The mean IMT was computed as the average IMT on both sides. The mean (SD) intraoperator variability of this technique within our department is 0.047 (0.028) mm.16
Statistical Analysis
Results are represented as percentages for categorical data and analyzed by χ 2 test or Fisher exact test as appropriate. Continuous normally distributed variables are expressed as mean ± 1 SD and compared with the Student 2‐tailed unpaired t test. Continuous non–normally distributed data are expressed as median and interquartile range (IQR) and analyzed by the Mann‐Whitney U test. Bivariate correlations between study variables were calculated by Pearson or Spearman rank correlation coefficients. Multivariate linear regression was performed to identify independent determinants of FMD and IMT. A P value of <0.05 (2‐sided) was considered significant for statistical testing. Data analysis was performed using SPSS software, version 17.0 (SPSS Inc., Chicago, IL).
Results
Characteristics of the Study Cohort
Characteristics of the study population are described in Table 1. Patients were predominantly white Caucasians (80%). Patients and controls were age‐ and sex‐matched. The mean eGFR in predialysis patients compared with controls was 34 ± 15 mL/minute/1.73m2 vs 87 ± 26 mL/minute/1.73m2. The systolic BP was similar between the 2 groups; 58% of the patients were on an angiotensin‐converting enzyme inhibitor (ACEI) or angiotensin II receptor blocker (ARB) and 37% were on statins. Total cholesterol, low‐density lipoprotein cholesterol (LDL‐C), and high‐density lipoprotein cholesterol (HDL‐C) were higher in controls than in CKD patients. There was no difference in serum triglyceride concentration between the 2 groups. Patients had a significantly higher hsCRP and HOMA‐IR. The body mass index (BMI) in patients was comparable with controls. Endothelium‐dependent FMD was lower and IMT was higher in CKD patients.
Table 1.
Characteristics of the Study Population
| Patients (n = 35) | Controls (n = 35) | P Value | |
|---|---|---|---|
| Age (y) | 56 ± 12 | 55 ± 10 | 0.82 |
| Gender (male, %) | 60 | 51 | 0.47 |
| Active smokers (%) | 6 | 9 | 0.64 |
| BMI (kg/m2) | 26 ± 4 | 25 ± 5 | 0.86 |
| eGFR (mL/min/1.73m2) | 34 ± 16 | 87 ± 26 | <0.001a |
| Systolic BP (mm Hg) | 136 ± 16 | 132 ± 17 | 0.33 |
| Diastolic BP (mm Hg) | 82 ± 11 | 78 ± 7 | 0.03a |
| Fasting glucose (mmol/L) | 4.97 ± 0.69 | 5.10 ± 0.45 | 0.37 |
| Fasting insulin (mU/L) | 10.23 ± 5.02 | 4.98 ± 2.73 | <0.001b |
| HOMA‐IR | 2.20 ± 1.08 | 1.13 ± 0.64 | <0.001b |
| Total cholesterol (mmol/L) | 4.47 ± 1.22 | 5.86 ± 0.96 | <0.001b |
| LDL cholesterol (mmol/L) | 2.81 ± 1.01 | 3.76 ± 0.69 | <0.001b |
| HDL cholesterol (mmol/L) | 1.22 ± 0.40 | 1.51 ± 0.49 | 0.013a |
| Triglycerides (mmol/L) | 1.46 ± 1.17 | 1.27 ± 1 | 0.37 |
| Use of ACEI or ARB (%) | 58 | 14 | <0.001b |
| Use of statin (%) | 37 | 9 | 0.001b |
| hsCRP (mg/L) (median ± IQR) | 3.25 ± 5.47 | 1.10 ± 1.85 | 0.026a |
| Endothelium‐dependent FMD (%) | 3.34 ± 2.14 | 5.27 ± 1.78 | <0.001b |
| Endothelium‐independent FMD (%) | 12.63 ± 4.81 | 13.55 ± 6.03 | 0.50 |
| Carotid IMT (mm) | 0.78 ± 0.22 | 0.64 ± 0.16 | 0.003b |
Abbreviations: ACEI, angiotensin‐converting enzyme inhibitor; ARB, angiotensin II receptor blocker; BMI, body mass index; BP, blood pressure; eGFR, estimated glomerular filtration rate (using abbreviated Modification of Diet in Renal Disease formula); FMD, flow‐mediated dilation; HOMA‐IR, homeostasis model assessment for insulin resistance; hsCRP, high‐sensitivity C‐reactive protein; IMT, common carotid intima‐media thickness; IQR, interquartile range.
Normally distributed continuous variables are expressed as mean ± SD and median ± IQR in case of nonparametric variables. Categorical variables are expressed as percentages. Definition of endothelium‐dependent and ‐independent FMD and IMT are described in Methods. Insulin resistance is assessed by the HOMA‐IR index.
P value <0.05.
P value <0.05.
Bivariate Correlations
Relationship of Endothelial Function and Atherosclerosis With Insulin Resistance and Inflammation:
HOMA‐IR showed a negative correlation with endothelium‐dependent FMD (r = − 0.45, P = 0.02) and a positive correlation with carotid IMT (r = 0.62, P = 0.001). High‐sensitivity CRP showed an inverse relationship with FMD (rho = − 0.63, P<0.001) and IMT (rho = 0.44, P = 0.01) (Figure 1). The HOMA‐IR was not related to BMI in CKD patients, but positively correlated with BMI in controls (r = 0.45, P = 0.01).
Figure 1.
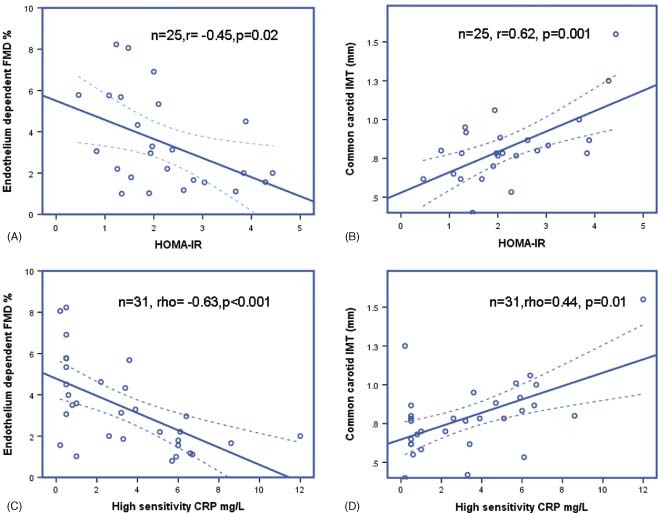
Relationship between inflammation, insulin resistance, endothelial function and atherosclerosis. Abbreviations: CRP, C‐reactive protein; FMD, flow‐mediated dilation; HOMA‐IR, homeostasis model assessment for insulin resistance score; IMT, intima‐media thickness.
Relationship Between HOMA‐IR and High‐Sensitivity C‐Reactive Protein:
In the study population, HOMA‐IR showed a direct correlation with hsCRP (Figure 2). This relationship was true both for patients and controls.
Figure 2.

Relationship between inflammation and insulin resistance. Abbreviations: CRP, C‐reactive protein; HOMA‐IR, homeostasis model assessment for insulin resistance score.
Relationship of Endothelial Function and Atherosclerosis:
Endothelium‐dependent FMD inversely correlated with carotid IMT in CKD patients (r = − 0.40, P = 0.021).
Multivariate Regression Analysis
We performed multivariate linear regression analysis to determine the independent predictors of endothelium‐dependent FMD and IMT adjusted for traditional risk factors such as age, BMI, gender, smoking status, and hypertension (>130/80 mm Hg or on antihypertensives) in all patients. HOMA‐IR was independently related to FMD (adjusted β = − 0.44, 95% CI: − 1.55 to − 0.08, P = 0.003), adjusted for traditional risk factors. Also, hsCRP showed an independent relationship with FMD (adjusted β = − 0.51, 95% CI: − 0.51 to − 0.15, P = 0.001) adjusted for same CV risk factors. Similarly, HOMA‐IR and hsCRP showed independent relationship with IMT adjusted for the same CV risk factors (Tables 2 and 3). High‐sensitivity C‐reactive protein also showed a strong independent positive relationship with HOMA‐IR (β = 0.58, 95% CI: 0.18–0.52, P<0.001) adjusted for age, gender, and BMI.
Table 2.
Multivariate Linear Regression Analysis With IMT (mm) as Dependent Variable and HOMA‐IR Along With Other CV Risk Factors as Independent Variables
| Parameter | Adjusted β Coefficient (95% CI) | P Value |
|---|---|---|
| Age (y) | 0.01 (−0.07 to 0.08) | 0.96 |
| Gender | 0.21 (−0.59 to 2.52) | 0.21 |
| BMI (kg/m2) | 0.05 (−0.18 to 0.24) | 0.77 |
| Hypertensiona | −0.22 (−3.21 to 0.88) | 0.25 |
| Smoking | 0.08 (−3.14 to 4.88) | 0.65 |
| HOMA‐IR | 0.62 (0.54 to 1.90) | 0.001 |
Abbreviations: BMI, body mass index; BP, blood pressure; CI, confidence interval; HOMA‐IR, homeostasis model assessment for insulin resistance.
Hypertension defined as BP >130/80 mm Hg and/or on antihypertensives. Adjusted R 2 = 0.359.
Table 3.
Multivariate Linear Regression Analysis With IMT (mm) as Dependent Variable and hsCRP Along With Other CV Risk Factors as Independent Variables
| Parameter | Adjusted β Coefficient (95% CI) | |
|---|---|---|
| Age (y) | 0.30 (−0.00 to 0.12) | 0.06 |
| Gender | 0.13 (−0.91 to 2.16) | 0.41 |
| BMI (kg/m2) | 0.00 (−0.18 to 0.18) | 0.98 |
| Hypertensiona | −0.14 (−3.06 to 1.30) | 0.41 |
| Smoking | −0.09 (−4.10 to 2.46) | 0.61 |
| hsCRP | 0.43 (0.08 to 0.57) | 0.011 |
Abbreviations: BMI, body mass index; CI, confidence interval; hsCRP, high‐sensitivity C‐reactive protein.
Hypertension defined as BP >130/80 mm Hg and/or on antihypertensives. Adjusted R 2 = 0.321.
Discussion
This study demonstrates for the first time a relationship between IR, systemic inflammation, and vascular disease in nondiabetic, predialysis CKD patients. This relationship is independent of conventional CV risk factors. Insulin resistance as measured by HOMA‐IR and systemic inflammation measured by hsCRP were independent predictors of both endothelial function (FMD) and atherosclerotic disease (IMT) in the multivariate regression analysis after adjusting for the traditional risk factors. We have previously shown a similar relationship between IR and inflammation with vascular function in a cohort of patients that included patients on maintenance hemodialysis.17
Investigations in traditional CV risk‐factor interventions in CKD have been disappointing. Hence, over the last decade nontraditional risk factors, including IR and inflammation, and their relationship with CV disease and mortality have been investigated.8, 9, 10, 18, 19 Insulin resistance can occur early in CKD20; however, presence of IR may not be apparent in patients with CKD, as it can also occur in the absence of DM and obesity. We have specifically investigated nondiabetic patients to study the relationship of IR with inflammation as a potential mediator of CV disease in this group of patients.
Enhanced systemic inflammation is a common phenomenon in patients with kidney failure. Observational studies have amply demonstrated a linear relationship between markers of systemic inflammation and CV mortality in patients with CKD.10, 18, 19 Although the causes of inflammation are well‐described in CKD, the downstream effects of inflammation on vascular function are not well‐elucidated. Our study shows a direct correlation between systemic inflammation and IR in normoglycemic CKD patients, resulting in impaired vascular function and atherosclerosis. Molecular pathways responsible for stimulation of NO release by insulin in vascular endothelial cells have been illustrated in the literature.21 The effect of IR on endothelial dysfunction has been well‐established in obese individuals and in patients with DM.22, 23, 24, 25, 26 Recent experiments conducted by Shaul and colleagues also point to a direct inhibitory effect of CRP on insulin‐mediated NO release via the phosphatidylinositol 3‐kinase (PI3K) pathway, by inhibiting phosphorylation of Akt kinase at Ser 1179.27 It is thus conceivable that IR may be one of the mechanisms through which systemic inflammation may exert its deleterious effect on the cardiovasculature. The observation that IR in CKD is independent of obesity (BMI) and glucose intolerance in CKD implies that greater surveillance is warranted, as IR is a modifiable risk factor. Lifestyle interventions such as diet and exercise improve insulin sensitivity and endothelial function.28 Pharmacological agents such as ACEIs and ARBs,29, 30 statins,31 metformin,32 PPARγ agonists,33 and, more recently, acetyl‐L‐carnitine have also been shown to be beneficial.34 However, their effect on improving tissue responsiveness to insulin in CKD has yet to be proven. Nevertheless, IR is an independent risk factor for CV mortality in nondiabetic patients on dialysis as shown by Shinohara and colleagues,35 and therefore identification of patients with IR may help stratify patients at increased CV risk.
There are certain limitations to our study. Firstly, a significant proportion of CKD patients were on antihypertensives and statins; the potential impact of hypertension, hypercholesterolemia, and their treatment on FMD and IMT may have therefore confounded our results. Secondly, the study is on a small, selective cohort of nondiabetic predialysis CKD patients, and it thus needs to be repeated in a larger population. Third, our study is based on associations with surrogate endpoints; the generated hypothesis thus needs further prospective follow‐up studies with hard endpoints to demonstrate causality.
Conclusion
The present study in predialysis CKD shows that IR is related to endothelial dysfunction and atherosclerosis, even in the absence of overt DM. The study also shows that low‐grade systemic inflammation is related to IR. Hence, it is possible that the detrimental effect of inflammation on vascular disease in CKD may be mediated by vascular unresponsiveness to the action of insulin. Further prospective randomized controlled trials are needed to assess the effectiveness of therapeutic interventions aimed at improving IR and their effect on vascular function in patients with kidney disease.
References
- 1. Sarnak MJ, Levey AS, Schoolwerth AC, et al. Kidney disease as a risk factor for development of cardiovascular disease: a statement from the American Heart Association Councils on Kidney in Cardiovascular Disease, High Blood Pressure Research, Clinical Cardiology, and Epidemiology and Prevention. Hypertension. 2003;42:1050–1065. [DOI] [PubMed] [Google Scholar]
- 2. Go AS, Chertow GM, Fan D, et al. Chronic kidney disease and the risks of death, cardiovascular events, and hospitalization. N Engl J Med. 2004;351:1296–1305. [DOI] [PubMed] [Google Scholar]
- 3. Fellström BC, Jardine AG, Schmieder RE, et al; for AURORA Study Group . Rosuvastatin and cardiovascular events in patients undergoing hemodialysis [published correction appears in N Engl J Med. 2010;362:1450]. N Engl J Med. 2009;360: 1395–1407. [DOI] [PubMed] [Google Scholar]
- 4. Wanner C, Krane V, März W, et al. Atorvastatin in patients with type 2 diabetes mellitus undergoing hemodialysis [published correction appears in N Engl J Med. 2005;353:1640]. N Engl J Med. 2005;353:238–248. [DOI] [PubMed] [Google Scholar]
- 5. Duranti E, Imperiali P, Sasdelli M. Is hypertension a mortality risk factor in dialysis? Kidney Int Suppl. 1996;55:S173–S174. [PubMed] [Google Scholar]
- 6. Port FK, Hulbert‐Shearon TE, Wolfe RA, et al. Predialysis blood pressure and mortality risk in a national sample of maintenance hemodialysis patients. Am J Kidney Dis. 1999;33:507–517. [DOI] [PubMed] [Google Scholar]
- 7. Zager PG, Nikolic J, Brown RH, et al; Medical Directors of Dialysis Clinic, Inc. “U” curve association of blood pressure and mortality in hemodialysis patients [published correction appears in Kidney Int. 1998;54:1417]. Kidney Int. 1998;54:561–569. [DOI] [PubMed] [Google Scholar]
- 8. Becker B, Kronenberg F, Kielstein JT, et al. Renal insulin resistance syndrome, adiponectin and cardiovascular events in patients with kidney disease: the mild and moderate kidney disease study. J Am Soc Nephrol. 2005;16:1091–1098. [DOI] [PubMed] [Google Scholar]
- 9. Beddhu S, Nigwekar SU, Ma X, et al. Associations of resting heart rate with insulin resistance, cardiovascular events and mortality in chronic kidney disease. Nephrol Dial Transplant. 2009;24:2482–2488. [DOI] [PMC free article] [PubMed] [Google Scholar]
- 10. Menon V, Greene T, Wang X, et al. C‐reactive protein and albumin as predictors of all‐cause and cardiovascular mortality in chronic kidney disease. Kidney Int. 2005;68:766–772. [DOI] [PubMed] [Google Scholar]
- 11. Dogra G, Irish A, Chan D, et al. Insulin resistance, inflammation, and blood pressure determine vascular dysfunction in CKD. Am J Kidney Dis. 2006;48:926–934. [DOI] [PubMed] [Google Scholar]
- 12. Levey AS, Bosch JP, Lewis JB, et al; Modification of Diet in Renal Disease Study Group . A more accurate method to estimate glomerular filtration rate from serum creatinine: a new prediction equation. Ann Intern Med. 1999;130:461–470. [DOI] [PubMed] [Google Scholar]
- 13. Matthews DR, Hosker JP, Rudenski AS, et al. Homeostasis model assessment: insulin resistance and beta‐cell function from fasting plasma glucose and insulin concentrations in man. Diabetologia. 1985;28:412–419. [DOI] [PubMed] [Google Scholar]
- 14. Deanfield J, Donald A, Ferri C, et al. Endothelial function and dysfunction. Part I: Methodological issues for assessment in the different vascular beds: a statement by the Working Group on Endothelin and Endothelial Factors of the European Society of Hypertension. J Hypertens. 2005;23:7–17. [DOI] [PubMed] [Google Scholar]
- 15. Sidhu JS, Newey VR, Nassiri DK, et al. A rapid and reproducible on line automated technique to determine endothelial function. Heart. 2002;88:289–292. [DOI] [PMC free article] [PubMed] [Google Scholar]
- 16. Sidhu JS, Kaposzta Z, Markus HS, et al. Effect of rosiglitazone on common carotid intima‐media thickness progression in coronary artery disease patients without diabetes mellitus. Arterioscler Thromb Vasc Biol. 2004;24:930–934. [DOI] [PubMed] [Google Scholar]
- 17. Banerjee D, Recio‐Mayoral A, Chitalia N, et al. Inflammation, insulin resistance and vascular disease in non‐diabetic chronic kidney disease population. NDT Plus. 2010;(suppl 3): iii185. [Google Scholar]
- 18. Yeun JY, Levine RA, Mantadilok V, et al. C‐reactive protein predicts all‐cause and cardiovascular mortality in hemodialysis patients. Am J Kidney Dis. 2000;35:469–476. [DOI] [PubMed] [Google Scholar]
- 19. Zimmermann J, Herrlinger S, Pruy A, et al. Inflammation enhances cardiovascular risk and mortality in hemodialysis patients. Kidney Int. 1999;55:648–658. [DOI] [PubMed] [Google Scholar]
- 20. Dzurik R, Spustova V, Janekova K. The prevalence of insulin resistance in kidney disease patients before the development of renal failure. Nephron. 1995;69:281–285. [DOI] [PubMed] [Google Scholar]
- 21. Muniyappa R, Montagnani M, Koh KK, et al. Cardiovascular actions of insulin. Endocr Rev. 2007;28:463–491. [DOI] [PubMed] [Google Scholar]
- 22. Mahmud FH, Hill DJ, Cuerden MS, et al. Impaired vascular function in obese adolescents with insulin resistance. J Pediatr. 2009;155:678–682. [DOI] [PubMed] [Google Scholar]
- 23. McVeigh GE, Brennan GM, Johnston GD, et al. Impaired endothelium‐dependent and independent vasodilation in patients with type 2 (non‐insulin‐dependent) diabetes mellitus. Diabetologia. 1992;35:771–776. [DOI] [PubMed] [Google Scholar]
- 24. Steinberg HO, Chaker H, Leaming R, et al. Obesity/insulin resistance is associated with endothelial dysfunction: implications for the syndrome of insulin resistance. J Clin Invest. 1996;97:2601–2610. [DOI] [PMC free article] [PubMed] [Google Scholar]
- 25. Tack CJ, Ong MK, Lutterman JA, et al. Insulin‐induced vasodilatation and endothelial function in obesity/insulin resistance: effects of troglitazone. Diabetologia. 1998;41:569–576. [DOI] [PubMed] [Google Scholar]
- 26. Valle JM, Estepa RM, Camacho RM, et al. Endothelial dysfunction is related to insulin resistance and inflammatory biomarker levels in obese prepubertal children. Eur J Endocrinol. 2007;156: 497–502. [DOI] [PubMed] [Google Scholar]
- 27. Tanigaki K, Mineo C, Yuhanna IS, et al. C‐reactive protein inhibits insulin activation of endothelial nitric oxide synthase via the immunoreceptor tyrosine‐based inhibition motif of FcgammaRIIB and SHIP‐1. Circ Res. 2009;104:1275–1282. [DOI] [PMC free article] [PubMed] [Google Scholar]
- 28. Hamdy O, Ledbury S, Mullooly C, et al. Lifestyle modification improves endothelial function in obese subjects with the insulin resistance syndrome. Diabetes Care. 2003;26:2119–2125. [DOI] [PubMed] [Google Scholar]
- 29. Sanchez RA, Masnatta LD, Pesiney C, et al. Telmisartan improves insulin resistance in high renin nonmodulating salt‐sensitive hypertensives. J Hypertens. 2008;26:2393–2398. [DOI] [PubMed] [Google Scholar]
- 30. Tezcan H, Yavuz D, Toprak A, et al. Effect of angiotensin‐converting enzyme inhibition on endothelial function and insulin sensitivity in hypertensive patients. J Renin Angiotensin Aldosterone Syst. 2003;4:119–123. [DOI] [PubMed] [Google Scholar]
- 31. Koh KK, Quon MJ, Han SH, et al. Differential metabolic effects of pravastatin and simvastatin in hypercholesterolemic patients. Atherosclerosis. 2009;204:483–490. [DOI] [PMC free article] [PubMed] [Google Scholar]
- 32. Bulcão C, Ribeiro‐Filho FF, Sañudo A, et al. Effects of simvastatin and metformin on inflammation and insulin resistance in individuals with mild metabolic syndrome. Am J Cardiovasc Drugs. 2007;7:219–224. [DOI] [PubMed] [Google Scholar]
- 33. Raji A, Seely EW, Bekins SA, et al. Rosiglitazone improves insulin sensitivity and lowers blood pressure in hypertensive patients. Diabetes Care. 2003;26:172–178. [DOI] [PubMed] [Google Scholar]
- 34. Ruggenenti P, Cattaneo D, Loriga G, et al. Ameliorating hypertension and insulin resistance in subjects at increased cardiovascular risk: effects of acetyl‐L‐carnitine therapy. Hypertension. 2009;54:567–574. [DOI] [PubMed] [Google Scholar]
- 35. Shinohara K, Shoji T, Emoto M, et al. Insulin resistance as an independent predictor of cardiovascular mortality in patients with end‐stage renal disease. J Am Soc Nephrol. 2002;13: 1894–1900. [DOI] [PubMed] [Google Scholar]