

Abstract
Background:
Serum total bilirubin has been suggested to have potential anti‐inflammatory and antioxidant effects on the vasculature, acting against plaque formation and subsequent atherosclerosis. This study was designed to assess the association of serum total bilirubin with coronary artery calcification (CAC).
Hypothesis:
Individuals with higher bilirubin level would be less likely to develop CAC.
Methods:
Male subjects (N = 3408) underwent evaluation of CAC by cardiac computed tomography. Correlation and logistic regression analysis were performed to assess the relationships between CAC score and other variables.
Results:
Subjects with a higher CAC score had significantly lower total bilirubin level (P = 0.001). Total bilirubin level was negatively correlated with CAC score (r = −0.052, P = 0.002). A 0.1‐mg/dL increase in bilirubin was associated with a reduced odds ratio (OR) of the risk by 29.2% for a CAC score above 100 (OR: 0.708, 95% confidence interval: 0.542‐0.927, P = 0.012) after adjustment for several variables. Bilirubin was inversely correlated with high‐sensitivity C‐reactive protein (hsCRP) (r = −0.117, P < 0.001).
Conclusions:
This study demonstrated an independent inverse association between serum total bilirubin and CAC score in males. Low serum bilirubin concentration would be useful as a potential risk factor for CAC in males. Additionally, reduced hsCRP may be 1 of the mechanisms for how bilirubin reduces CAC. © 2012 Wiley Periodicals, Inc.
Additional Supporting Information may be found in the online version of this article.
Zheng‐Yun Zhang, MD, and Lu‐Qin Bian, MD, contributed equally to this work.
The authors have no funding, financial relationships, or conflicts of interest to disclose.
Introduction
Bilirubin has proven to be a potent antioxidant under physiological conditions1 by inhibiting both lipid and protein oxidation.2 As little as 10 nM of bilirubin is enough to protect cells against a 10000‐fold higher concentration of oxidants through rapid regeneration of bilirubin by biliverdin reductase.3 Additionally, bilirubin exerts anti‐inflammatory effects on vasculature.4, 5 Oxidative stress and inflammation are fundamental to the arteriopathy.6, 7, 8 Bilirubin was proven to act against plaque formation and subsequent atherosclerosis,1 which was further confirmed by the studies revealing the relationships between bilirubin and peripheral artery disease (PAD) and carotid intima‐media thickness (IMT).9, 10, 11
The coronary artery calcification (CAC) score, a recently established marker of coronary atherosclerosis, is a quantitative objective measure of coronary artery atherosclerosis, which can be assessed noninvasively using multidetector computed tomography (MDCT). Moreover, CAC scores have been shown to be related to risk factors for coronary artery disease (CAD) and cardiovascular events.12, 13 Although the association of total serum bilirubin with CAD has been discovered in both retrospective and prospective studies, little information is available on the role of bilirubin in CAC. Given the remarkable antioxidant and anti‐inflammatory properties of bilirubin and the roles of inflammation, oxidative stress, and cellular injuries in atherosclerosis, we hypothesized that individuals with higher bilirubin level would be less likely to develop CAC. We therefore examined the association of bilirubin level with CAC score among the male civilian population in South Korea.
Methods
Subjects
Male subjects from a multidisciplinary health promotion center, Samsung Medical Center (Seoul, South Korea), who visited the center for a medical checkup, including a routine cardiac risk assessment supported by health insurance, from January 2008 to December 2010, were eligible for this analysis. Participants with known hemodynamic instability, autoimmune disease, neoplastic disease, impaired renal function (serum creatinine >2 mg/dL), chronic kidney disease (evaluated using the Guidelines for Chronic Kidney Disease14), chronic obstructive pulmonary disease, previous coronary artery bypass surgery or percutaneous coronary intervention, chronic or current infections, or the use of anti‐inflammatory drugs in the past 30 days were excluded. This study was approved by the medical center's institutional review board and carried out in compliance with the principles specified in the Declaration of Helsinki. Overall, this study included 3408 men with complete medical information.
CAC Score Measurement
An electrocardiograph‐gated 16‐slice MDCT (LightSpeed Ultra16; GE Medical Systems, Milwaukee, WI) with a rotation time of 0.5 seconds and 2.5‐mm reconstruction was used for scanning. The CAC score was determined by the method described previously, in which participants were divided into 5 risk categories depending on CAC score: 0, 0 to <0, 10 to <100, 100 to <400, and ≥400 in regard to 0 calcium score.15
Other Measurements
Body mass index (BMI) was calculated as weight (kg) divided by height squared (m2). Waist circumference (cm) was measured at the narrowest diameter parallel to the floor between the costal margin and the iliac crest. Fasting glucose levels were determined using the glucose oxidase method (Hitachi 747; Hitachi, Ltd., Tokyo, Japan). Resting systolic and diastolic blood pressure were measured in the sitting position with an automatic blood pressure monitor (Dinamap PRO 100; GE Medical Systems). Blood samples were collected in the morning following a 12‐hour overnight fast and analyzed at the hospital laboratory of clinical medicine. Total cholesterol, triglycerides, and high‐density lipoprotein cholesterol (HDL‐C) were analyzed enzymatically using a Hitachi 747 (Hitachi, Ltd.) analyzer. Serum total bilirubin, albumin, aspartate aminotransferase, alanine aminotransferase, alkaline phosphatase, and γ‐glutamyl transpeptidase were determined by automated biochemical profiling (Beckman Synchron LX20; Beckman Coulter, Inc., Indianapolis IN). High‐sensitivity C‐reactive protein (hsCRP) was measured using the CRP II Latax X2 turbidimetric method (Hitachi, Ltd.). Serum uric acid levels were determined with enzymatic colorimetric method by clinical chemistry autoanalyzer (Aeroset; Abbott Laboratory, Abbott Park, IL). Serum creatinine was determined by Jaffe kinetic compensated method and was categorized into 3 grades: <0.7, 0.7 to 1.3, and 1.4 to 2.0 mg/dL.
Definition of Major Risk Factors
Overweight was diagnosed if the subject's BMI was ≥25. Diabetes was defined as a fasting glucose level of ≥126 mg/dL, or self‐reported physician‐diagnosed diabetes. Hypertension was defined as a resting blood pressure of ≥140/90 mm Hg or self‐reported physician‐diagnosed hypertension. Hypercholesterolemia was diagnosed if the subject reported a physician diagnosis of hypercholesterolemia or if the total cholesterol level was ≥240 mg/dL. Hypertriglyceridemia was diagnosed if the subject reported a physician diagnosis of hypertriglyceridemia or if the total triglycerides level was ≥200 mg/dL. Low HDL cholesterolemia was diagnosed if the subject reported a physician diagnosis of low HDL cholesterolemia or if the HDL‐C level was <40 mg/dL. Metabolic syndrome (MetS) was defined by the presence of ≥3 of the following criteria16: (1) waist circumference >02 cm, (2) triglycerides ≥150 mg/dL, (3) HDL‐C <40 mg/dL, (4) fasting glucose level ≥100 mg/dL, and (5) blood pressure ≥130/85 mm Hg or medically treated hypertension. Abnormal liver function was defined as any liver enzyme level or total bilirubin level greater than the upper limit of the reference range or serum albumin <35 mg/L. Elevated uric acid was defined as greater than the upper limit of the reference range. Subjects were characterized as current smokers if, in a questionnaire, the subject answered yes to whether they smoked cigarettes, or as nonsmokers if they denied smoking at least 100 cigarettes.
Statistical Analysis
The sample size of this study was 3408 subjects. Statistical analyses were performed using SPSS 13.0 (SPSS Inc., Chicago, IL). The Kruskal‐Wallis H test was used to compare numerical values among groups. χ 2 analysis was applied to compare groups for categorical variables. Linear regression was used to determine the relation between total bilirubin and CAC score with log transformation after adding 1 due to skewed distribution. Correlation analysis was used to determine the relation between total bilirubin and hsCRP. We considered a CAC score of 100 as a marker of significant disease based on the recent data, which suggested the similarity of the cardiovascular risk when the CAC score was between 1 to 100, and a progressive increase of this risk when the CAC score was >100 after adjusting for traditional cardiovascular risk factors.17 A high CAC score is observed in patients with documented CAD18 and is closely related to age; its prevalence increases dramatically after age 50 years in males.19 Therefore, the age of 50 years was assigned as the cutoff value in this study. The association of total bilirubin with CAC score was represented by ≤100, and >100 was assessed by logistic regression. Odds ratio (OR) and 95% confidence interval (CI) were estimated. A trend analysis was performed as previously described.20 Hypothesis testing was 2‐tailed, and a P value <0.05 was regarded as statistically significant.
Results
Subject Characteristics
Subject characteristics are summarized in Table 1 (N = 3408). CAC score was associated with subjects' age, hsCRP level, smoking status and the prevalence of the following disorders: diabetes mellitus, hypertension, hypercholesterolemia, and MetS.
Table 1.
Subject Characteristics According to Coronary Artery Calcification Score Under or Above 100
| All Subjects N = 3408, no. (%) | Subjects With CAC Score ≤100, n = 2884, no. (%) | Subjects With CAC Score >100, n = 524, no. (%) | P | |
|---|---|---|---|---|
| Age, y | ||||
| >50 | 2003 (58.8) | 1552 (53.8) | 451 (86.1) | |
| ≤50 | 1405 (41.2) | 1332 (46.2) | 73 (13.9) | <0.001 |
| Overweight | 1439 (42.2) | 1200 (41.6) | 239 (45.6) | 0.088 |
| Diabetes mellitus | 397 (11.6) | 286 (9.9) | 111 (21.2) | <0.001 |
| Hypertension | 1269 (37.2) | 970 (33.6) | 299 (57.1) | <0.001 |
| Hypercholesterolemia | 786 (23.1) | 586 (20.3) | 200 (38.2) | <0.001 |
| Hypertriglyceridemia | 514 (15.1) | 434 (15.0) | 80 (15.3) | 0.898 |
| Low HDL cholesterolemia | 239 (7.0) | 197 (6.8) | 42 (8.0) | 0.329 |
| Metabolic syndrome | 455 (13.4) | 350 (12.1) | 105 (20.0) | <0.001 |
| Abnormal liver function | 1024 (30.0) | 857 (29.7) | 167 (31.9) | 0.322 |
| hsCRP (mg/dL) | ||||
| <0.1 | 2370 (69.5) | 2031 (70.4) | 339 (64.7) | |
| 0.1–0.3 | 794 (23.3) | 655 (22.7) | 139 (26.5) | |
| >0.3 | 244 (7.2) | 198 (6.9) | 46 (8.8) | 0.028 |
| Elevated SUA (mg/dL) | 389 (11.4) | 336 (11.7) | 53 (10.1) | 0.309 |
| Serum creatinine (mg/dL) | ||||
| <0.7 | 39 (1.2) | 34 (1.2) | 5 (1.0) | |
| 0.7–1.3 | 3324 (97.5) | 2815 (97.6) | 509 (97.1) | |
| 1.4–2.0 | 45 (1.3) | 35 (1.2) | 10 (1.9) | 0.401 |
| Current smoker | 975 (28.6) | 753 (26.1) | 222 (42.2) | <0.001 |
| Statin treatment | 48 (1.4) | 40 (1.4) | 8 (1.5) | 0.178 |
Abbreviations: CAC, coronary artery calcification; HDL, high‐density lipoprotein; hsCRP, high‐sensitivity C‐reactive protein; SUA, serum uric acid. χ 2 analysis was applied for comparison among groups. P < 0.05 was considered significant.
Relation Between Serum Total Bilirubin and CAC Score
Subjects with a higher total bilirubin level had significantly lower CAC score (r = −0.057, P = 0.001) (Figure 1). Subjects with a CAC score >100 had a significantly lower total bilirubin level than that those with a CAC score <100 (P = 0.001) (Figure 2). The incidence of a CAC score >100 was lower among subjects with higher bilirubin levels (P trend = 0.015) (Figure 3). In an unadjusted linear regression model, negative correlation was found between log (CAC + 1) and serum total bilirubin (r = −0.057, P = 0.001). Adjusting for age, waist, BMI, fasting glucose, systolic blood pressure, diastolic blood pressure, total cholesterol, triglycerides, HDL‐C, MetS, hsCRP, serum uric acid, serum creatinine, aspartate aminotransferase, alanine aminotransferase, alkaline phosphatase, γ‐glutamyltransferase, smoking status, and statin treatment did not change this trend (r = −0.052, P = 0.002). In a logistic regression model, 100 was indicated as the cutoff value for CAC score. In an unadjusted univariate logistic regression model, a 0.1‐mg/dL increase in bilirubin was associated with a reduced odds ratio of the risk by 33.3% for a CAC score above 100 (OR: 0.667, 95% CI: 0.514‐0.864, P = 0.002) (Table 2). In a multivariate model adjusted for age, overweight, diabetes mellitus, hypertension, hypercholesterolemia, hypertriglyceridemia, low HDL cholesterolemia, MetS, hsCRP, elevated serum uric acid, serum creatinine, smoking status, liver function (normal or abnormal), and statin treatment, bilirubin was independently associated with CAC score, and a 0.1‐mg/dL increase in bilirubin was associated with a reduced odds ratio of the risk by 29.2% for CAC score >100 (OR: 0.708, 95% CI: 0.542‐0.927, P = 0.012) (Table 2).
Figure 1.
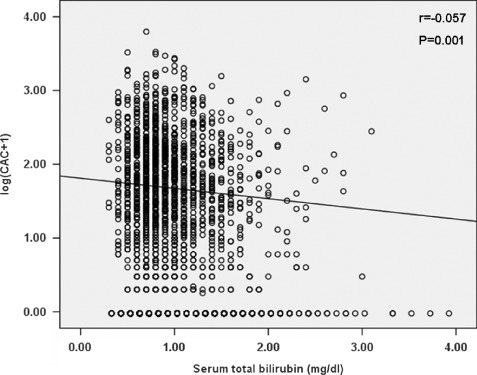
Correlation between coronary artery calcification (CAC) score and serum bilirubin level. CAC scores were log transformed after adding 1. Linear regression was used. P < 0.05 was considered significant.
Figure 2.
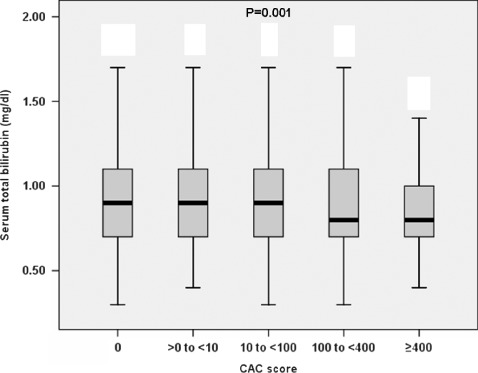
The distribution of serum total bilirubin at each coronary artery calcification (CAC) score category. Subjects with a CAC score >100 had a significantly lower bilirubin level than that of <100 (P = 0.001). Kruskal‐Wallis H test was used to compare the groups for numerical values. P < 0.05 was considered significant.
Figure 3.
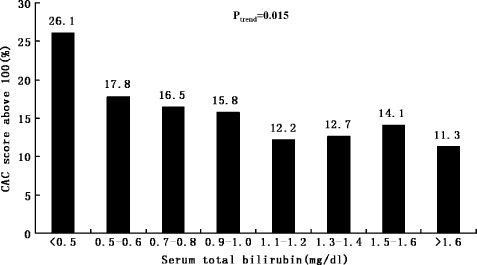
The distribution of incidences of coronary artery calcification (CAC) score >100 at each serum total bilirubin level. The incidence of CAC score >100 was lower among subjects with higher bilirubin levels (P trend = 0.015). A trend analysis test was used to compare within groups. P < 0.05 was considered significant.
Table 2.
Linear and Logistic Regression Considering Coronary Artery Calcification Score as the Dependent Variable
| Linear Regression | Logistic Regression | |||
|---|---|---|---|---|
| r | P | OR (95% CI) | P | |
| Unadjusted | −0.057 | 0.001 | 0.667 (0.514‐0.864) | 0.002 |
| Adjusted | −0.052a | 0.002 | 0.708 (0.542‐0.927)b | 0.012 |
Abbreviations: CI, confidence interval; OR, odds ratio. Stepwise linear and logistic regressions were used. P < 0.05 was considered significant.
Adjusted for age, waist, body mass index, fasting glucose, systolic blood pressure, diastolic blood pressure, total cholesterol, triglyceride, low‐density lipoprotein cholesterol, metabolic syndrome, high‐sensitivity C‐reactive protein, serum uric acid, serum creatinine, aspartate aminotransferase, alanine aminotransferase, alkaline phosphatase, gamma glutamyltransferase, smoking status, and statin treatment in linear regression model. Coronary artery calcification score was log‐transformed after adding 1 due to its skewed distribution.
Adjusted for age, overweight, diabetes mellitus, hypertension, hypercholesterolemia, hypertriglyceridemia, low high‐density lipoprotein cholesterolemia, metabolic syndrome, high‐sensitivity C‐reactive protein, elevated serum uric acid, serum creatinine, smoking status, liver function, and statin treatment in logistic regression model. Coronary artery calcification score >100 was used as the dependent variable.
Influence of hsCRP on CAC Score and the Relation Between Bilirubin and hsCRP
Lower hsCRP tended to be associated with higher bilirubin levels (P < 0.001) (Supplementary Figure 1). The incidence of a CAC score >100 was higher among subjects with higher hsCRP (P trend = 0.028) (Supplementary Figure 2). In a multivariate model adjusted for age, overweight, diabetes mellitus, hypertension, hypercholesterolemia, hypertriglyceridemia, low HDL cholesterolemia, MetS, bilirubin, elevated serum uric acid, serum creatinine, smoking status, liver function (normal or abnormal), and statin treatment, hsCRP was not independently associated with CAC score (P = 0.052). Furthermore, we examined the correlation between bilirubin and hsCRP and found that an inverse correlation could be identified between bilirubin and hsCRP (r = −0.117, P < 0.001).
Discussion
Subjects with impaired renal function or chronic kidney disease appear to have a higher risk of coronary heart disease (CHD) as renal dysfunction leads to acceleration of CAC.21, 22 To eliminate confounding effect in this study, subjects with these disorders were excluded. As a result, in this large representative population of males (N = 3408), we found an independent association between increasing concentration of serum total bilirubin and decreasing CAC score, a predictor for CHD risk.12, 13 Our findings were in line with those of previous reports concerning the inverse relation between bilirubin and prevalence of carotid plaque,23 carotid IMT,9, 11 and PAD.10 However, a recent study has reported that CAC score is a better predictor of subsequent CHD events than carotid IMT.24 An MDCT‐based CAC score can be related to the extent and severity of coronary atherosclerotic disease, thus improving the prediction of CHD risk.12, 13
Our findings are consistent with previous evidence that most of the established CHD risk factors are determinants of CAC.25 Thus, to eliminate the effect of these factors, statistical models were adjusted for age, overweight, diabetes mellitus, hypertension, hypercholesterolemia, hypertriglyceridemia, low HDL cholesterolemia, MetS, hsCRP, elevated serum uric acid, serum creatinine, smoking status, liver function, and statin treatment. Adjustment for these factors, however, did not abolish the significant association of total bilirubin level with CAC score, suggesting that total bilirubin was independently associated with CAC score. The association of bilirubin level with CAC score tended to be unique in males, because we failed to identify the same association in females (N = 232) (data not shown). It was probably caused by the small population of female subjects. However, some studies have found that the relation between bilirubin and CHD varies by gender.25, 26 Therefore, a larger population of female subjects is required for confirmation.
Smoking may lower bilirubin concentration in males.27 We failed to detect the difference in bilirubin concentration between smokers and nonsmokers (data not shown). This was estimated to be caused by the lack of information of smoking duration, a more important determinant of bilirubin concentration than the number of cigarettes smoked per day.28
Inflammation plays a central role in atherosclerosis. In multiple epidemiologic studies, hsCRP as an inflammatory biomarker has been associated with increased risk of CHD.29, 30 Therefore, in this study hsCRP was necessarily considered. Subjects with autoimmune disease, neoplastic disease, chronic or current infections, or the use of anti‐inflammatory drugs in the past 30 days were excluded from our study for their confounding influence on hsCRP. Beyond our expectation, the association between hsCRP and CAC score was too weak to reach the statistical significance (P = 0.052) after adjustment for age, overweight, diabetes mellitus, hypertension, hypercholesterolemia, hypertriglyceridemia, low HDL cholesterolemia, MetS, bilirubin, elevated serum uric acid, serum creatinine, smoking status, liver function and statin treatment. However, our findings were in line with those of previous studies finding no or weak associations between hsCRP and CAC in asymptomatic individuals.31, 32, 33
Inflammation and oxidative stress are essential to the pathogenesis of atherosclerosis.6, 7, 8 Bilirubin is an antioxidant under physiological conditions, inhibiting inflammation in the vasculature.1, 4 These properties appear to allow bilirubin to inhibit multiple steps in atherogenesis. It is worth noting that we did identify a strong inverse correlation between bilirubin and hsCRP (r = −0.117, P < 0.001), supporting the theory that bilirubin suppresses atherogenesis through inhibition of systemic inflammatory activity.
To the best of our knowledge, the present study is the first to report on the association of total bilirubin with CAC score in a study based on a large population of males (N = 3408). However, the present investigation has several limitations. First, the present study was mainly focused on males rather than females. Second, study subjects were Korean men, therefore the results may not be applicable to other ethnic samples. Third, this study was not designed to establish causal relation; it was more suitable for identifying the associations between bilirubin and CAC score. Fourth, the information of detailed medications (eg, antihypertensive drugs) was unavailable. Despite these limitations, our findings at least suggest that serum bilirubin can be applied in medical practice, and low serum bilirubin concentration may be a potential risk factor of CAC in Korean males.
Conclusion
This study demonstrates an independent inverse association between serum total bilirubin and CAC score in males. Low serum bilirubin concentration would be useful as a potential risk factor for CAC in males. Additionally, reduced hsCRP may be 1 of the mechanisms for how bilirubin reduces CAC.
Acknowledgements
The authors thank all the physicians and study nurses who participated in data collection.
References
- 1. Stocker R, Yamamoto Y, McDonagh AF, et al. Bilirubin is an antioxidant of possible physiological importance. Science. 1987;235:1043–1046. [DOI] [PubMed] [Google Scholar]
- 2. Minetti M, Mallozzi C, Di Stasi AM, et al. Bilirubin is an effective antioxidant of peroxynitrite‐mediated protein oxidation in human blood plasma. Arch Biochem Biophys. 1998;352:165–174. [DOI] [PubMed] [Google Scholar]
- 3. Baranano DE, Rao M, Ferris CD, et al. Biliverdin reductase: a major physiologic cytoprotectant. Proc Natl Acad Sci U S A. 2002;99:16093–16098. [DOI] [PMC free article] [PubMed] [Google Scholar]
- 4. Pae HO, Oh GS, Lee BS, et al. 3‐Hydroxyanthranilic acid, one of L‐tryptophan metabolites, inhibits monocyte chemoattractant protein‐1 secretion and vascular cell adhesion molecule‐1 expression via heme oxygenase‐1 induction in human umbilical vein endothelial cells. Atherosclerosis. 2006;187:274–284. [DOI] [PubMed] [Google Scholar]
- 5. Kawamura K, Ishikawa K, Wada Y, et al. Bilirubin from heme oxygenase‐1 attenuates vascular endothelial activation and dysfunction. Arterioscler Thromb Vasc Biol 2005;25:155–160. [DOI] [PubMed] [Google Scholar]
- 6. Libby P. Inflammation in atherosclerosis. Nature. 2002;420: 868–874. [DOI] [PubMed] [Google Scholar]
- 7. Leopold JA, Loscalzo J. Oxidative enzymopathies and vascular disease. Arterioscler Thromb Vasc Biol. 2005;25:1332–1340. [DOI] [PubMed] [Google Scholar]
- 8. Stocker R, Keaney JF Jr. Role of oxidative modifications in atherosclerosis. Physiol Rev. 2004;84:1381–1478. [DOI] [PubMed] [Google Scholar]
- 9. Erdogan D, Gullu H, Yildirim E, et al. Low serum bilirubin levels are independently and inversely related to impaired flow‐mediated vasodilation and increased carotid intima‐media thickness in both men and women. Atherosclerosis. 2006;184:431–437. [DOI] [PubMed] [Google Scholar]
- 10. Perlstein TS, Pande RL, Beckman JA, et al. Serum total bilirubin level and prevalent lower‐extremity peripheral arterial disease: National Health and Nutrition Examination Survey (NHANES) 1999 to 2004. Arterioscler Thromb Vasc Biol. 2008;28: 166–172. [DOI] [PubMed] [Google Scholar]
- 11. Vitek L, Novotny L, Sperl M, et al. The inverse association of elevated serum bilirubin levels with subclinical carotid atherosclerosis. Cerebrovasc Dis. 2006;21:408–414. [DOI] [PubMed] [Google Scholar]
- 12. Rumberger JA, Brundage BH, Rader DJ, et al. Electron beam computed tomographic coronary calcium scanning: a review and guidelines for use in asymptomatic persons. Mayo Clin Proc. 1999;74:243–252. [DOI] [PubMed] [Google Scholar]
- 13. Budoff MJ, Achenbach S, Blumenthal RS, et al. Assessment of coronary artery disease by cardiac computed tomography: a scientific statement from the American Heart Association Committee on Cardiovascular Imaging and Intervention, Council on Cardiovascular Radiology and Intervention, and Committee on Cardiac Imaging, Council on Clinical Cardiology. Circulation. 2006;114:1761–1791. [DOI] [PubMed] [Google Scholar]
- 14. National Kidney Foundation. K/DOQI clinical practice guidelines for chronic kidney disease: evaluation, classification, and stratification. Am J Kidney Dis. 2002;39(2 suppl 1):S1–S266. [PubMed] [Google Scholar]
- 15. Moser KW, O’Keefe JH Jr, Bateman TM, et al. Coronary calcium screening in asymptomatic patients as a guide to risk factor modification and stress myocardial perfusion imaging. J Nucl Cardiol. 2003;10:590–598. [DOI] [PubMed] [Google Scholar]
- 16. Grundy SM, Cleeman JI, Daniels SR, et al. Diagnosis and management of the metabolic syndrome: an American Heart Association/National Heart, Lung, and Blood Institute scientific statement: executive summary. Circulation. 2005;112: 2735–2752. [DOI] [PubMed] [Google Scholar]
- 17. Pletcher MJ, Tice JA, Pignone M, et al. Using the coronary artery calcium score to predict coronary heart disease events: a systematic review and meta analysis. Arch Intern Med. 2004;164:1285–1292. [DOI] [PubMed] [Google Scholar]
- 18. Budoff MJ, Georgiou D, Brody A, et al. Ultrafast computed tomography as a diagnostic modality in the detection of coronary artery disease: a multicenter study. Circulation 1996;93:898–904. [DOI] [PubMed] [Google Scholar]
- 19. Hoff JA, Chomka EV, Krainik AJ, et al. Age and gender distributions of coronary artery calcium detected by electron beam tomography in 35,246 adults. Am J Cardiol. 2001;87:1335–1339. [DOI] [PubMed] [Google Scholar]
- 20. van ‘t Hof AW, Liem A, Suryapranata H, et al. Angiographic assessment of myocardial reperfusion in patients treated with primary angioplasty for acute myocardial infarction. Myocardial Blush Grade. Circulation. 1998;97:2302–2306. [DOI] [PubMed] [Google Scholar]
- 21. Fox CS, Larson MG, Keyes MJ, et al. Kidney function is inversely associated with coronary artery calcification in men and women free of cardiovascular disease: the Framingham Heart Study. Kidney Int. 2004;66:2017–2021. [DOI] [PubMed] [Google Scholar]
- 22. Raggi P, Boulay A, Chasan‐Taber S, et al. Cardiac calcification in adult hemodialysis patients. A link between end‐stage renal disease and cardiovascular disease? J Am Coll Cardiol. 2002;39:695–701. [DOI] [PubMed] [Google Scholar]
- 23. Ishizaka N, Ishizaka Y, Takahashi E, et al. High serum bilirubin level is inversely associated with the presence of carotid plaque. Stroke. 2001;32:580–583. [DOI] [PubMed] [Google Scholar]
- 24. Folsom AR, Kronmal RA, Detrano RC, et al. Coronary artery calcification compared with carotid intima‐media thickness in the prediction of cardiovascular disease incidence: the Multi‐Ethnic Study of Atherosclerosis (MESA). Arch Intern Med. 2008;168:1333–1339. [DOI] [PMC free article] [PubMed] [Google Scholar]
- 25. Djousse L, Levy D, Cupples LA, et al. Total serum bilirubin and risk of cardiovascular disease in the Framingham offspring study. Am J Cardiol. 2001;87:1196–1200. [DOI] [PubMed] [Google Scholar]
- 26. Hunt SC, Kronenberg F, Eckfeldt JH, et al. Association of plasma bilirubin with coronary heart disease and segregation of bilirubin as a major gene trait: the NHLBI family heart study. Atherosclerosis. 2001;154:747–754. [DOI] [PubMed] [Google Scholar]
- 27. Schwertner HA. Association of smoking and low serum bilirubin antioxidant concentrations. Atherosclerosis. 1998;136:383–387. [DOI] [PubMed] [Google Scholar]
- 28. Van Hoydonck PG, Temme EH, Schouten EG. Serum bilirubin concentration in a Belgian population: the association with smoking status and type of cigarettes. Int J Epidemiol. 2001;30:1465–1472. [DOI] [PubMed] [Google Scholar]
- 29. Danesh J, Wheeler JG, Hirschfield GM, et al. C‐reactive protein and other circulating markers of inflammation in the prediction of coronary heart disease. N Engl J Med. 2004;350:1387–1397. [DOI] [PubMed] [Google Scholar]
- 30. Cesari M, Penninx BW, Newman AB, et al. Inflammatory markers and onset of cardiovascular events: results from the Health ABC Study. Circulation. 2003;108:2317–2322. [DOI] [PubMed] [Google Scholar]
- 31. Jenny NS, Brown ER, Detrano R, et al. Associations of inflammatory markers with coronary artery calcification: results from the Multi‐Ethnic Study of Atherosclerosis. Atherosclerosis. 2010;209:226–229. [DOI] [PMC free article] [PubMed] [Google Scholar]
- 32. Freitas WM, Quaglia LA, Santos SN, et al. Association of systemic inflammatory activity with coronary and carotid atherosclerosis in the very elderly. Atherosclerosis. 2011;216:212–216. [DOI] [PubMed] [Google Scholar]
- 33. Hamirani YS, Pandey S, Rivera JJ, et al. Markers of inflammation and coronary artery calcification: a systematic review. Atherosclerosis. 2008;201:1–7. [DOI] [PubMed] [Google Scholar]