

Abstract
A high frequency of MAGE‐CT (cancer testis) antigens are expressed in Multiple Myeloma (MM) patients; however, in other plasma cell dyscrasias, their potential function remains unclear. We measured the expression of MAGE‐CT genes (MAGE‐C1/CT7, MAGE‐A3, MAGE‐C2/CT10) in 105 newly diagnosed amyloid light‐chain (AL) amyloidosis patients between June 2013 and January 2018 at Peking University People's Hospital using real‐time quantitative polymerase chain reaction. In the newly diagnosed AL patients, the positive expression rates of patients with MAGE‐C1/CT7, MAGE‐C2/CT10 and MAGE‐A3 were 83.8% (88/105), 56.71% (38/67) and 22.0% (13/59) respectively. There was no significant correlation between organ propensity and MAGE‐CT gene expression. Changes in the MAGE‐C1/CT7 levels were consistent with a therapeutic effect. The expression levels of MAGE‐C1/CT7, MAGE‐C2/CT10 and MAGE‐A3 provide potentially effective clinical indicators for auxiliary diagnoses and monitoring treatment efficacy in AL amyloidosis patients.
Keywords: amyloid light‐chain amyloidosis, cancer‐testis antigen gene, real‐time quantitative polymerase chain reaction
1. INTRODUCTION
Amyloidosis is a disorder that is characterized by misfolded insoluble protein fibrils deposited in a variety of tissues and organs. Amyloid light‐chain (AL) systemic amyloidosis is one form of systemic amyloidosis and is caused by plasma cell dyscrasia. Current therapies, including novel drugs and autologous stem cell rescue, significantly improve the survival of these patients. However, some patients are still not responsive to anti‐plasma cell therapy.1, 2, 3 Therefore, it is necessary to understand the biological characteristics of tumour plasma cells in AL amyloidosis. The mechanisms responsible for tumorigenic plasma cells in AL amyloidosis involve a series of genetic alterations in the bone marrow microenvironment that promote tumour growth and the failure of the immune system to recognize it.4, 5
The cancer‐testis families of tumour‐associated antigens (CT antigens) were originally discovered in patients with malignant melanoma. These antigens are expressed in a broad range of human tumours, while they are limited to developing germ cells in normal tissue and occasionally the placenta.6 Additionally, MAGE‐CT antigens are able to elicit cytotoxic T cells and humoural responses. Because CT antigens show restricted normal tissue expression and are highly immunogenic, they are attractive targets for diagnostic value as tumour markers and immunotherapeutic approaches in cancer patients. Regarding Multiple Myeloma (MM), our previous study and other research show that MAGE‐CT antigens are expressed with a frequency of 59%‐92.3% in symptomatic MM patients.7, 8, 9 However, the study of CT antigens is mainly concentrated in myeloma, and there is little research in areas of other plasma cell dyscrasia including AL amyloidosis.10
To investigate the relationship between MAGE‐CT antigen expression and AL amyloidosis, we measured the messenger ribonucleic acid expression of primary bone marrow specimens from newly diagnosed AL amyloidosis patients by real‐time polymerase chain reaction (RT‐PCR) and analysed their relationship with the prognosis of patients.
2. METHODS
2.1. Patients
Between June 2013 and Jan 2018, 105 AL amyloidosis patients who underwent MAGE CT gene detection were enrolled in this study. AL amyloidosis was diagnosed by the presence of Congo Red‐positive fibril deposition upon biopsy and evidence of monoclonal protein upon serum protein electrophoresis, serum/urine immunofixation electrophoresis, or free light chain (FLC) analysis. Immunofluorescence or immunoelectron microscopy was used to identify the AL subtype. Organ involvement was assessed according to the consensus criteria.11 Baseline data at diagnosis were extracted from medical records, whereas follow‐up information was recorded after each visit. CD138‐enriched (fluorescence in situ hybridization, FISH) panels for cytogenetics from bone marrow were collected from patients. FISH panels included t(4;14), t(14;16), t(11;14), del17p, +1q21. If the proportion of bone marrow clonal plasma cells ≥10% in one patient without bone destruction, hypercalcinaemia and tubular nephropathy AL amyloidosis was still diagnosed. The definition of plasma cell dyscrasia was established according to the definitions of the international myeloma working group.12, 13, 14 Informed consent was obtained from all patients prior to their enrolment in the study. The study design adhered to the principles of the Helsinki Declaration and was approved by the ethics committee of Peking University People's Hospital.
2.2. Real‐time quantitative PCR for MAGE‐CT antigens
Bone marrow samples were collected from patients with AL amyloidosis during routine diagnostic procedures at the Peking University People's Hospital. The real‐time quantitative PCR technique in our laboratory was described in detail previously.7 The 10‐μL PCR mixture contained 5 μL 1× TaqMan® Universal PCR Master Mix (Applied Biosystems, Foster City, California), 400 nmol/L primers, 250 nmol/L fluorescent probes and 150‐500 ng cDNA. PCR was performed with the ABI PRISM® 7500 FAST Sequence Detection System (Applied Biosystems) at 50°C for 2 minutes and 95°C for 10 minutes, followed by 50 cycles at 95°C for 15 seconds and 60°C for 1 minute. The expression levels of the three CT antigen genes (MAGE‐C1/CT7, MAGE‐C2/CT10, MAGE‐A3) were quantified by qPCR using the abelson (ABL) genes as internal controls. The primers and probes were designed using Primer Express 2.0 software (Applied Biosystems, California) as follows: ABL (forward 5'‐CCGCTGACCATCAATAAGGAA‐3', reverse 5'‐GATGTAGTTGCTTGGGACCCA‐3' and probe 5'‐FAM‐CCATTTTTGGTTTGGGCTTCACACCATT‐TAMARA‐3'); MAGE‐C1/CT7 (forward 5'‐TTGTCTTCTGGGAACCTTGACTC‐3', reverse 5'‐TGAGGGACACATACATCCTAAAAGC‐3' and probe 5'‐FAM‐ACTGCCTGGGCCTCCTCTGCTGT‐BHQ‐3'); MAGE‐C2/CT10 (forward5'‐GTGTGAGGCACACAGCCTAAAG‐3', reverse 5'‐GGAGGCATGACGACTTCTTCA‐3' and probe 5'‐FAMAGGAGTCAAGGCCTGTTGGATCTCATCA‐BHQ‐3'); and MAGE‐A3 (forward 5'‐GGTGAGGAGGCAAGGTTCTGA‐3', reverse, 5'‐GTGCTGACTCCTCTGCTCAAGAG‐3' and probe, 5'‐FAM‐AGATCTGCCAGTGGGTCTCCATTGCC‐BHQ‐3'). All CT antigens were quantified against the ABL standard curve in bone marrow specimens to decrease experimental error. The detection sensitivity was approximately 1‐10 copies in the plasmid DNA standards and 10−4‐10−5 copies in bone marrow specimens.
2.3. Treatment response and outcome
A total of 66 out of 105 patients received bortezomib‐based chemotherapy. Haematological response and organ response were evaluated according to the consensus guidelines.15
2.4. Statistical analysis
The χ 2 or Fisher's exact tests were used for categorical variables, whereas a t test or nonparametric test was used for continuous variables. Standard deviation for the positive distribution and quartiles for the non‐normal distribution were calculated to compute the standard. End‐points were calculated at the time of last contact; the overall survival (OS) was defined from the first time of relapse to the last contact or the time of death. A survival curve was generated using the Kaplan‐Meier method. Comparison of survival was performed by the log‐rank test. A P < 0.05 denoted statistical significance. All P values were two‐sided. All statistical analyses were performed with SPSS 23.0 (Inc, Chicago, IL).
3. RESULTS
3.1. Baseline characteristics of patients
The median age of all the patients at baseline was 60.8 years (range, 37‐85) with a male/female ratio of 2.18 (Table 1). The frequency of organ involvement was kidney (79.2%), heart (68.3%), liver (13.9%), peripheral nerve (11.4%) and intestine (9.5%). Of the patients, 68.3% had more than one organ involved. The median value of NT‐proBNP was 3885.4 pg/mL (range, 5‐35000); the median value of troponin I (cTnI) was 0.129 µg/L (range, 0.001‐1.474). A total of 28.9% of patients were Mayo 2004 cardiac stage III, 22.1% of patients were Mayo 2012 stage III, and 16.9% of patients were Mayo 2012 stage IV patients at diagnosis. We also included 128 patients with active myeloma, 14 with plasma cell leukaemia, nine with smouldering myeloma, 67 with monoclonal gammopathy of undetermined significance (MGUS) and 17 with active myeloma complicated with AL amyloidosis.
Table 1.
Baseline characteristics in AL amyloidosis
| Baseline characteristics in AL | Values |
|---|---|
| Sex (Male, %) | 72 (68.6%) |
| Age (median, range, y) | 60.8 (37‐85) |
| Subtype of light chain (kappa/lambda) | 29/76 |
| Organ involvement (%) | |
| Kidney/Heart/Liver/Intestinal/Nerve | 79.2%/68.3%/13.9%/11.4%/9.5% |
| >1 organ involved by AL (%) | 68.3% |
| NT‐proBNP | |
| Median (range, pg/mL) | 3885.4 (5‐35000) |
| ≥8500 pg/mL (%) | 9.5% |
| cTnI | |
| Median (range, ug/l) | 0.129 (0.001‐1.474) |
| ≥0.07 μg/L (%) | 35.2% |
| IVS (mm) | 1.1 (0.6‐2.1) |
| Hb (median, range, g/L) | 123 (66‐169) |
| Creatinine(median, range, μmol/L) | 124.4 (22‐491) |
| ALP (median, range, U/L) | 117.4 (22‐1035) |
| LDH (median, range, U/L) | 226.5 (109‐522) |
| β2MG(median, range, μg/mL) | 4.5 (1.6‐9.0) |
| BMPC (median, range, %) | 8.7% (0%‐40%) |
| Mayo Stage (2004) | |
| I/II/III (%) | 25.6%/45.6%/28.9% |
| Mayo Stage (2012) | |
| I/II/III/IV | 35.1%/26.0%/22.1%/16.9% |
Abbreviations: ALP, alkaline phosphatase; β2MG, β2microglobulin; BMPC, bone marrow plasma cell; cTnI, cardiac troponin; Hb, haemoglobin; IVS, interventricular septum; LDH, lactate dehydrogenase; NT‐proBNP, N‐terminal fragment of the pro‐brain natriuretic peptide.
3.2. Expression frequency and organ tropism of three CT antigen genes in AL amyloidosis
As shown in Table 2, in the newly diagnosed AL patients, 83.8% (88/105) of specimens expressed MAGE C1/CT7. The rank of the positive expression rate in the newly diagnosed AL was MAGE‐C1/CT7 (83.8%, 88/105) > MAGE‐C2/CT10 (56.71%, 38/67) > MAGE‐A3 (22.0%, 13/59). For MAGE‐C1/CT7, the median value was 7.28% (range: 0.005%‐82.27%). If we divided the expression intensity of MAGE into four groups (<0.1%, 0.1%‐1%, 1%‐10%, 10%‐100%), there were 28 (31.8%), 16 (18.2%), 30 (34.1%) and 14 (15.9%) patients in the above groups respectively. There were 14 AL amyloidosis patients with dFLC <50 mg/dL, among whom 12 patients (85.7%) had positive expression for MAGE‐C1/CT7. The average level of MAGE‐C1/CT7 expression was 2.587% (range: 0.01%‐22.16%).
Table 2.
Correlation of the clinic‐pathological characteristics of patients with AL amyloidosis with the expression of CT antigens
| MAGE‐C1/CT7 (n = 105) | MAGE‐C2/CT10 (n = 67) | MAGE‐A3 (n = 59) | |||||||
|---|---|---|---|---|---|---|---|---|---|
| + | − | P | + | − | P | + | − | P | |
| PC value | 9.102 (4‐11.375) | 5.406 (3‐8.75) | 0.107 | 10.962 (5‐15) | 6.089 (4‐9) | 0.008 | 12.594 (6.5‐16.75) | 7.847 (4‐9.5) | 0.011 |
| LDH | 228.273 (179.75‐271.25) | 200.688 (174.75‐217.75) | 0.088 | 223.385 (168‐234) | 232.893 (181.5‐296.5) | 0.542 | 220.188 (152‐250.5) | 231.245 (183‐276) | 0.250 |
| β2MG | 4.294 (2.773‐5.848) | 4.798 (2.75‐8) | 0.631 | 4.204 (2.37‐5.81) | 4.942 (3.3‐8) | 0.173 | 4.077 (2.31‐6.49) | 4.674 (2.78‐6.81) | 0.398 |
| dFLC | 431.54 (58.38‐466.41) | 550.18 (67.92‐396) | 0.988 | 505.39 (84.68‐571.5) | 569.28 (69.15‐769.5) | 0.936 | 325.91 (136.49‐421.08) | 596.71 (61.11‐961.90) | 0.660 |
| NT‐pro BNP | 4112.88 (386.6‐4879.5) | 2657.05 (107‐2671) | 0.278 | 4296.0 (180.5‐4865.8) | 4056.23 (280.6‐4726.0) | 0.374 | 3552.16 (54.4‐4907.0) | 5939.8 (250.1‐3563.0) | 0.593 |
| cTnI | 0.1361 (0.0085‐0.1533) | 0.081 (0.001‐0.0325) | 0.038 | 0.085 (0.003‐0.108) | 0.164 (0.003‐0.151) | 0.695 | 0.122 (0.001‐0.193) | 0.115 (0.004‐0.084) | 0.974 |
| t(11;14) | 14.3% (10/70) | 23.1% (3/13) | 0.423 | 14.3% (5/35) | 333% (8/24) | 0.083 | 7.1% (1/14) | 25.6% (11/43) | 0.142 |
| Del(17p) | 1.4% (1/74) | 0 (0/15) | 0.651 | 0 | 0 | — | 0 | 0 | — |
| 1q21 | 25.7% (19/74) | 13.3% (2/15) | 0.305 | 29.7% (11/37) | 23.1% (6/2) | 0.558 | 66.7% (10/15) | 15.2% (7/46) | <0.001 |
Abbreviations: β2MG, β2microglobulin; cTnI, cardiac troponin; dFLC, difference between involved and uninvolved free light chain; LDH, lactate dehydrogenase; NT‐proBNP, N‐terminal fragment of the pro‐brain natriuretic peptide; PC, plasma cell.
There was no significant correlation between organ propensity and MAGE‐CT gene expression. Additionally, in each targeted organ subgroup, the rank of the positive expression rate in the newly diagnosed AL was MAGE‐C1/CT7 > MAGE‐C2/CT10 > MAGE A3, which was the same as in the overall cohort.
3.3. Spectrum of MAGEC1/CT7 expression in different plasma cell dyscrasias
The expression of the MAGE‐C1/CT7 gene was significantly highest in the plasma cell leukaemia and active myeloma groups and lowest in the MGUS group (Figure 1). The level of MAGE‐C1/CT7 gene expression in MM patients was higher than in the amyloidosis and MGUS groups (P < 0.001). Additionally, the level of MAGE‐C1/CT7 gene expression in the amyloidosis group was higher than in the MGUS group (P < 0.001).
Figure 1.
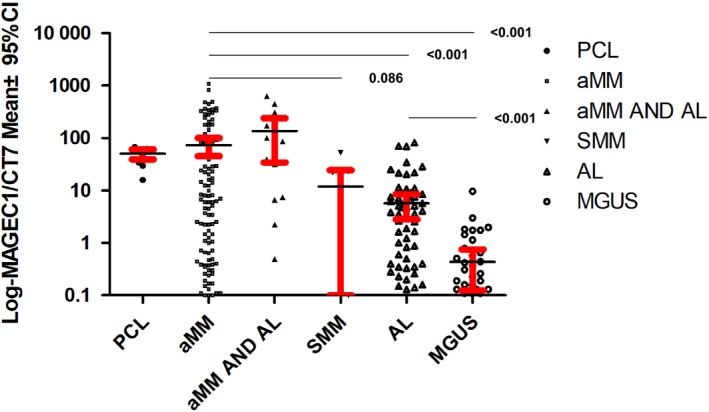
The spectrum of MAGE‐C1/CT7 expression in different plasma cell dyscrasia. The level of MAGE‐C1/CT7 gene expression in plasma cell leukaemia (PCL), aMM, aMM complicated with AL, SMM, AL and monoclonal gammopathy of undetermined significance (MGUS) was, 50.20%, 78.50%, 152.5%, 15.38%, 6.90% and 0.64% respectively
3.4. Correlation between CT antigens and prognostic factors in AL amyloidosis
The percentages of BM plasma cell infiltration positively correlated with the expression levels of MAGE‐C2/CT10 (P = 0.008) and MAGE‐A3 (P = 0.011). We did not find a correlation between MAGE‐CT antigens and dFLC or NTproBNP. Additionally, there was no correlation between the β2‐microglobulin (β2 MG), Lactate Dehydrogenase (LDH)16, 17 and MAGE‐CT genes. The level of cTnI correlated with MAGE‐C1/CT7 (P = 0.038).
3.5. MAGE‐C1/CT7 change in different response groups
A longitudinal analysis was performed on 28 AL patients during follow‐up. Changes in the disease state from the clinical course of each patient were divided into three groups: Complete Remission (15 paired samples); Partial Remission (9 paired samples); Stable Disease/Progression Disease (PD, 4 paired samples). Most patients showed very good correlation between the changing levels of dFLC (difference between the involved and uninvolved light chain) and MAGE‐C1/CT7 gene expression (Figure 2). Of importance, a clinically significant decrease in serum FLC was associated with a decrease in MAGE‐C1/CT7 expression. The level of dFLC in one patient decreased; however, the MAGE‐C1/CT7 of this patient increased. This female patient was 50 years old with Mayo 2012 stage III. The baseline‐free light lambda was 1592.5 mg/L, whereas the dFLC was 1583.2 mg/L. The baseline MAGE‐C1/CT7 was 0.28%. In 20 September 2016, we used CyborD (bortezomib, cyclophosphamide, dexamethasone) for 2 cycles, after which the decrease in amylogenic FLC were 1137 mg/dL; however, the level of MAGEC1/CT7 increased to 2.67%. The patient received the same CyborD for another two cycles, after which changes in amylogenic FLC (from the best) increased by 117.6%. The patient was determined to be PD and died on 01 April 2017.
Figure 2.
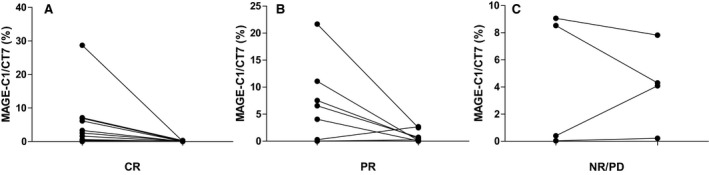
MAGE‐C1/CT7 change in different response groups. MAGE‐C1/CT7 expression levels correlate with the clinical course of AL amyloidosis. (A), The expression levels of MAGE‐C1/CT7 decreased in 15 patients whose clinical efficacy was complete remission (CR). (B), The expression levels of MAGE‐C1/CT7 decreased in 7 out 9 patients whose clinical efficacy was partial remission (PR). (C), The expression levels of MAGE‐C1/CT7 increased or stable in 3 out 4 patients whose clinical efficacy was NR (no remission)/PD (progression disease).
3.6. Relationship between MAGE antigen and OS
After a median follow‐up duration of 1266 days (range, 18‐1863), the median survival was not reached for either group, and the 1‐ and 2‐year OS were 77.1% and 65.5% respectively. There was no significant difference in overall survival among the patients whose MAGE‐CT antigens were positive or negative (Figure 3).
Figure 3.
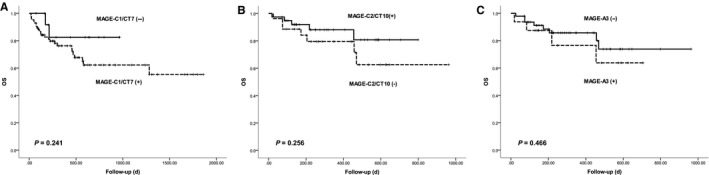
Overall Survival according to the expression of MAGE‐CT antigens. (A), MAGE‐C1/CT7; (B) MAGE‐C2/CT10; (C) MAGE‐A3
4. DISCUSSION
Our results indicated that CT antigens were potentially effective molecular markers of AL amyloidosis and have clinical implications for monitoring treatment efficacy.
We found that CT antigens (CTA) were commonly expressed in AL amyloidosis. The most prevalent CTA was MAGE‐C1/CT7, which we identified in 88/105 (83.8%) cases. The high frequency of MAGE‐CT expression in AL amyloidosis has clinical significance. Our results indicated that CT antigens were potentially effective molecular markers of AL amyloidosis and have clinical implications for auxiliary diagnoses. The prevalence of MAGE‐CT expression in our AL series was higher than in one previous study of AL amyloidosis, in which 66% positivity for C1/CT7 using immunohistochemistry was observed. The discrepancy was probably due to the different detection methods. Our qPCR protocol provided a reliable and sensitive method for the quantification of MAGE‐C1/CT7, MAGE‐C2/CT10, MAGE‐A3 expression levels.7 The detection sensitivity was approximately 1‐10 copies for plasmid DNA standards and 10−4‐10−5 copies in bone marrow specimens with a high level of sensitivity.18
The quantification of MAGE‐C1/CT7 antigens positively correlated with individual IgH levels in MM patients (data not shown). These results suggested that MAGE‐CT antigens were potential markers for the tumour burden of plasma cell dyscrasia including AL amyloidosis. Minimal residual disease (MRD) is trending to become a new surrogate research end‐point, and MAGE‐CT antigens are a new MRD marker that is less time‐consuming to use than traditional RT‐PCR.19
The change in MAGE‐CT gene expression paralleled the change in FLC, which was the same as that in myeloma.7, 18, 20 In addition, one patient showed changes in MAGE before FLC changes. These results suggested that MAGE‐C1/CT7 has the potential to detect disease relapse/progression at an earlier stage than the standard clinical monitoring method. These results also showed that the changes in MAGE and FLC could be a good supplement to the monitoring of curative efficacy, not only to monitor the pathogenicity FLC of the plasma cells but also to analyse the changes in the antigen expressed by the plasma cell itself, which may be more comprehensive for the evaluation of some patients.
For AL amyloidosis patients with dFLC <50 mg/L, it was difficult to evaluate efficacy through serological testing during the follow‐up period.21, 22 In total, 12 patients with dFLC <40 were tested for MAGE simultaneously. The positive frequency was 85.7%, and the average level was 2.59%. It was suggested that MAGE gene detection may be a good alternative monitoring method for this subgroup of patients.
Another contribution of this work was that we reported the difference in the expression intensity of the MAGE gene in different plasma cell dyscrasias. It was found that the expression of MAGE‐C1/CT7 was the strongest in plasma cell leukaemia and weakest in MGUS. Additionally, the expression of MAGE‐C2/CT10 and A3 genes correlated with the plasma cell percentage in AL amyloidosis. All these observations suggested that MAGE‐CT antigens correlated with plasma cell proliferation, which was in accordance with previous reports that MAGE CT antigens were highly expressed in advanced myeloma and less expressed in early stage and MGUS stage.20, 23 Our results related to amyloidosis and those of previous studies of myeloma suggested a novel association between these antigens and the dysregulation of plasma cell cycling.
It was reported that MAGE‐C1/CT7 and MAGE‐A3 played an important role in promoting the survival of myeloma cells and clonogenic precursors by reducing the rate of apoptosis.24 Additionally, MAGE‐C1/CT7 played a role in the regulation of the myeloma cell cycle. Silencing MAGE‐C1/CT7 resulted in a statistically significant increase in the percentage of myeloma cells in G0/G1 phase and significantly decreased the number of cells in the G2/M phase of the cell cycle.25 In addition, some studies have shown an association between the expression of CTAs and a phenotype of resistance to chemotherapy treatments.26
The prognostic role of the three CT antigens in AL amyloidosis was analysed. In addition to plasma cell (PC) percentage, we found that none of the MAGE CT genes correlated with β2MG, LDH or NT‐proBNP, which are prognostic indictors for AL amyloidosis. The expression level of MAGE‐C1/CT7 correlated with the level of cTnI. Chromosomal abnormalities, including 1q21, t (11; 14), were associated with poor survival rates.27 In this study, patients with MAGE A3 expression had more frequent 1q21 amplification. We did not find any correlation between MAGE CT gene expression and a propensity to specific affected organs (organ tropism). Organ tropism has been reported to be partially related to PC clones derived from particular IGLV genes.28, 29, 30, 31 Our observations in this study suggested that MAGE genes may not be potential factors regulating organ tropism. Because the overall survival for AL amyloidosis is very complex and mainly relies on the amount of amylogenic‐free light chain and the degree of damage to the heart, we did not find any correlation between MAGE CT gene expression and overall survival. Due to the short follow‐up time and limited cases, these conclusions need to be re‐evaluated in larger sample sizes and during longer follow‐up times.
Vaccine therapy is emerging in MM but not in AL amyloidosis.23, 32, 33, 34 Low tumour burden and low tumour cell proliferative index are two advantages for immunotherapy in AL amyloidosis.35 The specificity to malignant plasma cells and the common expression of these antigens in AL amyloidosis strongly suggest that they are promising targets for vaccine immunotherapy. Formulating vaccines with MAGE‐CT antigens is an attractive strategy.
In conclusion, our study demonstrated that MAGE‐CT genes, especially MAGE C1/CT7, were commonly expressed in AL amyloidosis, and the expression levels of MAGE CT genes could potentially be used as clinical indicators for auxiliary diagnoses and monitoring treatment efficacy in AL patients. However, these conclusions still need further verification through prospective studies with larger sample sizes. Further investigation into the function of MAGE CT genes in AL amyloidosis is warranted to reveal novel therapeutic targets.
CONFLICT OF INTEREST
The authors declare that there is no conflict of interest.
AUTHOR CONTRIBUTIONS
Jin Lu and Guo‐Rui Ruan designed the study. Jin Lu performed data analysis. Guo‐Rui Ruan did the RT‐PCR examination. Yang Liu performed the data collection, and drafted the manuscript. Jin Lu, Xiaojun Huang and Kai‐Yan Liu provided significant input on the manuscript and data analysis. Lei Wen, Ying Kang and Ling Ma helped to collect data and draft the manuscript. All authors read and approved the final manuscript.
ACKNOWLEDGEMENTS
The study was supported by grants from the National Basic Research Program of China (Grant 2013CB733701), the Major Research plan of the National Natural Science Foundation of China (Grant 91853202), the National Natural Sciences Foundation of China (Grants 81270572, 81670098, 81570182 and 81770156), the University of Michigan Health System–Peking University Health Science Center Joint Institute for Translational and Clinical Research (BMU20160562) and the National Key Project of Research and Development of China [Grant 2017YFA0104500].
Liu Y, Wen L, Ma L, et al. MAGE genes: Prognostic indicators in AL amyloidosis patients. J Cell Mol Med. 2019;23:5672–5678. 10.1111/jcmm.14475
Data Availability Statement: The data that support the findings of this study are available from the corresponding author upon reasonable request.
Contributor Information
Guo‐Rui Ruan, Email: ruanguorui@pkuph.edu.cn.
Jin Lu, Email: jin1lu@sina.com.
DATA AVAILABILITY STATEMENT
The data that support the findings of this study are available from the corresponding author upon reasonable request.
REFERENCES
- 1. Dispenzieri A, Buadi F, Kumar SK, et al. Treatment of immunoglobulin light chain amyloidosis: mayo stratification of myeloma and Risk‐Adapted therapy (mSMART) consensus statement. Mayo Clin Proc. 2015;90(8):1054‐1081. [DOI] [PubMed] [Google Scholar]
- 2. Huang XH, Liu ZH. The clinical presentation and management of systemic light‐chain amyloidosis in China. Kidney Dis (Basel). 2016;2(1):5672‐9. [DOI] [PMC free article] [PubMed] [Google Scholar]
- 3. Huang X, Wang Q, Jiang S, Chen W, Zeng C, Liu Z. The clinical features and outcomes of systemic AL amyloidosis: a cohort of 231 Chinese patients. Clin Kidney J. 2015;8(1):120‐126. [DOI] [PMC free article] [PubMed] [Google Scholar]
- 4. Zhang C, Huang X, Li J. Light chain amyloidosis: where are the light chains from and how they play their pathogenic role? Blood Rev. 2017;31(4):261‐270. [DOI] [PubMed] [Google Scholar]
- 5. Muchtar E, Dispenzieri A, Kumar SK, et al. Immunoparesis in newly diagnosed AL amyloidosis is a marker for response and survival. Leukemia. 2017;31(1):92‐99. [DOI] [PubMed] [Google Scholar]
- 6. Hofmann O, Caballero OL, Stevenson BJ, et al. Genome‐wide analysis of cancer/testis gene expression. Proc Natl Acad Sci USA. 2008;105(51):20422‐20427. [DOI] [PMC free article] [PubMed] [Google Scholar]
- 7. Zhang Y, Bao LI, Lu J, et al. The clinical value of the quantitative detection of four cancer‐testis antigen genes in multiple myeloma. Mol Cancer. 2014;13:25. [DOI] [PMC free article] [PubMed] [Google Scholar]
- 8. de Carvalho F, Alves VL, Braga WM, Xavier CV Jr, Colleoni GW. MAGE‐C1/CT7 and MAGE‐C2/CT10 are frequently expressed in multiple myeloma and can be explored in combined immunotherapy for this malignancy. Cancer Immunol Immunother. 2013;62(1):191‐195. [DOI] [PMC free article] [PubMed] [Google Scholar]
- 9. Pabst C, Zustin J, Jacobsen F, et al. Expression and prognostic relevance of MAGE‐C1/CT7 and MAGE‐C2/CT10 in osteolytic lesions of patients with multiple myeloma. Exp Mol Pathol. 2010;89(2):175‐181. [DOI] [PubMed] [Google Scholar]
- 10. Rosenzweig MA, Landau H, Seldin D, et al. Cancer‐testis antigen expression and immunogenicity in AL amyloidosis. Blood Cancer J. 2012;2:e90. [DOI] [PMC free article] [PubMed] [Google Scholar]
- 11. Gertz MA, Comenzo R, Falk RH, et al. Definition of organ involvement and treatment response in immunoglobulin light chain amyloidosis (AL): a consensus opinion from the 10th International Symposium on Amyloid and Amyloidosis, Tours, France, 18–22 April 2004. Am J Hematol. 2005;79(4):319‐328. [DOI] [PubMed] [Google Scholar]
- 12. Rajkumar SV, Dimopoulos MA, Palumbo A, et al. International Myeloma Working Group updated criteria for the diagnosis of multiple myeloma. Lancet Oncol. 2014;15(12):e538‐e548. [DOI] [PubMed] [Google Scholar]
- 13. Kyle RA, Durie B, Rajkumar SV, et al. Monoclonal gammopathy of undetermined significance (MGUS) and smoldering (asymptomatic) multiple myeloma: IMWG consensus perspectives risk factors for progression and guidelines for monitoring and management. Leukemia. 2010;24(6):1121‐1127. [DOI] [PMC free article] [PubMed] [Google Scholar]
- 14. Fernández de Larrea C, Kyle RA, Durie B, et al. Plasma cell leukemia: consensus statement on diagnostic requirements, response criteria and treatment recommendations by the International Myeloma Working Group. Leukemia. 2013;27(4):780‐791. [DOI] [PMC free article] [PubMed] [Google Scholar]
- 15. Comenzo RL, Reece D, Palladini G, et al. Consensus guidelines for the conduct and reporting of clinical trials in systemic light‐chain amyloidosis. Leukemia. 2012;26(11):2317‐2325. [DOI] [PubMed] [Google Scholar]
- 16. Muchtar E, Dispenzieri A, Lacy MQ, et al. Elevation of serum lactate dehydrogenase in AL amyloidosis reflects tissue damage and is an adverse prognostic marker in patients not eligible for stem cell transplantation. Br J Haematol. 2017;178(6):888‐895. [DOI] [PMC free article] [PubMed] [Google Scholar]
- 17. Chim CS. Lactate dehydrogenase as a prognostic marker in AL amyloidosis: expected or unexpected? Br J Haematol. 2017;178(6):833‐835. [DOI] [PubMed] [Google Scholar]
- 18. Atanackovic D, Luetkens T, Hildebrandt Y, et al. Longitudinal analysis and prognostic effect of cancer‐testis antigen expression in multiple myeloma. Clin Cancer Res. 2009;15(4):1343‐1352. [DOI] [PubMed] [Google Scholar]
- 19. von Boehmer L, Keller L, Mortezavi A, et al. MAGE‐C2/CT10 protein expression is an independent predictor of recurrence in prostate cancer. PLoS ONE. 2011;6(7):e21366. [DOI] [PMC free article] [PubMed] [Google Scholar]
- 20. Shires K, Wienand K. Cancer testis antigen MAGE C1 can be used to monitor levels of circulating malignant stem cells in the peripheral blood of multiple myeloma patients. J Cancer Res Clin Oncol. 2016;142(11):2383‐2396. [DOI] [PMC free article] [PubMed] [Google Scholar]
- 21. Sidana S, Tandon N, Dispenzieri A, et al. Clinical presentation and outcomes in light chain amyloidosis patients with non‐evaluable serum free light chains. Leukemia. 2018;32(3):729‐735. [DOI] [PubMed] [Google Scholar]
- 22. Palladini G, Dispenzieri A, Gertz MA, et al. New criteria for response to treatment in immunoglobulin light chain amyloidosis based on free light chain measurement and cardiac biomarkers: impact on survival outcomes. J Clin Oncol. 2012;30(36):4541‐4549. [DOI] [PubMed] [Google Scholar]
- 23. Dhodapkar MV, Osman K, Teruya‐Feldstein J, et al. Expression of cancer/testis (CT) antigens MAGE‐A1, MAGE‐A3, MAGE‐A4, CT‐7, and NY‐ESO‐1 in malignant gammopathies is heterogeneous and correlates with site, stage and risk status of disease. Cancer Immun. 2003;3:9. [PubMed] [Google Scholar]
- 24. Atanackovic D, Hildebrandt Y, Jadczak A, et al. Cancer‐testis antigens MAGE‐C1/CT7 and MAGE‐A3 promote the survival of multiple myeloma cells. Haematologica. 2010;95(5):785‐793. [DOI] [PMC free article] [PubMed] [Google Scholar]
- 25. Carvalho FD, Costa ET, Camargo AA, et al. Targeting MAGE‐C1/CT7 expression increases cell sensitivity to the proteasome inhibitor bortezomib in multiple myeloma cell lines. PLoS ONE. 2011;6(11):e27707. [DOI] [PMC free article] [PubMed] [Google Scholar]
- 26. Duan Z, Duan Y, Lamendola DE, et al. Overexpression of MAGE/GAGE genes in paclitaxel/doxorubicin‐resistant human cancer cell lines. Clin Cancer Res. 2003;9(7):2778‐2785. [PubMed] [Google Scholar]
- 27. Muchtar E, Dispenzieri A, Kumar SK, et al. Interphase fluorescence in situ hybridization in untreated AL amyloidosis has an independent prognostic impact by abnormality type and treatment category. Leukemia. 2017;31(7):1562‐1569. [DOI] [PubMed] [Google Scholar]
- 28. Abraham RS, Geyer SM, Price‐Troska TL, et al. Immunoglobulin light chain variable (V) region genes influence clinical presentation and outcome in light chain‐associated amyloidosis (AL). Blood. 2003;101(10):3801‐3808. [DOI] [PubMed] [Google Scholar]
- 29. Comenzo RL, Wally J, Kica G, et al. Clonal immunoglobulin light chain variable region germline gene use in AL amyloidosis: association with dominant amyloid‐related organ involvement and survival after stem cell transplantation. Br J Haematol. 1999;106(3):744‐751. [DOI] [PubMed] [Google Scholar]
- 30. Comenzo RL, Zhang Y, Martinez C, Osman K, Herrera GA. The tropism of organ involvement in primary systemic amyloidosis: contributions of Ig V(L) germ line gene use and clonal plasma cell burden. Blood. 2001;98(3):714‐720. [DOI] [PubMed] [Google Scholar]
- 31. Kourelis TV, Dasari S, Theis JD, et al. Clarifying immunoglobulin gene usage in systemic and localized immunoglobulin light‐chain amyloidosis by mass spectrometry. Blood. 2017;129(3):299‐306. [DOI] [PubMed] [Google Scholar]
- 32. Wang L, Jin N, Schmitt A, et al. T cell‐based targeted immunotherapies for patients with multiple myeloma. Int J Cancer. 2015;136(8):1751‐1768. [DOI] [PubMed] [Google Scholar]
- 33. Jung SH, Lee HJ, Vo MC, Kim HJ, Lee JJ. Immunotherapy for the treatment of multiple myeloma. Crit Rev Oncol Hematol. 2017;111:87‐93. [DOI] [PubMed] [Google Scholar]
- 34. Rodriguez‐Otero P, Paiva B, Engelhardt M, Prosper F, San Miguel JF. Is immunotherapy here to stay in multiple myeloma? Haematologica. 2017;102(3):423‐432. [DOI] [PMC free article] [PubMed] [Google Scholar]
- 35. van der Burg SH. Correlates of immune and clinical activity of novel cancer vaccines. Semin Immunol. 2018;39:119–136. [DOI] [PubMed] [Google Scholar]
Associated Data
This section collects any data citations, data availability statements, or supplementary materials included in this article.
Data Availability Statement
The data that support the findings of this study are available from the corresponding author upon reasonable request.