

Abstract
Background:
The best timing for coronary angiography (immediate vs early) in patients with acute non–ST‐elevation myocardial infarction (NSTEMI) is controversial.
Hypothesis:
Evaluate in NSTEMI patients the effects of an immediate compared to an early invasive strategy on microvascular damage, myocardial perfusion, and infarct size.
Methods:
We randomized 54 consecutive patients with first episode of NSTEMI: 27 patients (22 males, age 58.8 ± 9.4 years, group A) underwent immediate (≤6 hours) percutaneous coronary intervention (PCI) with a double bolus of eptifibatide, and 27 patients (24 males, age 59.7 ± 9.8 years, P = 0.72, group B) underwent early (7–72 hours) PCI with upstream eptifibatide. Microvascular damage was evaluated at predischarge by myocardial contrast echocardiography, and the contrast defect length was calculated.
Results:
There were no significant differences in pre‐PCI myocardial blush grade (MBG) (41% MBG 0 or 1 in group A vs 37% MBG 0 or 1 in group B, P = 0.78), in post‐PCI MBG (7.4% MBG 0 or 1 in both groups, P = 1.00), and in contrast defect length (4.5% in group A vs 2.8% in group B, P = 0.56). However, group A showed a significant reduction in creatine kinase myocardial band isoenzyme peak (26 ± 26 ng/mL in group A vs 69 ± 79 ng/mL in group B, P = 0.01) and in troponin T peak (0.84 ± 1.2 ng/mL in group A vs 1.8 ± 2.1 ng/mL in group B, P = 0.048).
Conclusions:
In patients with NSTEMI treated with eptifibatide, immediate PCI is associated with less increase in myonecrosis markers compared with PCI within 72 hours. There were no significant differences in myocardial perfusion between the 2 strategies. Copyright © 2010 Wiley Periodicals, Inc.
The authors have no funding, financial relationships, or conflicts of interest to disclose.
Introduction
In patients with acute non–ST‐elevation myocardial infarction (NSTEMI), an early invasive strategy with coronary angiography (CA) and subsequent revascularization through percutaneous coronary intervention (PCI) is associated with reduced rates of death and myocardial infarction (MI) in comparison with a conservative strategy.1 Guidelines for the treatment of patients with acute coronary syndromes (ACS) recommend an early (≤72 hours) invasive strategy for patients admitted with diagnosis of NSTEMI.2 Excluding conditions requiring emergency interventions (refractory angina, shock, and life‐threatening arrhythmias), controversy remains regarding the optimal timing between hospital admission and the invasive procedure, with 2 different alternatives for the invasive approach: immediate (<6 hours) or early (≤72 hours).3 Early CA with upstream glycoprotein (GP) IIb/IIIa inhibitors is associated with a reduction in intracoronary thrombus burden4, 5 and improvement in myocardial tissue‐level perfusion.6 On the other hand, immediate CA may reduce the bleeding risk related to GP IIb/IIIa inhibitor therapy, and in a randomized trial this strategy in the setting of non–ST‐elevation ACS was associated with a better outcome.7
The aim of our study was to evaluate the angiographic flow, the myocardial perfusion, and the infarct size in patients with a first episode of NSTEMI treated with GP IIb/IIIa inhibitors who underwent “immediate” CA and PCI (≤6 hours from hospital admission) or “early” CA and PCI (≤72 hours).
Methods
From September 1, 2006 to January 31, 2008, all patients with acute NSTEMI admitted to our hospital were screened for enrollment. Criteria for NSTEMI diagnosis were hospital admission for chest pain lasting >10 minutes associated with electrocardiographic (ECG) modification (ST‐segment downsloping ≥0.5 mm, or T‐wave inversion or ST‐segment elevation lasting <20 minutes in ≥2 contiguous ECG leads) and/or an elevation of creatine kinase myocardial band isoenzyme (CK‐MB) levels or troponin T (TnT) levels ≥2× the upper level of normal. Exclusion criteria were: (1) previous MI or previous coronary revascularization (percutaneous or surgical), (2) any relative or absolute contraindication to anticoagulant or antiplatelet therapy, (3) severe hemodynamic impairment or cardiogenic shock, (4) left bundle branch block or pacemaker rhythm, (5) atrial fibrillation, (6) creatinine clearance <30 mL/minute, (7) cancer, (8) inability to provide informed consent. Out of 315 screened patients, 54 fulfilled the inclusion and exclusion criteria of the study and were randomized according to a computer‐generated random sequence: 27 patients (group A) underwent immediate (≤6 hours after hospital admission) CA and PCI with a double bolus of eptifibatide administered in the catheterization laboratory, and 27 patients (group B) underwent early (≤72 hours after hospital admission) CA and PCI with upstream single bolus of eptifibatide, started at hospital admission and followed by infusion.
All patients were treated according to standard guidelines with aspirin (500 mg of chewable preparation as a loading dose, followed by 100 mg/day), clopidogrel (300 mg as a loading dose and then 75 mg/day), unfractionated heparin (5000 U as a loading dose and then 1000 U/kg/hour with a partial thromboplastin time in the range of 50–70 seconds). In group A, eptifibatide was administered in the catheterization laboratory as a double bolus (180 μg/kg 10 minutes apart) followed by an infusion of 2.0 μg/kg/minute for 18 hours after the procedure. In group B, eptifibatide was administered at admission as a single bolus (180 μg/kg) followed by an infusion of 2.0 μg/kg/minute until 18 hours after the percutaneous revascularization procedure. In all patients, CA and PCI were performed at the same time through the transradial approach.
In all patients, blood samples were obtained at admission and 6, 12, 24, 48, and 72 hours to measure CK‐MB mass and TnT.
The endpoint of the study was to evaluate the effects of these 2 reperfusion strategies on the microvascular damage and myocardial perfusion detected, respectively, by myocardial contrast echocardiography (MCE) and myocardial blush grade (MBG), and infarct size detected by myocardial enzyme levels.
All patients underwent transthoracic echocardiography at predischarge (T1) and at 12 months' follow‐up (T2). Regional wall motion was semiquantitatively scored according to the recommendations of the American Society of Echocardiography using a 17‐segment model (1 = normal, 2 = hypokinesia, 3 = akinesia, 4 = dyskinesia). Regional wall motion score index (RWMSI) was calculated for each examination by dividing the total wall motion score of dysfunctional segments by the number of dysfunctional analyzed segments. The percent of wall‐motion abnormalities (WMA %), as an index of regional left ventricular (LV) dysfunction, was obtained by dividing the number of dysfunctional segments by the total number of evaluated segments. LV end‐diastolic (LVEDV) and LV end‐systolic (LVESV) volumes were calculated from 4‐ and 2‐chamber views utilizing the modified Simpson biplane method.
Microvascular perfusion was assessed by real‐time MCE using continuous infusion of SonoVue (Bracco Imaging, Milan, Italy). MCE studies were performed in real‐time harmonic power Doppler using a SONOS 5500 ultrasound system (Philips Healthcare, the Netherlands). Contrast images were acquired in apical 4‐chamber, 2‐chamber, and long axis view. Poor or no opacification was defined as delayed, low, or absent contrast enhancement in the evaluated segment when compared with adjacent segments with adequate opacification. Quantitative analysis was performed on MCE images at T1 using Qontrast software (Bracco Imaging) as previously described.8 The following formula was used to assess the relative CDL %: (total residual CDL after reperfusion)/(total length of endocardial border) ×100.
All echocardiographic measurements were performed by 2 experienced physicians (M.M. and L.A.) blinded to the randomization, and disagreement was resolved by consensus. Myocardial blush grade was calculated by a single cardiologist (M.D.V.) who was blinded to the patients' randomization. According to previous studies,9 MBG was graded from 0 to 3. The study was approved by the Institutional Ethical Committee and written informed consent was obtained from all participants.
Statistical Analysis
Continuous variables for each of the 2 subject groups were reported as mean and SD unless otherwise noted and were compared using the Student t test or the Mann‐Whitney U test, where appropriate. Categorical variables were indicated as the absolute number and percentage and were compared by Pearson's χ 2 test, or, if the number expected of patients was <5, then with the Fisher exact test. A 2‐tailed P value ≤0.05 was considered statistically significant. The area under the curve of myocardial‐specific enzymatic release was calculated using the linear trapezoidal rule. SPSS software version 11.0 (SPSS, Inc., Chicago, IL) was used for all analyses.
Results
Baseline Characteristics
There were no significant differences in major risk factors between groups (Table 1). According to the protocol, all patients were treated with aspirin and clopidogrel at admission. The median time from admission to CA was significantly shorter in group A compared with group B: 5 hours (range, 1–6 hours) vs 24 hours (range, 8–48 hours), respectively (P < 0.0001). The majority of patients (63%) had single‐vessel disease with 33% of anterior MI in each group. The cumulative median length of eptifibatide infusion was significantly shorter in group A compared with group B (18 hours vs 42 hours, respectively; P < 0.0001).
Table 1.
Clinical Characteristics of Patients
| Characteristic | Immediate PCI (n = 27) | Early PCI (n = 27) | P Value |
|---|---|---|---|
| Demographics | |||
| Age, y | 58.8 ± 9.4 | 59.7 ± 9.8 | 0.72 |
| M, n (%) | 22 (81.5) | 24 (88.9) | 0.44 |
| Height (cm) | 169.7 ± 6.3 | 171.4 ± 7.5 | 0.38 |
| Weight (kg) | 79.6 ± 12.6 | 81.1 ± 13.3 | 0.66 |
| BMI (kg/m2) | 27.6 ± 3.9 | 27.5 ± 3.3 | 0.92 |
| Medical history, n (%) | |||
| DM | 7 (26) | 5 (18.5) | 0.51 |
| HT | 13 (48.2) | 18 (66.7) | 0.17 |
| Current smoker | 16 (59.3) | 12 (44.4) | 0.28 |
| Dyslipidemia | 14 (51.9) | 15 (55.6) | 0.78 |
| Clinical features | |||
| HR at admission (beats/min) | 73.1 ± 18 | 74.3 ± 16 | 0.80 |
| Systolic BP (mm Hg) | 146 ± 21 | 135 ± 26 | 0.11 |
| Diastolic BP (mm Hg) | 80.6 ± 13 | 83.7 ± 16 | 0.42 |
| Total cholesterol (mg/dL) | 201 ± 39 | 192 ± 33 | 0.37 |
| LDL‐C (mg/dL) | 123 ± 37 | 119 ± 32 | 0.66 |
| HDL‐C (mg/dL) | 42.6 ± 9 | 43.6 ± 12 | 0.73 |
| TG (mg/dL) | 179 ± 128 | 150 ± 67 | 0.31 |
| Cr (mg/dL) | 0.86 ± 0.2 | 0.91 ± 0.2 | 0.38 |
| HG (g/dL) | 14.1 ± 1.5 | 14.5 ± 1.6 | 0.34 |
| CRP (mg/L)a | 7.2 (0.4, 68) | 3.65 (0.6, 49) | 0.32 |
Abbreviations: BMI, body mass index; BP, blood pressure; Cr, creatinine; CRP, C‐reactive protein; DM, diabetes mellitus; HDL‐C, high‐density lipoprotein cholesterol; HG, hemoglobin; HR, heart rate; HT, hypertension; LDL‐C, low‐density lipoprotein cholesterol; M, male; PCI, percutaneous coronary intervention; TG, triglycerides.
Data expressed as median (minimum, maximum).
Procedural Results
All procedures were performed by transradial approach. All patients underwent PCI at the end of CA without differences in the number of total stent or drug‐eluting stents implanted (Table 2). There were no significant differences in pre‐PCI MBG between groups (Figure 1), with 11 patients in group A and 10 patients in group B presenting at MBG 0 or 1 and 16 patients in group A and 17 patients in group B with MBG 2 or 3 (P = 0.78). After PCI there was a significant increase of MBG 2 or 3 in both groups (P = 0.003), with <10% of patients in each group with MBG 0 or 1.
Table 2.
Angiographic and Enzymatic Results
| Immediate PCI (n = 27) | Early PCI (n = 27) | P Value | |
|---|---|---|---|
| Angiographic pattern | |||
| Single‐vessel disease, n (%) | 17 (63) | 17 (63) | 1.00 |
| 2‐vessel disease, n (%) | 9 (33) | 8 (30) | 0.77 |
| 3‐vessel disease, n (%) | 1 (4) | 2 (7) | 0.55 |
| PCI with DES n (%) | 21 (78) | 16 (59) | 0.14 |
| Stent‐patient ratio | 1.7 ± 1 | 1.5 ± 1.2 | 0.52 |
| DES‐patient ratio | 1.3 ± 1.2 | 0.93 ± 1 | 0.24 |
| Transradial approach, n (%) | 27 (100) | 27 (100) | 1.00 |
| Culprit vessel | |||
| LAD, n (%) | 9 (33) | 9 (33) | 1.00 |
| Circumflex, n (%) | 11 (41) | 12 (45) | 0.78 |
| RCA, n (%) | 7 (26) | 6 (22) | 0.75 |
| Myocardial enzymes | |||
| Peak CK‐MB (ng/mL) | 26 ± 26 | 69 ± 79 | 0.01 |
| Peak TnT (ng/mL) | 0.8 ± 1.2 | 1.8 ± 2.1 | 0.048 |
| AUC CK‐MB (ng/mL/h)a | 436 (250, 918) | 985.7 (589, 1421) | 0.01 |
| AUC TnT (ng/mL/h)a | 14.5 (4, 58) | 41.4 (14, 95) | 0.05 |
| CK‐MB peak within 6 h, n (%) | 19 (70.3) | 11 (40.7) | 0.03 |
| TnT peak within 6 h, n (%) | 14 (51.9) | 6 (22.2) | 0.02 |
Abbreviations: AUC, area under the curve; CK‐MB, creatine kinase myocardial band isoenzyme; DES, drug‐eluting stent; IQR, interquartile range; LAD, left anterior descending artery; PCI, percutaneous coronary intervention; RCA, right coronary artery; TnT, troponin T.
Data expressed as median and interquartile range.
Figure 1.
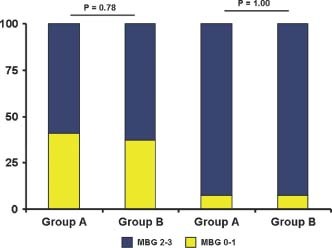
Myocardial blush grade before and after PCI. There were no significant differences between groups either at baseline or postprocedure. Abbreviations: MBG, myocardial blush grade; PCI, percutaneous coronary intervention.
During hospitalization, group B showed significantly higher levels of CK‐MB peak (P = 0.01) and TnT peak (P = 0.048; Figure 2). Moreover, the area under curve (AUC) of myocardial enzyme levels during hospitalization showed significantly higher levels of CK‐MB (P = 0.01) and TnT (P = 0.05) in group B compared with group A (Table 2). A rapid (≤6 hours) peak of myocardial enzyme release was observed more frequently in group A patients (Table 2).
Figure 2.
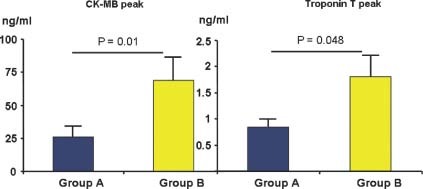
CK‐MB and TnT peak during hospitalization. Group B showed significantly higher levels of myocardial enzymes compared with group A. Results are expressed as mean ± SE. Abbreviations: CK‐MB, creatine kinase myocardial band isoenzyme; TnT, troponin T.
At predischarge echocardiography, most patients showed a normal left ventricular ejection fraction (LVEF), with a small dysfunctional area in group A (WMA 11% in group A vs 12% in group B, P = 0.79). The MCE showed a detectable impairment in myocardial perfusion only in 15% of patients without differences in the CDL between the 2 groups (4.5% in group A and 2.8% in group B, P = 0.56; Table 3).
Table 3.
Echocardiographic Parameters
| Immediate PCI (n = 27) | Early PCI (n = 27) | P Value | |
|---|---|---|---|
| In‐hospital | |||
| LVEDV (mL) | 138 ± 32 | 130 ± 30 | 0.44 |
| LVESV (mL) | 62 ± 18 | 57 ± 15 | 0.31 |
| LVEF (%) | 54 ± 6 | 55 ± 6 | 0.84 |
| RWMSI | 1.3 ± 1.5 | 1.4 ± 1.5 | 0.97 |
| WMA (%) | 11.2 ± 14.1 | 12.1 ± 15.1 | 0.79 |
| CDL (%) | 4.5 ± 9.8 | 2.8 ± 8.4 | 0.56 |
| 1‐year follow‐up | |||
| LVEDV (mL) | 138 ± 32 | 129 ± 30 | 0.43 |
| LVESV (mL) | 61 ± 17 | 55 ± 15 | 0.29 |
| LVEF (%) | 55 ± 7 | 56 ± 5 | 0.75 |
Abbreviations: CDL, contrast defect length; LVEDV, left ventricular end‐diastolic volume; LVEF, left ventricular ejection fraction; LVESV, left ventricular end‐systolic volume; RWMSI, regional wall motion score index; WMA, wall‐motion abnormalities.
Data expressed as mean ± standard deviation.
There were no cases of in‐hospital bleeding (Thrombolysis in Myocardial Infarction major or minor), severe thrombocytopenia, or major adverse cardiovascular events (death, reinfarction, target vessel revascularization).
1‐Year Follow‐Up
At 1 year follow‐up, no cardiac deaths nor stent thrombosis occurred. No patient in group A and 1 patient in group B underwent target vessel revascularization (P = 0.31). Main echocardiographic parameters such as LVEDV, LVESV, and LVEF were comparable (Table 3).
Discussion
The main finding of this study is that in patients with NSTEMI, a strategy of immediate CA and PCI in combination with eptifibatide led to lower in‐hospital myocardial enzyme increase compared with an early invasive strategy, despite similar myocardial perfusion.
The results of this randomized study are consistent with previous nonrandomized and randomized observations. In the Superior Yield of the New Strategy of Enoxaparin, Revascularization and Glycoprotein IIb/IIIa Inhibitors (SYNERGY) trial,10 lower event rates were observed in early invasively treated patients, with the lowest event rate in patients treated ≤6 hours from admission. Moreover, in the Can Rapid Risk Stratification of Unstable Angina Patients Suppress Adverse Outcomes with Early Implementation of the ACC/AHA Guidelines (CRUSADE) registry,11 very early intervention was associated with a trend toward a survival benefit. Finally, in a recent multicenter trial,12 an early (≤24 hours) invasive strategy in NSTEMI patients showed advantage over a delayed invasive strategy, especially in high‐risk patients. Differently, 2 previous randomized studies (Early or Late Intervention in Unstable Angina [ELISA] and Angioplasty to Blunt the Rise of Troponin in Acute Coronary Syndromes Randomized for an Immediate or Delayed Intervention [ABOARD]) showed no advantage of an immediate compared to a deferred strategy of intervention in non‐ST‐elevation ACS in terms of myocardial enzymatic release. However, in the ELISA trial,13 only 8% of the patients in the early group has been treated with GP IIb/IIIa inhibitors, and in the ABOARD trial,14 most of the patients in the deferred intervention were treated very early (≤24 hours from admission).
The benefit of a fast invasive treatment may be linked to the high prevalence of basal impaired myocardial perfusion in NSTEMI patients, even with upstream use of GP IIb/IIIa inhibitors.15 An immediate PCI aimed to restore a normal coronary flow may reduce the ischemic time and reduce the MI size. In this hypothesis, our study was designed to test the efficacy of GP IIb/IIIa inhibitor therapy during PCI combined with the benefit of a rapid restoration of a normal coronary flow, limiting the risk of bleeding complications associated with prolonged GP IIb/IIIa inhibitor infusion. In the immediate revascularization group, we observed lower in‐hospital myocardial enzyme increases. This result could be of value because previous studies16, 17 showed a significant correlation between CK‐MB levels and the outcome, even for low levels of myocardial enzyme increase. In our study we could not show differences in terms of myocardial perfusion defects between the 2 strategies. The reason may be linked to the small extension of the infarct area in our patients, with the majority of patients with normal LVEF and most patients with single‐vessel disease. Moreover, all patients were treated with optimal antiplatelet therapy (aspirin, clopidogrel, and GP IIb/IIIa inhibitors). However, despite similar myocardial perfusion, the higher levels of myocardial enzymes in group B may indicate a greater extent of cellular damage despite a preserved microvascular network.
There were no cases of major or minor bleeding in the 2 groups, probably because all CA and PCI were performed through the transradial approach, which is known to significantly reduce hemorrhagic complications.18
An important limitation of our study is the small number of patients enrolled. However, this was a pilot study aimed to test the feasibility of an immediate invasive approach for the treatment of patients with NSTEMI. Another limitation is the exclusion from the study of high‐risk patients, who represent the group of patients that could obtain the greatest benefit from an immediate invasive approach.
Conclusion
Our study suggests that, in patients with acute NSTEMI treated with eptifibatide, a strategy aimed to reduce the time from admission to PCI may play a role in reducing the extent of infarct size but has no effect on myocardial perfusion. The clinical impact of these results should be evaluated in large randomized trials with clinical endpoints.
References
- 1. Bavry AA, Kumbhani DJ, Rassi AN, et al. Benefit of early invasive therapy in acute coronary syndromes: a meta‐analysis of contemporary randomized clinical trials. J Am Coll Cardiol. 2006;48:1319–1325. [DOI] [PubMed] [Google Scholar]
- 2. Bassand JP, Hamm CW, Ardissino D, et al. Guidelines for the diagnosis and treatment of non‐ST‐segment acute coronary syndromes. Eur Heart J. 2007;28:1598–1660. [DOI] [PubMed] [Google Scholar]
- 3. Anderson JL, Adams CD, Antman EM, et al. ACC/AHA 2007 guidelines for the management of patients with unstable angina/non‐ST‐elevation myocardial infarction: executive summary: a report of the American College of Cardiology/American Heart Association Task Force on Practice Guidelines. Circulation. 2007;116:803–877. [Google Scholar]
- 4. Zhao XQ, Théroux P, Snapinn SM, et al. Intracoronary thrombus and platelet glycoprotein IIb/IIIa receptor blockade with tirofiban in unstable angina or non‐Q‐wave myocardial infarction: angiographic results from the PRISM‐PLUS trial. Circulation. 1999;100:1609–1615. [DOI] [PubMed] [Google Scholar]
- 5. Van den Brand M, Laarman GJ, Steg PG, et al. Assessment of coronary angiograms prior to and after treatment with abciximab, and the outcome of angioplasty in refractory unstable angina patients: angiographic results from the CAPTURE trial. Eur Heart J. 1999;20:1572–1578. [DOI] [PubMed] [Google Scholar]
- 6. Bolognese L, Falsini G, Liistro F, et al. Randomized comparison of upstream tirofiban versus downstream high bolus dose tirofiban or abciximab on tissue‐level perfusion and troponin release in high‐risk acute coronary syndromes treated with percutaneous coronary interventions. J Am Coll Cardiol. 2006;47:522–528. [DOI] [PubMed] [Google Scholar]
- 7. Neumann FJ, Kastrati A, Pogatsa‐Murray G, et al. Evaluation of prolonged antithrombotic pre‐treatment (“cooling‐off” strategy) before intervention in patients with unstable coronary syndromes. JAMA. 2003;290:1593–1599. [DOI] [PubMed] [Google Scholar]
- 8. Funaro S, La Torre G, Madonna M, et al. Incidence, determinants, and prognostic value of reverse left ventricular remodelling after primary percutaneous coronary intervention: results of the Acute Myocardial Infarction Contrast Imaging multicenter study. Eur Heart J. 2009;30:566–575. [DOI] [PMC free article] [PubMed] [Google Scholar]
- 9. Van't Hof AW, Liem A, Suryapranata H, et al. Angiographic assessment of myocardial reperfusion in patients treated with primary angioplasty for acute myocardial infarction. Circulation. 1998;97:2302–2306. [DOI] [PubMed] [Google Scholar]
- 10. Tricoci P, Lockhnygina Y, Berdan LG, et al. Time to coronary angiography and outcomes among patients with high‐risk non ST‐segment elevation acute coronary syndromes: results from the SYNERGY trial. Circulation. 2007;116; 2669–2677. [DOI] [PubMed] [Google Scholar]
- 11. Ryan JW, Peterson ED, Chen AY, et al. Optimal timing of intervention in non‐ST‐segment elevation acute coronary syndromes: insights from the CRUSADE (Can Rapid Risk Stratification of Unstable Angina Patients Suppress Adverse Outcomes With Early Implementation of the ACC/AHA guidelines) Registry. Circulation. 2005;112:3049–3057. [DOI] [PubMed] [Google Scholar]
- 12. Mehta SR, Granger CB, Boden WE, et al; TIMACS Investigators . Early versus delayed invasive intervention in acute coronary syndromes. N Engl J Med. 2009;360:2165–2175. [DOI] [PubMed] [Google Scholar]
- 13. Van't Hof AW, de Vries ST, Dambrink JH, et al. A comparison of two invasive strategies in patients with non‐ST elevation acute coronary syndromes: results of the Early or Late Intervention in Unstable Angina (ELISA) pilot study. Eur Heart J. 2003;24: 1401–1405. [DOI] [PubMed] [Google Scholar]
- 14. Montalescot G, Cayla G, Collet JP, et al. Immediate vs delayed intervention for acute coronary syndromes. JAMA. 2009;302: 947–954. [DOI] [PubMed] [Google Scholar]
- 15. Gibson CM, Singh KP, Murphy SA, et al; TIMI Study Group . Association between duration of tirofiban therapy before percutaneous intervention and tissue level perfusion (a TACTICS‐TIMI 18 substudy). Am J Cardiol. 2004;94:492–494. [DOI] [PubMed] [Google Scholar]
- 16. Alexander JH, Sparapani RA, Mahaffey KW, et al. Association between minor elevations of creatine kinase‐MB level and mortality in patients with acute coronary syndromes without ST‐segment elevation. JAMA. 2000;283:347–353. [DOI] [PubMed] [Google Scholar]
- 17. Cavallini C, Savonitto S, Violini R, et al. Impact of the elevation of biochemical markers of myocardial damage on long‐term mortality after percutaneous coronary intervention: results of the CK‐MB and PCI study. Eur Heart J. 2005;26:1494–1498. [DOI] [PubMed] [Google Scholar]
- 18. Sciahbasi A, Fischetti D, Picciolo A, et al. Transradial access compared with femoral puncture closure devices in percutaneous coronary procedures. Int J Cardiol. 2009;137:199–205. [DOI] [PubMed] [Google Scholar]