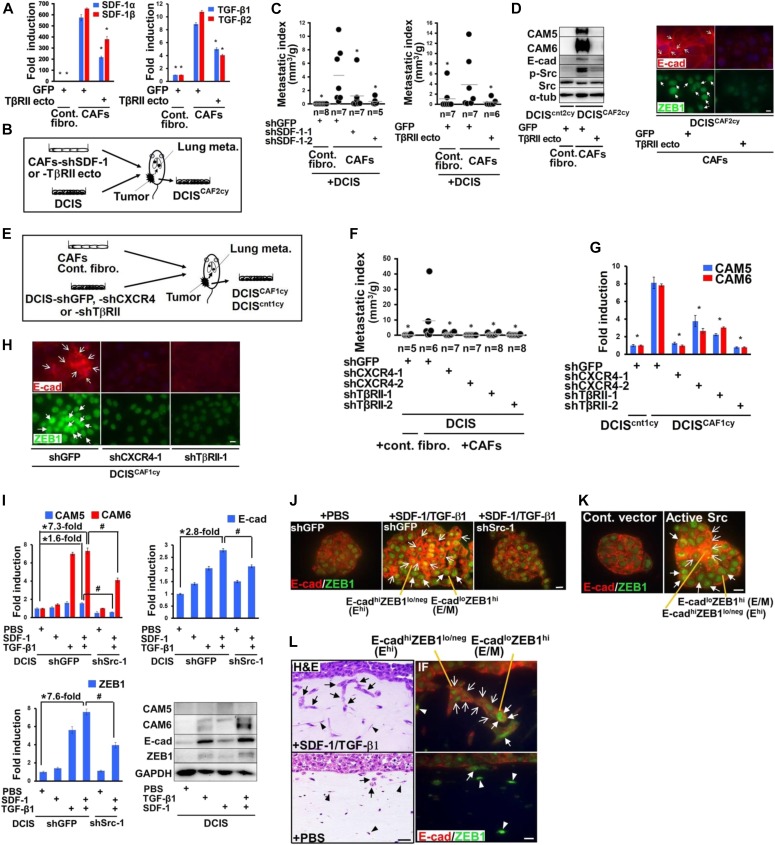
Figure 7. Stromal SDF-1 and TGF-β mediate the formation of invasive and metastatic breast tumor clusters with Ehi and E/M states via Src activation.
(A) Real-time PCR of control fibroblasts and CAFs expressing GFP or TβRII ecto using the indicated primers. (B) Schematic illustration of a subcutaneous co-implantation tumor xenograft model (for Fig 7C and D). See text in detail. (C) The lung metastatic indices are measured at 60 d after subcutaneous injection of the indicated cells. (D) Immunoblotting of DCIScnt2cy and DCISCAF2cy using the indicated antibodies (left). The DCIScnt2cy and DCISCAF2cy were extracted from tumors generated by DCIS cells admixed with control fibroblasts (expressing GFP) and CAFs (expressing GFP or TβRII ecto), respectively. Immunostaining of the indicated cells using anti–E-cad and anti-ZEB1 antibodies (right). E-cad+ cancer cells (simple arrows) and nuclear ZEB1+ cancer cells (triangular arrows) are shown. (E) Schematic illustration of a subcutaneous co-implantation tumor xenograft model (for Fig 7F–H). See text for details. (F) The lung metastatic indices evaluated at 60 d after subcutaneous injection of the described cells into mice. (G) Real-time PCR of DCIScnt1cy or DCISCAF1cy measuring the indicated gene expressions. The DCIScnt1cy and DCISCAF1cy were extracted from 30-d-old tumor xenografts generated by DCIS cells expressing the indicated shRNA admixed with control fibroblasts and CAFs, respectively. (H) Immunostaining of the described cells using the indicated antibodies. E-cad+ cancer cells (simple arrows) and nuclear ZEB1+ cancer cells (triangular arrows) are shown. (I) Real-time PCR of DCIS cells expressing the indicated shRNA, treated with PBS, SDF-1 (100 ng/ml), and/or TGF-β1 (10 ng/ml) for 24 h, to measure the described gene expressions. Immunoblotting of DCIS cells treated with PBS, SDF-1, and/or TGF-β1 for 48 h using the indicated antibodies (right-bottom). (J) Immunofluorescence of DCIS organoids expressing the indicated shRNAs treated with PBS or both SDF-1 (100 ng/ml) and TGF-β1 (10 ng/ml) using anti–E-cad and anti-ZEB1 antibodies. The Ehi (simple arrow) and E/M (triangular arrow) cancer cells are also shown. (K) Immunofluorescence of DCIS organoids expressing the control empty vector (Cont. vector) or the constitutively active Src mutant (Active Src) using the indicated antibodies. The Ehi (simple arrow) and E/M (triangular arrow) cancer cells are shown. (L) Organotypic invasion assay using DCIS cells treated with PBS or both SDF-1 (100 ng/ml) and TGF-β1 (10 ng/ml). Invading tumor cell clusters (arrows) and mammary fibroblasts (arrowheads) embedded in the gel with H&E staining (left) and immunofluorescence (IF) using anti–E-cad and anti-ZEB1 antibodies (right) are shown. The Ehi (simple arrow) and E/M (triangular arrow) cancer cells, and nuclear ZEB1+ stromal cells (arrowheads) are shown (right). Data information: Asterisk indicates a significant difference relative to GFP-expressing CAFs (A and C-right), GFP-shRNA–expressing CAFs (C-left), and GFP-shRNA–expressing DCIS cells (F) and DCISCAF1cy (G). Asterisk and # symbol also indicate a significant difference between the indicated lines (I). t test (A, G, I) and Mann–Whitney U test (C, F). Error bars, SE. The horizontal line represents the mean value (C, F). Scale bars, 30 μm (L-H&E) and 10 μm (others). See also Fig S6.
Source data are available for this figure.

