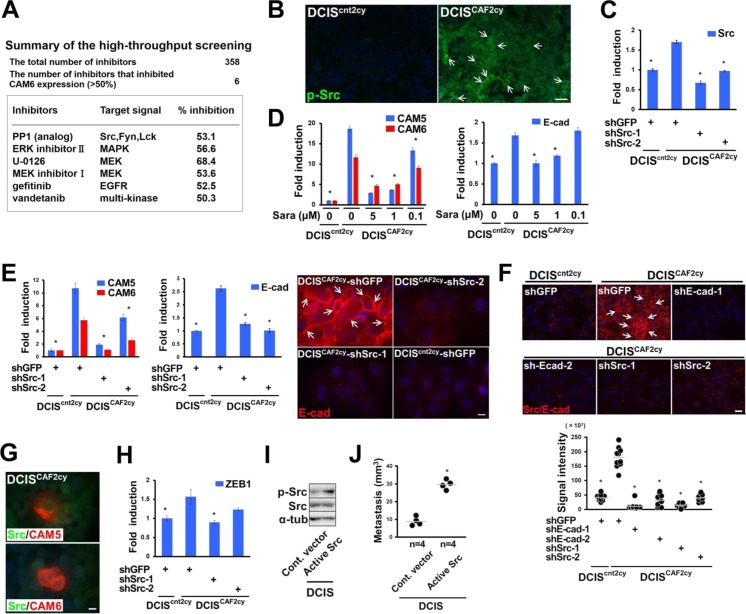
Figure S5. Related to Fig 6. Src activation mediates the Ehi and E/M states and metastatic ability in DCISCAF2cy.
(A) Summary of high-throughput screening identifying six compounds that significantly (50%) inhibited CAM6 mRNA expression in DCISCAF2cy. (B) Immunostaining of frozen sections prepared from the indicated tumors using an antiphosphorylated Src (p-Src, Tyr 416) antibody. p-Src+ cancer cells (simple arrows) are shown. (C) Real-time PCR of DCIScnt2cy and DCISCAF2cy expressing the indicated shRNA using primers specific for the Src gene. (D) Real-time PCR of the indicated cells treated with or without saracatinib (Sara) for 24 h measuring CAM5, CAM6, and E-cad expressions. (E) Real-time PCR of DCIScnt2cy and DCISCAF2cy expressing the indicated shRNA using primers specific for CAM5, CAM6, and E-cad genes. Immunofluorescence of the indicated cells using anti–E-cad antibody (right). E-cad+ cancer cells (simple arrows) are also shown. (F) In situ PLA of DCIScnt2cy and DCISCAF2cy expressing the indicated shRNA using anti-Src and anti–E-cad antibodies. The signal (arrow) detected by in situ PLA is indicated (upper) and the signal intensity is also evaluated in the above-described cells (lower). (G) Immunofluorescence of DCISCAF2cy using the indicated antibodies. (H) Real-time PCR of the indicated cells measuring ZEB1 expression. (I) Immunoblotting of DCIS cells expressing the control empty vector (Cont. vector) or constitutively active Src mutant (Active Src) using the indicated antibodies. (J) Measurement of nodule volume in the lungs at 30 d after intravenous injection of the indicated cells into mice. Data information: Asterisk indicates a significant difference relative to DCISCAF2cy expressing GFP-shRNA (C, E, F, H), DCISCAF2cy treated without saracatinib (D), and DCIS cells expressing the control vector (J). t test (C–E, H) and Mann–Whitney U test (F, J). Error bars, SE. The horizontal line represents the mean value (F, J). Scale bars, 30 μm (B, F), 10 μm (E, G).
Source data are available for this figure.

