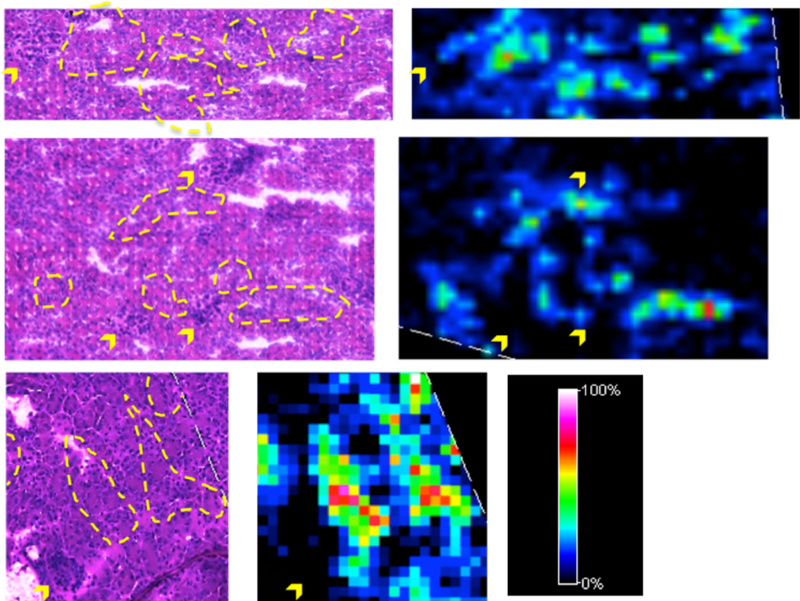
Fig. 4.

Examples of MALDI IMS images of m/z 888.6224 in the kidneys of 28-day old Alport mice recorded at 15 μm spatial resolution. The relative abundance of MS signals is indicated by a heat map. Tissue was stained using a PAS stain, after MS analysis and matrix removal. Areas corresponding to high MS signal are marked by a yellow dashed line in the stained tissue and the locations of glomeruli are indicated with yellow arrows. The raster pattern of the laser is apparent in the small arrays of damaged tissue. The signal appears to be colocalized to tubules and absent in glomeruli.
