

Summary:
Microglia, the resident immune cells of the brain, rapidly change states in response to their environment, but we lack molecular and functional signatures of different microglial populations. Here, we analyzed the RNA expression patterns of more than 76,000 individual microglia in mice during development, old age and after brain injury. Our analysis uncovered at least nine transcriptionally distinct microglial states, which expressed unique sets of genes and were localized in the brain using specific markers. The greatest microglial heterogeneity was found at young ages; however, several states – including chemokine-enriched inflammatory microglia – persisted throughout the lifespan or increased in the aged brain. Multiple reactive microglial subtypes were also found following demyelinating injury in mice, at least one of which was also found in human multiple sclerosis lesions. These distinct microglia signatures can be used to better understand microglia function and to identify and manipulate specific subpopulations in health and disease.
ETOC Blurb
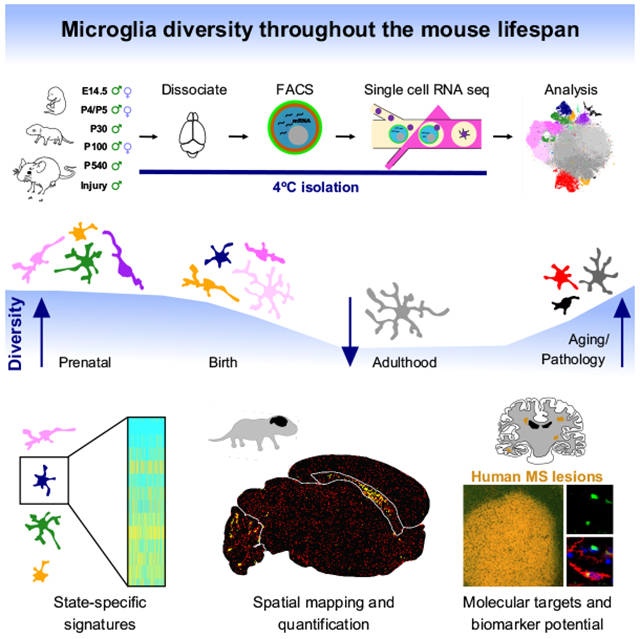
Hammond et. al redefine mouse microglia states using single-cell RNA seq and in situ brain mapping. They find that microglia are most diverse in the developing, aged, and injured brain. Using focal demyelination, they show that microglia activation states are transcriptionally and spatially distinct within the lesion environment.
Graphical Abstract
Introduction:
Microglia are the resident macrophages of the brain, comprising 10% of brain cells. Not only are microglia active in injury and disease, but they also play critical roles in brain maintenance and development. Microglia, derived from myeloid progenitors in the yolk sac, first arrive in the brain around embryonic day 9 (E9.5) in mice (Ginhoux et al., 2010). Signals in the brain environment shape their maturation by driving broad changes in gene transcription, morphology, and cell number (Butovsky et al., 2014; Gosselin et al., 2014; Lavin et al., 2014). During this time, microglia also guide neural development, in part by responding to local changes in the brain microenvironment and by interacting with developing neurons. Many of these functional interactions are spatially and temporally controlled and include phagocytosing apoptotic cells, pruning synapses, modulating neurogenesis, and regulating synapse plasticity and myelin formation (Schafer and Stevens, 2015). These distinct functions are often accompanied by regional differences in microglia distribution and morphology, which change as the brain matures. These observations invite the question of whether specialized subpopulations of microglia exist within the brain to carry out these critical, diverse tasks.
In addition to their roles in development, microglia are essential for maintaining the health and function of the brain, as genetic lesions in microglia caused by loss of function mutations in triggering receptor expressed on myeloid cells 2 (Trem2) and colony stimulating factor 1 receptor (Csf1r) can cause neurodegenerative disease and leukodystrophies, respectively (Paloneva et al., 2000; Rademakers et al., 2011). Moreover, as immune cells, microglia quickly respond to disruptions caused by injury, pathology, or aging (Salter and Stevens, 2017). These responses, often-termed ‘activation’, are defined as any physical or biochemical changes away from the microglial homeostatic state and include rapid proliferation, migration to the site of pathology, phagocytosis of cells and debris, and production of the cytokines and chemokines necessary to stimulate microglia and other brain and immune cells.
Despite the morphological diversity present among microglia in development, health, injury, and disease, microglia have historically been characterized as ‘resting’, ‘M1’ (proinflammatory), or ‘M2’ (anti-inflammatory) - based on simple in vitro stimulation methods. Though tools to identify and manipulate microglia in specific contexts are greatly needed (Ransohoff, 2016), a currently simplistic classification scheme may complicate this by lumping together heterogenous sets of microglia. Identifying and molecularly describing these distinct groups of microglia would help us determine whether microglia assume different profiles based on the type of injury or disease and, in particular, how these states relate to brain development.
Recent high-throughput approaches for single-cell RNA-seq now allow detailed examination of cell state changes and diversity that are reflective of those in vivo (Macosko et al., 2015).
In this study, we sought to identify the populations of microglia present from embryogenesis to old age and following a local demyelinating injury. We performed high-throughput single-cell transcriptomics of 76,149 mouse microglia and detected many distinct microglial subpopulations with unique molecular signatures that changed over the course of development or in response to injury. We found that microglia were most diverse during early development and became less heterogenous in adulthood, until perturbed by injury or aging and identified distinct microglial states. The detailed molecular signatures identified in our study will lead to a better understanding of the function, signaling, and interaction of distinct microglial subtypes with other brain cells and will facilitate the identification of specific markers that can be used to detect and manipulate microglial states in human health and disease.
Results:
Isolation of microglia to minimize ex vivo activation
In early development, microglia assume a variety of different morphologies and are distributed unevenly in the brain (Karperien et al., 2013). They congregate in specific areas, including the ventricular zone and around growing axon tracts, and not in other areas, like the developing cortex (Squarzoni et al., 2014), suggesting that transcriptionally and functionally different subpopulations of microglia exist. To ask whether microglia are heterogenous during these early time points and to define microglial state changes over time, we isolated whole brains from mice at embryonic day 14.5 (E14.5), early postnatal day 4/5 (P4/P5), the late juvenile stage (P30), adulthood (P100), and old age (P540) (Fig 1a). To compare healthy development to pathology, microglia were also collected from the white matter of adult mice exposed to a focal demyelinating injury caused by lysolecithin (LPC) injection (Hall, 1972).
Figure 1. Molecularly distinct subpopulations of microglia peak in number during early development, expand in aging, and emerge following injury. See also Figures S1 and S2.

(a) Microglia were isolated from the whole brains of mice from E14.5 until P540 and from focal demyelinated white matter lesions (Injury). Microglia were isolated under cold conditions to limit ex vivo activation. FACS purified, and single cell sequenced.
(b) tSNE plot of 76,149 cells. In total, nine microglia clusters and one monocyte/macrophage (Mono/Mac)-containing cluster were identified. N=41 mice.
(c) tSNE plots of cells from each age and condition. Only male samples were plotted.
(d) Heatmap of the normalized percent of cells from each sample assigned to each cluster. Blue squares = increase in cells for a given age/condition (P<0.0001). Two-way ANOVA with Tukey’s post-hoc analysis.
(e) tSNE plot colored for expression (log-transformed UMI counts per 10,000 transcripts) of canonical microglial genes.
(f) tSNE plot of expression for genes specifically upregulated in each of the microglial clusters.
(g) tSNE plot of expression for genes specifically upregulated in the monocyte and macrophage cluster.
To minimize ex vivo activation and transcriptional activity during the isolation procedure, we generated single-cell suspensions under consistently cold conditions (Fig 1a). Following perfusion, brains were minced and Dounce homogenized; older samples (≥P30) were subjected to Percoll gradient centrifugation to remove debris and myelin. To ensure this step did not affect our recovery of microglial subpopulations, we Percoll purified microglia at P5, when we see considerable microglial diversity, and compared these microglia to those isolated without Percoll – finding no change in the subpopulations present and only a slight shift in the relative percentages of microglia in one of the nine clusters (Fig S1). Microglia were then FACS-purified (Fig S2). An increased number of CD45high cells were found at younger ages and likely represented brain border macrophages or circulating blood monocytes from the non-perfused embryos (Fig S2). We utilized a droplet-based RNA-seq approach (Fig 1a) (Zheng et al., 2017) and at least three to four biological replicates per age were collected for a total of 76,149 sequenced microglia from 41 total animals (Fig 1b). Cells were sequenced to comparable sequencing depths (~40,000–60,000 reads/cell), and had a similar median unique molecular identifier (UMI) count and median gene number in all ages and conditions (Fig S2a).
To identify transcriptionally distinct microglial subpopulations, we performed dimensionality reduction and clustering using an independent component analysis (ICA)–based approach that has been recently described (Saunders et al., 2018). A first round of clustering was used to identify, curate and remove from analysis contaminating cells (including neurons, endothelial cells, and other cell types) (Fig S2b,c), which despite FACS purification, constituted a substantial proportion of cells – particularly at younger ages, when neurons were found in our dataset. A small percentage (0-3%) of non-microglial monocytes and macrophage populations were also found (Cd45high cells) but were left in the clustering analysis to provide a point of reference for comparison with the various microglial states (Fig 1b,g, Mono/Mac cluster). For both rounds of analysis, independent components that captured batch or replicate effects were removed before clustering analysis (Fig S2d), as previously described (Saunders et al., 2018).
Distinct microglia subpopulations with unique transcriptional signatures peak in number during early development
Clustering analysis revealed nine unique microglial states across all ages and conditions, including injury (Fig 1b). Cluster sizes ranged from 0.2% of all microglia to as many as 24% of all microglia. Some clusters were dominated by microglia from specific ages, whereas others contained microglia from several ages, indicating that some microglial states are present across development while others are more transitional (Fig 1c,d). We found the greatest microglial diversity at the youngest ages (E14.5 and P5) and considerably less diversity in juveniles (P30) and adults (P100) (Fig 1d). Both aging and injury caused a redistribution of microglial states, including an increase in the percent of cells occupying Clusters 8 and 9, as compared to juveniles and adults (Fig 1d).
Gene expression analysis showed that the canonical microglial genes (Fcrls, P2ry12, Cx3cr1, Trem2, and C1qa) were highly expressed by most of the analyzed cells, but only three (C1qa, Fcrls, Trem2) were uniformly expressed in all clusters (Fig 1e), suggesting that existing tools and marker definitions may need to be updated. We found that P2ry12, Cx3cr1, and Tmem119 (not shown) transcripts were expressed at much lower levels or not at all in certain clusters of microglia from the developing brain (Clusters 3,4).
In addition to the highly expressed canonical genes, we also identified genes strongly upregulated in, if not completely unique to, specific microglial states (Fig 1f, Table S1). These unique gene expression patterns showed that each microglial state reflected a specific and definable transcriptional program, rather than a simple modulation of commonly expressed microglial genes. Uniquely expressed genes found predominantly at the youngest ages (E14.5 and P4/P5) included arginase 1 (Arg1, Cluster 1), ribonucleotide reductase M2 (Rrm2, Cluster 2a), ubiquitin-conjugating enzyme E2C (Ube2c, Cluster 2b), centromere protein A (Cenpa, Cluster 2c), fatty acid binding protein 5, epidermal (Fabp5, Cluster 3), osteopontin (Spp1, Cluster 4), heme oxygenase 1 (Hmox1, Cluster 5), and membrane-spanning 4-domains, subfamily A, member 7 (Ms4a7, Cluster 6). Juvenile (P30) and adult (P100) microglia were largely assigned to three central clusters (Cluster 7a-c) that were not defined by any unique genes (Fig 1b). One subpopulation that was highly concentrated in aged mice was defined by the gene chemokine (C-C motif) ligand 4 (Ccl4, Cluster 8). Cluster 8 cells were found at most ages, albeit in smaller numbers, with a developmental peak at P5. Cluster 8 formed two spatially distinct groups on the t-distributed stochastic neighbor embedding (tSNE) plot (Figure 1b), which could reflect differences in these cells as the brain ages. Cluster 9 was composed predominantly of microglia from the focal white matter injury and had increased expression of the gene interferon, alpha-inducible protein 27 like protein 2A (Ifi27l2a). Non-microglial macrophages and monocytes uniquely expressed the genes coagulation factor XIII, A1 subunit (F13a1, macrophage), histocompatibility 2, class II antigen A, alpha (H2-Aa, macrophage), chemokine (C-C motif) receptor 2 (Ccr2, monocyte), lymphatic vessel endothelial hyaluronan receptor 1 (Lyve1, macrophage), and macrophage galactose N-acetyl-galactosamine specific lectin 2 (Mgl2, macrophage), genes that were barely expressed, if at all, by microglia (Fig 1g).
Together, these data demonstrate that microglia exist in multiple definable states that change over the course of development, aging, and injury. Although further analysis will be needed to establish whether these states are transient or represent the terminal differentiation of different subsets of microglia, these data provide a comprehensive map of these changes and identify genes that define several of these specific microglial states.
A population of embryonic Ms4a-expressing microglia share a similar transcriptional profile with brain border macrophages
Microglia and brain border macrophages (which reside in the perivascular space, meninges, and choroid plexus) are derived from the same pool of yolk sac hematopoietic progenitors and migrate to the brain at the same time in development (Goldmann et al., 2016). It is not until microglia infiltrate the brain parenchyma and are exposed to brain-derived signals that they achieve their unique identity. However, it is still unclear when microglia diverge from their brain border neighbors and how quickly they differentiate. At E14.5, we identified a distinct subpopulation of microglia that uniquely express Ms4a7 and share a similar transcriptional profile with brain border macrophages (Fig 2, Cluster 6). In support of this notion, Cluster 6 microglia express increased transcriptsof both macrophage markers (Mrc1, Ccr1, Dab2) and those found in mature microglia (P2ry12, Fcrls, Serpine2 (Cluster 7b)), suggesting an intermediate state (Fig 2g). It is possible that Cluster 6 microglia downregulate these genes as they enter the brain, but this question will need closer investigation.
Figure 2. Identification of Ms4a7-expressing microglia in the embryonic brain that resemble brain border macrophages See also Figures S4 and S5.

(a) tSNE plot of Cluster 6 microglia and a table of the top nine upregulated genes in that cluster. Gray outlined genes are plotted in (c).
(b) Plot of the percent of cells per sample that were assigned to Cluster 6. ****P<0.0001. ANOVA with Tukey’s posthoc analysis.
(c) Plot of the proportion of normalized UMI counts per sample (summed cell counts) for cells assigned to each cluster for the top genes in Cluster 6. Sample order per cluster is listed in the inset.
(d) Representive image of masked microglia from high-throughput smFISH analysis in a E14.5 saggital brain section. Fcrls+ only, red or Fcrls+Ms4a7+, yellow. Hb=hindbrain, Mb=midbrain, Fb=forebrain, Nctx=neocortex.
(e) Quantification of the percent of Fcrls+ microglia that also expressed Ms4a7 from smFISH analysis. N= 3 mice . *P<0.05, Unpaired t-test.
(f) High-magnification confocal image of E14.5 brain section of the intermediate zone of the telencephalon stained by smFISH with probes Fcrls, C1qa and, Ms4a7. Scale bar = 20 μm.
(g) Heatmap of gene expression from 4,895 cells in the Mono/Mac cluster, Cluster 6, and a subset of 1500 mature/homeostatic microglia from Cluster 7b. Z-score represents the number of standard deviations from the mean following row scaling.
In addition to Ms4a7, Cluster 6 microglia also expressed increased transcripts of other Ms4a family members including Ms4a6c, Ms4a6b, Ms4a6d, Tmem176a, and Tmem176b (Fig 2a). The Ms4a family genes are transmembrane chemosensors (Greer et al., 2016), some of which regulate immune cell function (Eon Kuek et al., 2016). However, the function of the Ms4a family members in cell- and tissue-specific contexts is largely unresolved. Ms4a family members are associated with Alzheimer’s risk (Hollingworth et al., 2011; Ma et al., 2015; Naj et al., 2011), but their role in the disease is not understood. Cluster 6 microglia also upregulated chemokine (C-C motif) receptor 1 (Ccr1), which regulates immune cell migration and functional states (Chou et al., 2010; Furuichi et al., 2008). Ms4a6c was also upregulated in microglia from the injured tissue (Fig 2c, Fig S4d), suggesting that these pathways might become reactivated in pathology.
Cluster 6 microglia were predominantly from E14.5 versus any other age or condition analyzed, as approximately 10% of all E14.5 microglia (but no more than 3% of microglia at any other age) fall into Cluster 6 (Fig 2b). In support of an early embryonic enrichment of these cells, Ms4a7 gene expression in microglia was most concentrated at E14.5 (Fig 2c). To ensure Cluster 6 microglia were localized in the brain parenchyma, we performed single-molecule fluorescent in situ hybridization (smFISH) followed by an automated high-throughput quantification (see methods) of Ms4a7 expression in microglia in the E14.5 and P30 brains. Microglia were marked by Fcrls, which was uniformly expressed by all microglia in every cluster (Fig 2d). Ms4a7+ microglia were sparsely distributed throughout the embryonic brain (Fig 2d,f), with a population of Ms4a7+ macrophages at the brain borders (not shown). Ms4a7+ microglia were most abundant at E14.5 (Fig 2e), and the small percentage of Ms4a7+ cells at P30 likely represent perivascular macrophages. These differences found by smFISH closely mimic the percentages of Ms4a7+ microglia found in our sequencing data and confirm that these cells are present in the developing brain.
Altogether, these results identify Cluster 6 microglia as a subpopulation that reside in the embryonic brain parenchyma and bears considerable transcriptional overlap with brain border macrophages. These cells might give rise to perivascular macrophages or could represent a precursor to mature microglia, but lineage tracing will be necessary to tease those possibilities apart.
Specialized axon tract–associated microglia (ATM) appear during a restricted developmental window
In the early postnatal brain, microglia regulate the growth and fasciculation of axons and can refine synapses in a circuit- and region-specific manner (Schafer and Stevens, 2015; Squarzoni et al., 2014). At P4/P5, we found one major microglial state (Cluster 4) that was barely found at any other time point (Fig 3a,b). These microglia expressed the gene secreted phosphoprotein 1 (Spp1), also known as osteopontin, at very high transcript levels (Fig 3c). Other upregulated genes included insulin-like growth factor 1 (Igf1), glycoprotein (transmembrane) NMB (Gpnmb), and immunomodulators from the galectin family, galectin-1 (Lgals1) and galectin-3 (Lgals3). These cells, which assume an amoeboid morphology (data not shown), also upregulate the lysosomal markers lysosomal-associated membrane protein 1 (Lamp1) and Cd68 (Table S1, Fig S5e), the latter of which is increased in phagocytic microglia (Schafer and Stevens, 2015). smFISH for Spp1 showed that these cells only resided in the subcortical axon tracts of the corpus callosum in the forebrain, as well as in distinct clusters in the axon tracts of the cerebellum (Fig 3d–f). The axon tracts where ATM were concentrated will eventually become heavily myelinated, but ATM are largely gone before myelination occurs. There was striking diversity of expression on a cell-to-cell basis in these areas, with some microglia expressing high transcript levels of Spp1 adjacent to neighbors that had no detectable Spp1 expression (Fig 3f).
Figure 3. Spp1-expressing axon tract-associated microglia (ATM) densely occupy the early postnatal brain. See also Figures S4 and S5.

(a) tSNE plot of Cluster 4 microglia and a table of the top nine upregulated genes in that cluster. Gray outlined genes are plotted in (c).
(b) Plot of the percent of cells per sample that were assigned to Cluster 4. ****P<0.0001. ANOVA with Tukey’s post-hoc analysis.
(c) Plot of the proportion of normalized UMI counts per sample (summed cell counts) for cells assigned to each cluster for the top genes in Cluster 4. Sample order per cluster is listed in the inset.
(d) Representive image of masked microglia from high-throughput smFISH analysis in a P5 saggital brain section. Fcrls+ only,red or Fcrls+Spp1+ ,yellow. Cbm=cerebellum, Rob=rest of brain, Cc=Corpus callosum, Ctx=cortex.
(e) Quantification of the percent of Fcrls+ microglia that also expressed Spp1 from smFISH analysis. N=3 mice and four brain regions were analyzed. ****P<0.0001, ***P<0.001, Two-way ANOVA, Tukey’s post-hoc analysis.
(f) Images of the P5 cerebellum and subcortical axon tracts of the corpus callosum stained by smFISH. Top two panels were stained with probes Fcrls and Spp1. Nuclei are marked by DAPI. Top panel, Hpc=hippocampus, Cp=choroid plexus, Lv=lateral ventricle, Cc=corpus callosum, Ctx=cortex. Middle panel, Men=meninges, Egl=external granular layer, Pcl=Purkinje cell layer, Igl=internal granular layer, Axtr=axon tracts. Lower panel was stained with probes Fcrls, C1qa and Spp1.. Scale = 200 μm (top panels), 20 μm (lower panel).
In conclusion, this Spp1+ microglia population is highly concentrated specifically in the axon tracts of the pre-myelinated brain. Their amoeboid morphology and their enrichment of genes associated with immune cell activation, lysosomal activity, and phagocytosis (Table S1, Fig S5e) suggest that ATM might engulf material in these regions. Further experiments will be needed to explore what this material could be, but their restricted tempo-spatial appearance suggests that their activity is highly regulated.
Microglia expansion and distribution fueled by metabolically active and proliferative microglia in early development
Microglia achieve their final cell numbers and distribution in postnatal development after brain development is well underway (Squarzoni et al., 2014). At early embryonic ages, microglia are far less abundant than in adulthood, when they constitute 10% of all brain cells. Rapid expansion of microglia also occurs in response to injury or disease, and their self-renewal capacity is sufficient to replenish the population within days following depletion of all but 1–2% of microglia (Elmore et al., 2014). Here, we uncovered several large microglial subpopulations in the embryonic and early postnatal brain that expressed markers associated with metabolic activity, cell proliferation, cell growth, and cell motility that could underlie the brain colonization process (Fig 4, Fig S5).
Figure 4. Metabolically active and proliferative microglial subpopulations dominate early brain development. See also Figures S4 and S5.
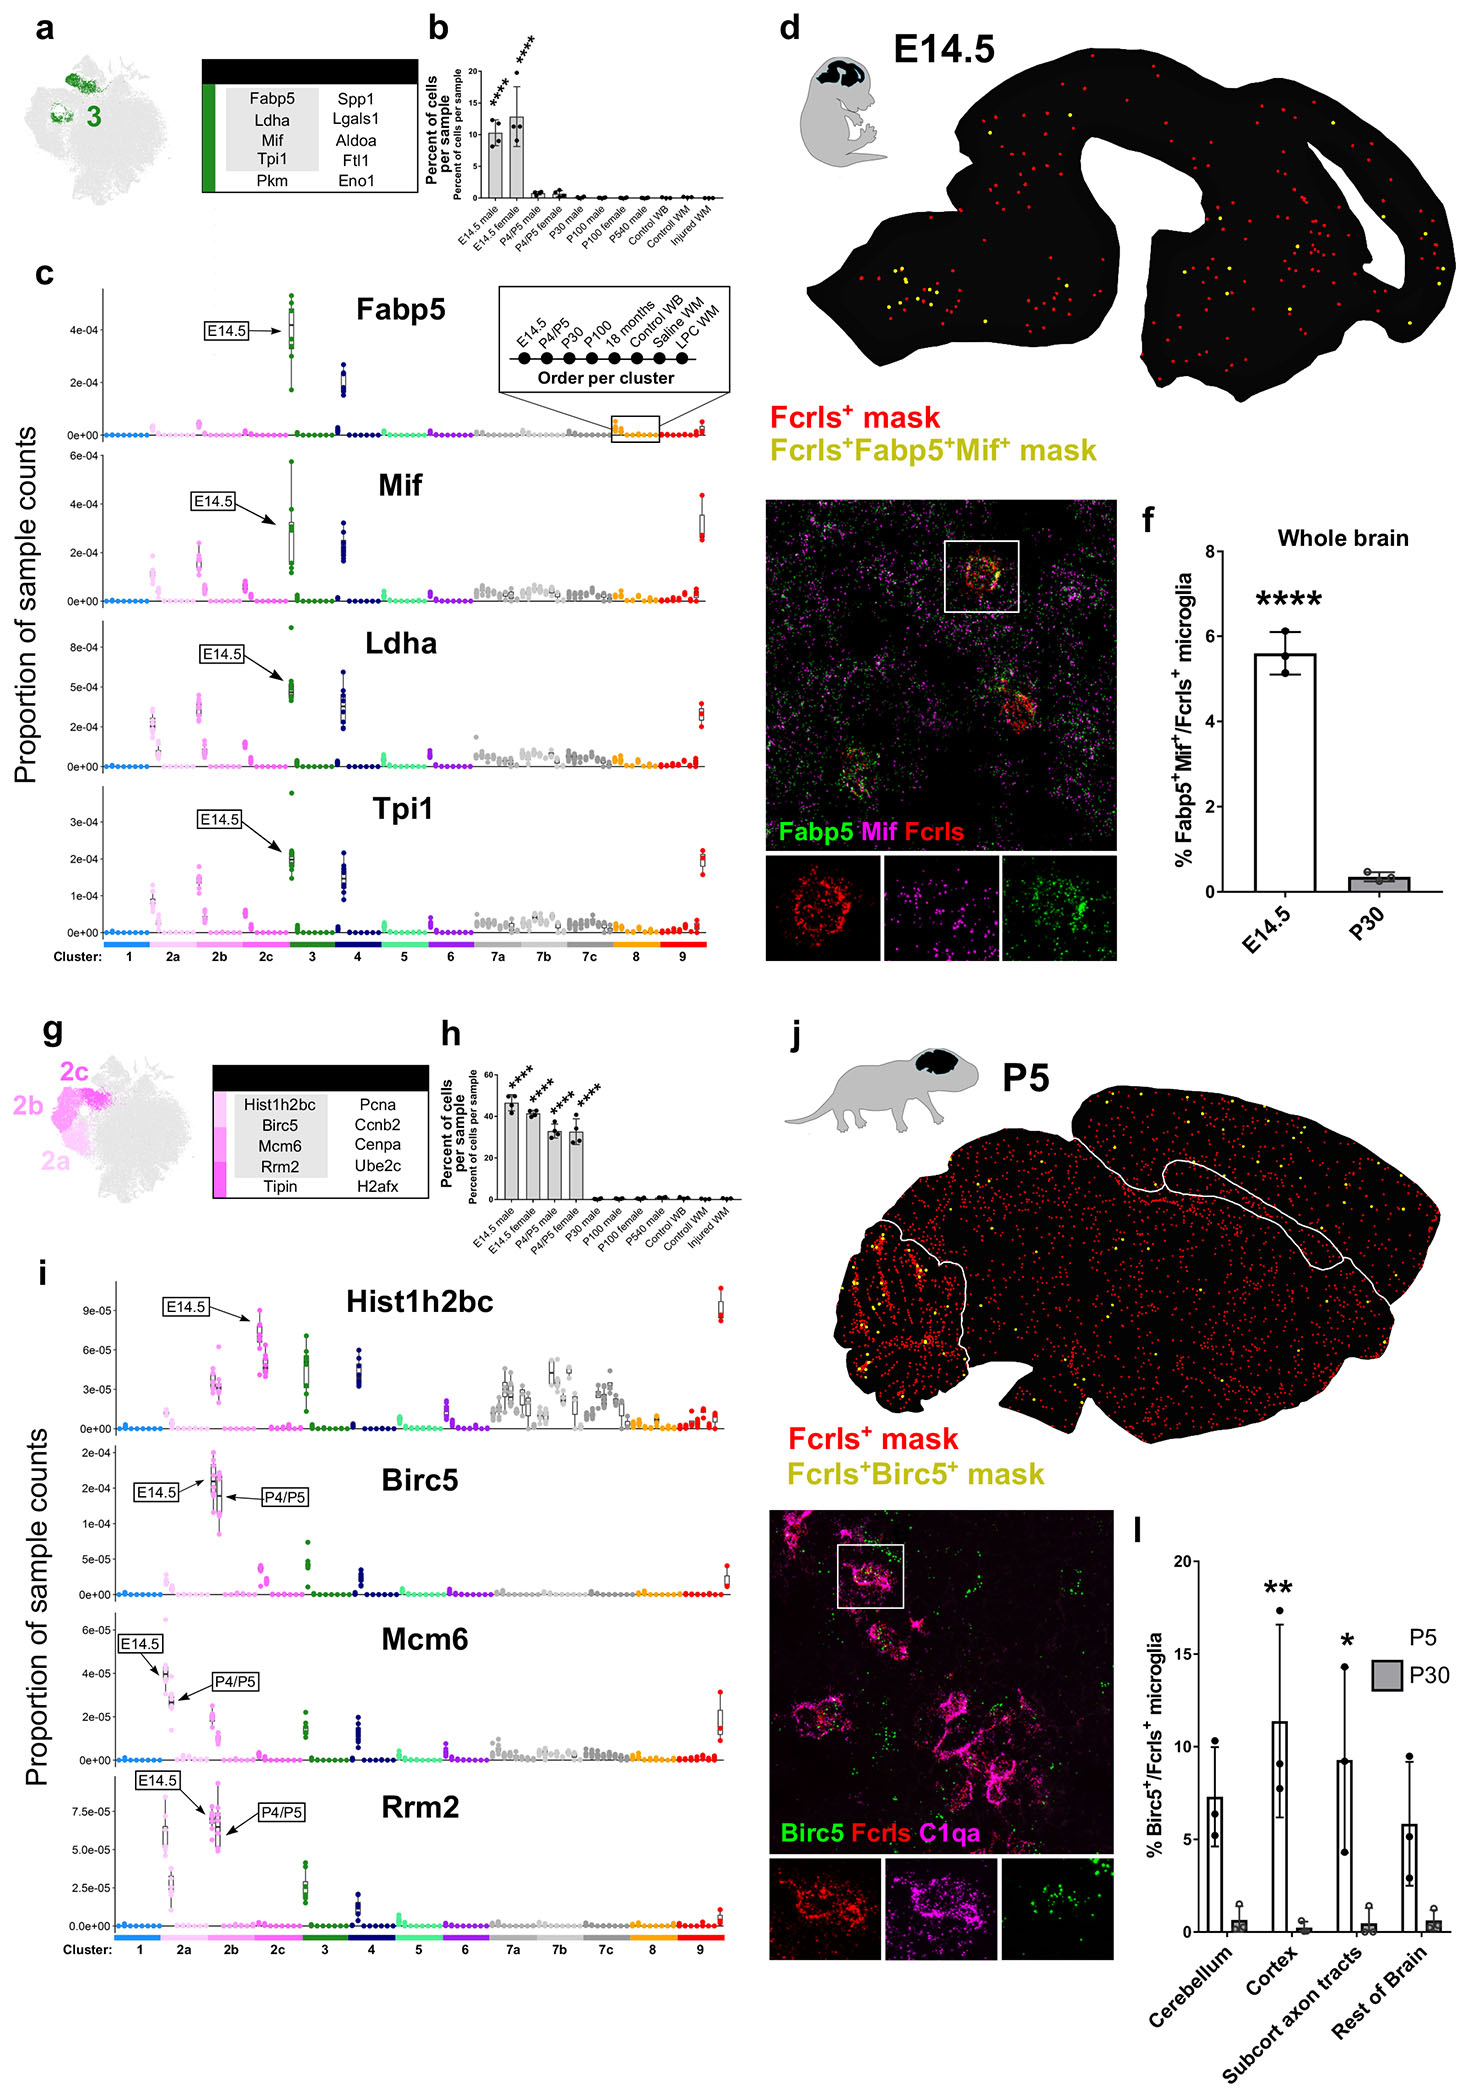
(a) tSNE plot of Cluster 3 microglia and a table of the top ten upregulated genes in that cluster. Gray outlined genes are plotted in (c).
(b) Plot of the percent of cells per sample that were assigned to Cluster 3. ****P<0.0001. ANOVA with Tukey’s posthoc analysis.
(c) Plot of the proportion of normalized UMI counts per sample (summed cell counts) for cells assigned to each cluster for the top genes in Cluster 3. Sample order per cluster is listed in the inset. The age where Cluster 3 counts are most elevated are labeled with an arrow.
(d) Representive image of masked microglia from high-throughput smFISH analysis in an E14.5 saggital brain section. Fcrls+ only, red) or Fcrls+Fabp5+Mif+, yellow. Hb=hindbrain, Mb=midbrain, Fb=forebrain, Nctx=neocortex.
(e) High-magnification confocal image of the P5 ventral pallium stained by smFISH with probes Fcrls, C1qa, Fabp5, and Mif. Scale bar = 20 μm.
(f) Quantification of the percent of Fcrls+ microglia that also expressed Fabp5 and Mif from smFISH analysis. N=3 mice. ****P<0.0001, ***P<0.001, Two-way ANOVA, Tukey’s post-hoc analysis.
(g) tSNE plot of Cluster 2 (a-c) microglia and a table of the top ten upregulated genes in those clusters. Gray outlined genes are plotted in (c).
(h) Plot of the percent of cells per sample that were assigned to Cluster 2. ****P<0.0001. ANOVA with Tukey’s post-hoc analysis.
(i) Plot of the proportion of normalized UMI counts per sample (summed cell counts) for cells assigned to each cluster for the top genes in Cluster 2. Sample order per cluster is listed in the inset.
(j) Representive image of masked microglia from high-throughput smFISH analysis in a P5 saggital brain section. Fcrls+ only, red Fcrls+Birc5+, yellow. Cbm=cerebellum, Rob=rest of brain, Cc=Corpus callosum, Ctx=cortex.
(k) High-magnification confocal image of the P5 cerebellum stained by smFISH with probes Fcrls, C1qa, and Birc5. Scale bar = 20 μm.
(l) Quantification of the percent of Fcrls+ microglia that also expressed Birc5 from smFISH analysis. N=3 mice. ****P<0.0001, ***P<0.001, Two-way ANOVA, Tukey’s post-hoc analysis.
The first subpopulation of microglia belong to Cluster 3 and uniquely express the gene Fabp5. Cluster 3 microglia upregulate several other genes including macrophage migration inhibitory factor (Mif), lactate dehydrogenase A (Ldha), and triosephosphate isomerase 1 (Tpi1) (Fig 4a,c). Mif and Fabp5 have both been linked to cell growth, motility, inflammation, and immunomodulation in macrophages and other cells (Calandra and Roger, 2003; Kannan-Thulasiraman et al., 2010; Liu et al., 2010). Other upregulated transcripts in Cluster 3 microglia were associated with glycolysis, suggesting an altered metabolic profile in these cells (Fig S5d), a feature that is consistent with other cell types in their early, less-differentiated states. A shift to glycolysis from oxidative phosphorylation is a key metabolic alteration in inflammatory macrophages (Mills et al., 2016). Cluster 3 microglia were found almost exclusively at E14.5, although a small percentage were also present at P4/P5 (Fig 4b). At E14.5, approximately 1015% of all microglia belonged to Cluster 3 (Fig 4b). The top genes, including Fabp5, Mif, Ldha, and Tpi1, in Cluster 3 microglia were also upregulated in the Cluster 4 Spp1+ microglia found at P4/P5, albeit to a lower extent (Fig 4c, Fig S4b). Metabolic pathways were also upregulated in both Clusters 3 and 4 (Fig S5d,e). Conversely, Cluster 3 microglia also expressed increased levels of the Cluster 4 markers Spp1, Gpnmb, and Igf1 (Fig 3c, Fig S4c), suggesting an overlapping transcriptional signature and possible relationship between the two states.
Mif and Fabp5 were both broadly expressed in the E14.5 brain, so both were used as smFISH probes to increase the confidence of colocalization with the microglial marker Fcrls. Fabp5+Mif+ microglia were distributed throughout the E14.5 brain and often formed small clusters (Fig 4d). smFISH quantification confirmed the striking decrease in the number of Fabp5+Mif+ microglia between E14.5 and P30 (6% vs. <1% of all microglia) (Fig 4e,f). Together, these data show that this unique population of Fabp5+Mif+ microglia was found almost exclusively in the embryonic brain and were not restricted to a particular brain region.
At E14.5, the most populous microglial states were proliferative (Clusters 2a,2b,2c) and comprised a total of approximately 40% of all E14.5 microglia and 35% of P5 microglia (Fig 4g,h). We grouped these clusters together because of their transcriptional similarity and because it is likely that each of the proliferative clusters represent microglia at different stages of the cell cycle. Indeed, pathway enrichment for M-phase, S-phase, and G-phase were represented to differing degrees in each subgroup (Fig S5a–c). The top cluster markers for Cluster 2a were minichromosome maintenance complex component 6 (Mcm6), proliferating nuclear cell antigen (Pcna), and Rrm2. For Cluster 2b, they were Ube2c, baculoviral IAP repeat-containing 5 (Birc5), and H2A histone family, member X (H2afx), and for Cluster 2c they were histone cluster 1, H2bc (Hist1h2bc), cyclin B2 (Ccnb2), and Cenpa. Markers for each of the proliferative populations were comparable in magnitude at E14.5 and P4/P5 and were highly specific to the proliferative clusters (Fig 4i, Fig S4a). By age P30 and onward, only a few percent of cells fell into these proliferative clusters (Fig 4h), suggesting that microglia divide at an extremely low rate at older ages, an assertion supported by recent publications (Fuger et al., 2017). However, in response to injury, some markers from both the proliferative clusters as well as the metabolically active cluster (Cluster 3) were slightly upregulated, suggesting possible reactivation of developmental pathways (Fig S3a,b).
The top cluster markers in Clusters 2 and 3 also shared some transcriptional overlap. For example, Mif, Ldha, and Tpi1 were also expressed by proliferative microglia but to a lesser degree (Fig 4c,i). The same is true for the cell proliferation genes, which were upregulated to a smaller extent in the Cluster 3 Fabp5+Mif+ microglia (Fig 4c). Interestingly, a portion of the Cluster 3 microglia physically cluster with the proliferative microglia (Fig 1b) and were also enriched for degradation pathways for mediators of proliferation (Fig S5d), which could indicate that these cells flexibly enter and exit a proliferative state.
Together, these two subpopulations of embryonic and early postnatal microglia likely play essential roles in controlling how microglia populate the brain. The widespread distribution of both proliferative and metabolically active microglia suggests that both cell subtypes give rise to mature microglia in the adult brain, but lineage tracing studies will be needed to track their progression.
Sex has no impact on microglial diversity or the number of cells in each subpopulation
Recent evidence has uncovered sex differences in microglial gene expression and function in the normal and challenged developing and adult brain (Hanamsagar et al., 2017; Thion et al., 2018). To determine whether sex had any effect on microglial diversity, we compared microglia from male and female mice at three major developmental ages: E14.5, P4/P5, and P100 (Fig S6). A total of 49,445 cells were clustered together across all the ages and sexes. We were able to recognize all of the same clusters that were identified in the larger analysis in Figure 1, and the clusters were colored the same way for comparison purposes (Fig S6a). As expected, microglia from males uniquely expressed the Y chromosome gene Eif2s3y and microglia from females expressed the X inactivation gene Xist (Fig S6f). We found almost no difference in the clustering between the male and female samples (Fig S6b–d), as measured by the number of cells per sample in each cluster (Fig S6c) and the normalized number of cells occupying each cluster (Fig S6d).
The only observed difference between the sexes was in Cluster Sx6, which was enriched in female samples. Cluster Sx6 is the smallest identified microglial cluster (~0.5% of microglia), was observed only at P4/P5 (Fig S6c–d, Fig 1d), and was enriched for the genes Cd74, chemokine (C-C motif) ligand 24 (Ccl24), and Arg1 (Fig S6e). Of note, Arg1 is a common marker of peripheral ‘M2’ macrophages (Murray et al., 2014), but we show in our dataset that microglia only express Arg1 in vivo in a very small subset of cells. Further analysis will be needed to validate and better understand this extremely small population of microglia, but overall these results showed that microglial diversity was largely unaffected by sex during normal development.
Small populations of inflammatory and interferon-responsive microglia emerge in the aged brain
As the brain ages, it becomes an increasingly challenging environment, characterized by the accumulation of oxygen free radicals, compromise of blood-brain barrier integrity, and loss of functional synapses (Montagne et al., 2015; Murman, 2015; Poon et al., 2004). Microglia may exacerbate some of these deleterious processes by driving or perpetuating brain inflammation through increased expression of inflammatory molecules (Grabert et al., 2016; Hickman et al., 2013). However, the extent of the microglial response to aging has not been comprehensively studied, and it remains unclear how, where (in the brain), and to what extent microglia change with normal aging. Aging did not lead to the appearance or disappearance of any clusters, but rather caused a progressive expansion of clusters that typically have few very cells in adolescent and adult samples (P30 and P100, Fig 1d) (Fig 5a–c). To more deeply assess how aging impacts microglial states, we performed a direct clustering comparison between microglia from adult (P100) and 18-month-old (P540) mice (Fig 5a). Two microglia clusters were identified as being enriched in aging mice (Aging Clusters (OA) 2 and 3), along with one monocyte and macrophage cluster (Mono/Mac), which expressed the macrophage-specific markers F13a1 and Mgl2 (Fig 1f). There were 2-4 times more microglia in Clusters OA2 and OA3 from the P540 samples versus P100 controls (Fig 5b,c).
Figure 5. Aging drives varied inflammatory states in microglia subpopulations.

(a) tSNE plot of 14,866 microglia from P100 and P540 (18 month) male mice (n = 4 per age) shows four microglia clusters (OA 1a, 1b, 2, 3) and one cluster of brain border macrophages (Mono/Mac).
(b) Locations of cells from each age on the same tSNE plot as in (a).
(c) Plot of the normalized percent of cells from each cluster derived from each age. ****P<0.0001, ***P<0.001, Twoway ANOVA, Tukey’s post-hoc analysis.
(d) Heatmap of gene expression in each of 14,886 cells in each of the clusters from (a). Plotted genes are some of the top genes for each cluster. Z-score represents the number of standard deviations from the mean following row scaling.
(e) Plot of the number of log-transformed UMI counts per 10,000 cell transcripts in all 14,886 microglia isolated from P100 and P540 samples.
(f) Representative low-magnification flourescent smFISH image of Fcrls+ (red) and Ccl4+ (green) cells in the P540 hindbrain. Scale bar = 25 μm.
(g) Representative high-magnification chromogenic ISH image of Fcrls+ (red) and Fcrls+Ccl4+ (red and turquoise) cells in the P540 hindbrain. Scale bar = 25 μm.
(h) Quantification of Ccl4+Fcrls+ microglia per square millimeter in the P30 and P540 brain. N=5 mice. *P<0.05. unpaired t-test.
The OA2 microglia expressed a number of inflammatory signals which were not normally expressed by other populations of microglia in vivo (Fig 5d). They upregulated Lgals3, cystatin F (Cst7), chemokines Ccl4 and Ccl3, as well as the inflammatory cytokine interleukin 1 beta (Il1b) (Fig 5d). Ccl4, also known as macrophage inflammatory protein-1 β (Mip-1β), is the ligand for chemokine receptor type 5 (Ccr5), which regulates the trafficking and effector functions of diverse populations of immune cells (Weber et al., 2001). Cluster OA2 microglia also upregulated expression of the transcriptional regulator DNA binding protein inhibitor 2 (Id2) and transcription factor activating transcription factor 3 (ATF3) (Table S1) ID2 binds and represses basic helix-loop-helix transcription factors and has been linked to immune cell development and differentiation and ATF3 is a regulator of macrophage inflammatory state and cytokine signaling (Gilchrist et al., 2006). There were very few Ccl4+ microglia in the healthy developing brain, with a small developmental peak at P5 but a large increase in the percentage of these cells was found in the P540 brain (Fig 1d). This increase, coupled with the overall increase in the inflammatory environment in the aged brain (Franceschi et al., 2007), suggests that this small subpopulation of microglia contributes to age-related brain inflammation; however manipulation of these microglia will be essential for testing this hypothesis.
To localize these cluster OA2 microglia, we performed smFISH and chromogenic ISH for Ccl4 and Fcrls on P30 and P540 brain sections and found evidence of Fcrls+Ccl4+ cells throughout the adult and aged brain (Fig 5f,g). Due to high autoflourescence from lipofuscin granules in the lysosomes of aged microglia, we performed smFISH in a low throughput manner using spectral gating (see Materials and Methods). Ccl4+Fcrls+ microglia were distributed amongst the other microglia but were otherwise indistinguishable (Fig 5f). To allow high throughput imaging and quantification of Ccl4+Fcrls+ microglia we used chromogenic ISH and found a significant upregulation of doublepositive cells in P540 brains (Fig 5h), however no significant differences in regional distribution were found. This quantification supports our sequencing data and shows an increase in the number of Cluster OA2 microglia with aging.
Cluster OA3 upregulated interferon-response genes including interferon induced transmembrane protein 3 (Ifitm3), receptor transporter protein 4 (Rtp4), and 2′-5′ oligoadenylate synthetase-like 2 (Oasl2) (Fig 5d,e). Age-related activation of interferon-response genes has been previously reported in the choroid plexus (Baruch et al., 2014) and in microglia (Grabert et al., 2016), but our findings indicate that this profile is actually restricted to a small subset of microglia (Fig 5a,c). Interferon-response genes can modulate inflammation (Baruch et al., 2014), so it is plausible that Cluster OA3 microglia also play a role in contributing to the inflammatory tone of the aged brain. Importantly, interferon is produced in response to damage-associated signals such as HMGB1 and cell-free nucleic acids. Therefore, the detection of localized populations of microglia expressing interferon-response genes may assist in identifying foci of neuronal injury or degeneration (Mathys et al., 2017).
Altogether, our data show that aging triggers a shift towards a more immunogenic profile including an increase in inflammatory microglia and interferon-responsive microglia. Even with the shift, the number of microglia that occupy these states form only a small fraction of microglia, suggesting that the vast majority of microglia are unaltered or only slightly altered by aging and that local cues like blood brain barrier compromise (Montagne et al., 2015) or microinfarcts (Smith et al., 2012) could drive state changes rather than a brain-wide shift.
Diverse microglial activation responses are triggered in demyelinated mouse lesions and human MS tissue
Research has often referred to microglia that respond to injury or pathology as ‘activated’, a catch-all term for biochemical and physical divergence from a homeostatic state. Activated microglia have been observed in almost every neurological disease including both neurodevelopmental and neurodegenerative disorders. However, it is still unclear whether or how microglia tailor their response to specific injury types or whether distinct populations of microglia exist in pathological tissue, as we lack both the markers and tools to identify and characterize different activation states, should they exist.
To begin addressing these questions, we used an injury model in which focal demyelination of the subcortical white matter in mice is triggered by injection of lysolecithin (LPC). LPC-induced demyelination is frequently used to study myelin repair and recapitulates many aspects of the demyelinated lesions found in patients with multiple sclerosis (MS) (Hammond et al., 2014). We used this model for several reasons: first, the time course of injury and repair are well established and controlled; second, microglia play a dynamic role in physiological and injury-induced remyelination (Miron et al., 2013); third, microglia respond robustly and rapidly to demyelination in this model; and finally, microglial activation is largely confined to the lesion where the demyelination has occurred. We focused our analysis on 7 days post-lesion (7 dpl), a time point at which microglia are highly responsive and the lesion is undergoing a transition from myelin debris cleanup to the initial phases of remyelination (Fig 6a). To capture microglia responding to the injury, white matter was microdissected from LPC- and saline-injected adult (P100) mice and processed using a previously described protocol (Fig 6a). Uninjected P100 whole-brain control samples were collected and processed in parallel. Analysis of microglia from these three conditions produced two major clusters (Fig 6b). Injury Responsive Cluster 1 (IR1) was composed mainly of whole brain and saline-injected control microglia, whereas Cluster IR2 was almost entirely composed of microglia from LPC-injected demyelinated lesions (Fig 6c). Injury responsive microglia (IRM) in Cluster IR2 had downregulated expression of the canonical microglial markers P2ry12 and Cx3cr1, a phenotype that has been observed in other injuries and diseases (Keren-Shaul et al., 2017; Salter and Stevens, 2017). We found that Cluster IR2-specific genes were variably upregulated among the microglia (Fig 6d), suggesting the existence of subpopulations within the cluster. To determine whether specific subsets of microglia upregulate these genes, we performed a second level of clustering analysis, called subclustering, on only Cluster IR2 cells (Fig 6e) and found several small subpopulations of IRM (Clusters IR2.1-2.4, Fig 6e). Injury Subcluster 2.4 expressed cell proliferation markers, including Birc5, a gene also expressed by proliferative microglia during early brain development (Fig 4g). Microglia from Cluster IR2.2 upregulated the interferon response gene Cxcl10 (Fig 6d,f). Two of the Injury Subclusters - IR2.2 and IR2.3 – specifically upregulated Ccl4 (Fig 6d,f). In addition to these distinct transcriptional programs, each Injury Subcluster broadly upregulated Cluster IR2 genes, including Apoe (Fig 6f). These results suggest that microglial activation is a tailored response in which microglia activate both generalized and selective transcriptional programs.
Figure 6. Injury-responsive microglia in demyelinated lesions exhibit multiple activation states. See also Figures S7.

(a) The subcortical white matter of adult mice was injected with the demyelinating agent lysolecithin (LPC) or saline and microdissected after 7 days post lesion/injection (dpl). Microglia were then isolated and sequenced (as is Fig 1a)
(b) tSNE plot of 11,470 microglia from LPC-injected white matter, saline-injected white matter, or whole-brain adult (P100) samples reveals two microglia clusters (IR1, IR2). N=3 mice per condition.
(c) tSNE plots of cells from each condition and a plot of the normalized percent of cells from each sample assigned to each cluster. ****P<0.0001, Two-way ANOVA, Tukey’s post-hoc analysis.
(d) Heatmap of gene expression in each of 11,470 cells in each of the clusters from (b). Plotted genes were grouped by genes that were downregulated (P2ry12, Selplg, Cx3cr1) in Cluster IR2 or those that defined each of the subclusters in Fig. 6e. Z-score represents the number of standard deviations from the mean following row scaling.
(e) Cells from Cluster IR2 were subclustered to identify different subpopulations of activated microglia. tSNE plot shows four subclusters of Cluster 2 microglia (2.1-2.4).
(f) tSNE plots of subclustered cells colored for expression (log-transformed counts per 10,000 transcripts) of genes that were expressed by the majority of Cluster IR2 microglia (Fcrls, Apoe, Ifi27l2a), or Cluster IR2 subpopulations (Ccl4 (IR2.3, IR2.3), Cxcl10 (IR2.2), and Birc5 (IR2.4).
Another major class of activated microglia called Disease Associated Microglia (DAM) were recently identified in a mouse model of Alzheimer’s disease (5xFAD) (Keren-Shaul et al., 2017). To compare DAM to two other classes of activated microglia in our dataset, ATM and IRM, we analyzed overlap in genes that were upregulated 1.5 fold or higher with a P-value of less than 1E-10 versus other microglia (for ATM) or control samples (for IRM and DAM) (Fig S7a, Table S2). We found that all three groups shared a common transcriptional signature of 12 core genes including Spp1, Lpl, and Apoe (Fig S7b). However, each group also expressed a number of unique genes. ATM uniquely upregulated genes found in development, including Gpnmb and Fabp5. IRM uniquely upregulated interferon response genes including Ifi27l2a and Cxcl10. They also uniquely upregulate interferon inducible protein 204 (Ifi204), a transcription factor which could act as an upstream regulator of the IRM response to injury.
To perform a more direct comparison between the pathological microglia (DAM and IRM) we used Canonical Correlation Analysis (CCA) (Butler et al., 2018) to account for differences between the single-cell platforms (10× Genomics vs. Mars-seq). Using this approach we found that DAM co-clustered with IRM in Microglia Comparison Cluster 2 (MC2) (Fig S7c,d). However, subclustering of Cluster MC2 revealed that DAM largely fell into Clusters MC2.1, MC2.4, and MC2.5 (Fig S7e,f). These clusters represented P2ry12high (MC2.1, data not shown), Spp1high (MC2.4, Fig S7h), and Ccl4high (MC2.5, data not shown) microglia. IRM, however, were evenly distributed between all five subclusters (Fig S7f). Cluster MC2.2 upregulated genes include Cxcl10 and other interferon response genes and contained almost no DAM (Fig S7f,g). Cluster 2.4 was equally represented by IRM and DAM and expressed high transcript levels of Spp1 (Fig S7h), which was part of the common transcriptional signature identified in Fig S7b. Together, these results suggest that activated microglia can respond in a diverse way to underlying pathological conditions.
Demyelinated lesions contain a high density of activated microglia, generally in the core, where they can remove myelin debris and release factors into the lesion microenvironment. Given the variable gene response in the Cluster IR2 microglia and the different subpopulations of activated microglia found in our subclustering analysis, we performed smFISH to determine the distribution of these microglia within the injured tissue (Fig 7a–d). A comparison of saline-injected controls and LPC-injected animals showed a large increase in the number of Fcrls+ microglia throughout the demyelinated tissue, as well as a broad upregulation of Apoe in microglia (Fig 7a), which supports our sequencing data (Fig 6d). smFISH showed that two of the selectively responsive genes – Ccl4 and Cxcl10 – were confined to small patches within the larger lesion (Fig 7b). Both markers colocalized with Fcrls in many, but not all cases, suggesting other cells might also upregulate these pathways. Very few Ccl4+Fcrls+ and Cxcl10+Fcrls+ cells were found in saline-injected controls compared to LPC-injected lesions, suggesting that these effects were in response to demyelination and were not a consequence of the injection (Fig 7c).
Figure 7. Different subpopulations of activated microglia are found in spatially restricted areas of mouse demyelinated lesions and human MS lesions.

(a) Confocal images of saline- and LPC-injected white matter in adult mice stained by smFISH for the microglial probe Fcrls and activation marker Apoe. Str=striatum, Cg=cingulum, Lv=lateral ventricle, Cc=corpus callosum. Injection site/lesion outlined with white dotted line. Scale bar = 250 μm.
(b) Confocal image of LPC-injected demyelinated lesion stained by smFISH for the probes Fcrls, Ccl4, and Cxcl10. Scale bar = 100 μm.
(c) smFISH quantification of the percent of Fcrls+ microglia in saline- and LPC-injected white matter that co-expressed markers Ccl4 and Cxcl10. N=3 mice, ***P<0.001, **P<0.01, unpaired t-test.
(d) Confocal images of saline- and LPC-injected white matter stained with antibodies to recognize Ccl4 and resident microglia marker Tmem119. Left scale bar =50 μm, right scale bar=20 μm.
(e) Low-magnification images of demyelinated active MS lesions stained with Luxol Fast Blue (myelin) and anti-HLADR antibody (microglia/immune cells).
(f) Confocal images of control and human MS white matter stained with antibodies to recognize Ccl4 and resident microglia marker Tmem119 and DAPI+ cell nuclei. Scale bar = 50 μm.
(g) Quantification of the percent of Ccl4+Tmem119+ microglia in control patients, active MS lesions, and unaffected white matter in MS patients. N=5 patients per condition, ****P<0.0001, one-way ANOVA, Tukey’s post-hoc analysis
To identify these subpopulations at the protein level, we stained saline- and LPC-injected lesions with anti-Ccl4 and anti-T mem119, a marker selective to resident microglia and not downregulated at the protein level following injury (Bennett et al., 2016). We found a large increase in the number of Tmem119+ microglia in the core of the lesion, as compared to saline-injected controls (Fig 7d). We also found an increase in the number of Ccl4+ cells (Fig 7d), which formed patches within the lesions, similarly to the smFISH analysis (Fig 7b). Ccl4 staining was found in Tmem119+ cells and was perinuclear, most likely in the Golgi, where cytokines are often packaged into vesicles for release.
Ccl4 is upregulated in the brains of Multiple Sclerosis (MS) patients (Szczucinski and Losy, 2007), where it could govern both trafficking and effector functions of infiltrating immune cells. To test whether we could identify a Ccl4+ subset of microglia in human MS lesions, we co-stained active demyelinated lesions from five age-matched control and patient samples (Fig 7e, Table S3). We used a human-specific anti-T mem119 antibody to mark resident microglia, since its expression is maintained by resident human microglia in MS lesions and is not expressed by infiltrating immune cells (Zrzavy et al., 2017). Co-staining with human anti-Ccl4 antibody showed that Ccl4 was upregulated in the core of active lesions, compared to unaffected white matter in control patients (Fig 7f). The percentage of Ccl4+ cells away from the active lesions was comparable to that seen in control patient tissue, suggesting this specific subset of microglia is only present in the lesion (Fig 7g). Ccl4 staining was found predominantly in Tmem119+ microglia, although a small percentage of Ccl4+/Iba1+ amoeboid immune cells were also observed (data not shown). Ccl4+ cells were also found in blood vessels in control and MS samples (as seen at the bottom of the MS lesion image, Fig 7f). In total, approximately 30% of microglia in the lesion were Ccl4+ (Fig 7g). These results suggest that specific subpopulations of microglia are similarly represented in mouse lesions and MS white matter lesions and that they are the predominant source of Ccl4 in MS lesions. Detailed analysis of whether the other genes enriched in these cells in mice translate to this subpopulation in humans will confirm their unique identity and inform strategies to manipulate them in MS.
Altogether, these results suggest that microglia ‘activation’ is a dynamic response involving transcriptionally and spatially distinct subpopulations. We were able to translate these findings to human disease, which could mean that markers of these unique – and potentially pathogenic – microglia could be used as biomarkers or therapeutic targets. The transcriptional signatures presented here will allow functional interrogation of each responsive microglial state and will help redefine how we classify microglial activation states in vivo.
Discussion
Our results suggest that microglia assume many distinctive states that change over time, states that can be defined by unique markers and localized within the brain. Because delineating closely related cell states using current computational methods can be difficult and over-clustering is a salient concern for these studies, we validated virtually all of the subpopulations using smFISH and antibody staining, demonstrating that this technology can be used to both find populations and characterize their distribution. Furthermore, our detection of these cells in tissue using a different technique confirmed that the isolation of cells did not cause transcriptional artifacts. Our cell clustering accurately represented the different microglial subpopulations in vivo. By taking a conservative approach coupled with detailed histology, we were able to identify and localize distinct microglial subpopulations. These transcriptional signatures will provide the foundational information required for allow the development of new tools – including new Cre driver lines - to interrogate microglial function and offer a shift in the current paradigm of how we understand, classify, and delineate microglial populations throughout development – as well as in disease, where changes in microglial morphology and ‘activation’ state have been observed but not understood.
We defined at least 9 subpopulations of microglia and provide unique transcriptional and spatial signatures that give us hints about their possible functions. Microglia development had been previously categorized in bulk RNA-seq studies, but our new cluster definitions highlight the greater degree of developmental complexity that were covered up by dominating signatures in bulk sequencing experiments. These signatures - cell cycle, phagocytosis, and surveillance - correspond with only three of the nine states presented here (Matcovitch-Natan et al., 2016). The specific roles of each microglial state will need to be tested directly, using genetic manipulation and other tools as they become available. This can be done by targeting each group of cells or on a gene-by-gene basis in each subpopulation and will provide a deeper mechanistic insight into microglia signaling mechanisms.
We found that microglial diversity is highest during early development, when microglia are still differentiating (Matcovitch-Natan et al., 2016). Recent evidence has shed light onto some of the signals, including TGF-beta, that direct this differentiation process, but the speed at which microglia mature and the number of states they assume during this time was not previously known. Here, we identified a unique microglial state (Cluster 6) that was enriched at E14.5 and defined by the genes Ms4a7, Ccr1, and Mrc1, which are also enriched in brain border macrophages. These microglia, which were present in the brain parenchyma, could be microglia that have yet to fully differentiate. In support of this idea, blocking TGF-beta signaling (which helps to confer microglia identity, (Butovsky et al., 2014)) has no major effect on microglia cell number, but causes a drastic shift in their gene expression including widespread upregulation of (or failure to downregulate) genes found in Cluster 6 microglia and in brain border macrophages, including Mrc1 (Wong et al., 2017). These microglia could also arise from ontologically distinct progenitors – recent transplantation experiments suggest that Ms4a7 and other markers in Cluster 6 are specific to hematopoietic derived cells versus those derived from yolk-sac progenitors (Bennett et al., 2018). Lineage tracing will be essential to understanding their origin and whether they give rise to microglia that persist in the brain.
Other key microglial states in early development were enriched for pathways associated with cell metabolism, growth, motility (Cluster 3) and proliferation (Clusters 2a-c) and were scattered throughout the brain. Clusters 2 and 3 had considerable transcriptional overlap, suggesting that microglia transition in and out of both states. Because microglia migrate, grow, and proliferate in response to injury, teasing apart the molecular triggers regulating these pathways could allow for the manipulation of microglial number as a treatment – for example, to reduce the number of reactive microglia and limit inflammation, astrogliosis, and cytotoxicity in neurodegenerative disease (Liddelow et al., 2017). Furthermore, these cells had a distinct metabolic signature. Metabolic state is directly manipulated by cytokine and pattern-recognition receptors, and elevated glycolytic activity has been tied to immune cell activation (Everts et al., 2014; O’Neill and Pearce, 2016). The other microglial subpopulation in the developing brain, Cluster 4, was restricted to unmyelinated axon tracts at P4/P5 and assumed a highly activated profile, which was surprising in the absence of any pathology. The temporally and spatially restricted nature of these cells suggests extrinsic forces shape this state, but what those signals are and where they come from is still unknownTwo recent studies have linked these cells to myelin formation and hypothesized that they release myelinogenic molecules, but this hypothesis has not been directly tested by selectively targeting these cells (Hagemeyer et al., 2017; Wlodarczyk et al., 2017). Another group showed that these microglia were the predominant source of Igf1 in the early postnatal brain, and Igf1 conditional knockout in microglia affected the health of developing cortical neurons at the same age (Ueno et al., 2013). These studies point to an important developmental role for these cells, which can be further explored using the highly defined transcriptional signature we present here.
Pathways expressed in development are often re-expressed in disease, and it has long been hypothesized based on morphological similarities between developing microglia and activated microglia that injury causes a reversion to an immature state. We found that microglia responding to injury do re-express developmental markers, but their transcriptional states do not completely overlap. The greatest similarity in cell state was found between P5 Cluster 6 microglia and microglia in the demyelinated lesion. Both groups of cells upregulated similar genes including Apoe, Lpl, and Spp1. These markers may comprise elements of a common activation pathway, since these genes are also upregulated in microglia that surround plaques in an Alzheimer’s disease model (Keren-Shaul et al., 2017). That microglia are activated by comparable signaling mechanisms in development (Cluster 6) and disease/injury is a tantalizing and widely discussed concept. Our characterization of their transcriptomes will enable investigation of the triggers that cause this response in both contexts. In addition to this common activation state, we also found that injury-responsive microglia upregulated other pathways found in developmental subpopulations including markers of proliferation (Birc5), metabolic activity (Cluster 3 microglia [Mif]), and those belonging to the Ms4a family (Ms4a6c). Re-expression of these markers could be an integral part of the activation process and might be necessary to stimulate a quick response to pathology. Therefore, as we learn more about the role of these pathways in development, we will be able to assess their importance in disease.
A major finding in our study was the identification of a subset of microglia that selectively express the chemokine Ccl4. These microglia are present in small numbers during development and expand in two different contexts: aging and injury. The role of inflammatory molecules in the brain has long been studied, and it has been assumed, based largely on in vitro studies, that microglia are a major source of these factors (Ransohoff, 2016). However, we found that the only microglia enriched for inflammatory signals are in Cluster 8/Cluster OA2/Cluster IR2.2, IR2.3 and express Ccl3, Ccl2, Ccl7, Ccl9, Ccl12, Il1b and Tnf. Since this small subpopulation of microglia was so small throughout the mouse lifespan, it is possible that they are a specialized group uniquely primed to produce an inflammatory response. Many of the signals expressed in this subpopulation can be highly damaging to the brain. For example, Il1b and Tnf can both cause neurotoxicity (Takeuchi et al., 2006; Ye et al., 2013), and infiltrating immune cells attracted by the chemokines expressed in the Ccl4+ subpopulation can exacerbate pathology (Gadani et al., 2015). In MS, infiltrating immune cells specifically target myelin and cause white matter lesions. Precise targeting of this inflammatory subpopulation of microglia in disease could yield a safe and effective way to limit the negative side effects of microglial activation while maintaining the beneficial functions including removal of myelin debris and release of neurotrophic signals (Miron et al., 2013).
Microglia are an especially attractive target for biomarker development and to monitor clinical progression because they can sensitively respond to changes in the brain that emerge before physical symptoms. For example, microglia become activated and aberrantly remove synapses in the early stages of pathology in mouse models of Alzheimer’s disease, well before cognitive decline and plaque formation (Hong et al., 2016). In fact, evidence of aberrant microglia activation has been found in many forms of neurodevelopmental and neurodegenerative disease, but the diversity of these responses and specificity of the microglia response to each disease needs further exploration (Salter and Stevens, 2017). Current PET imaging ligands, including TSPO, are not selective for microglia and are better markers of neuroinflammation (Politis et al., 2012). Therefore, identification of robust markers for different microglia states in disease will allow for the development of tools to more specifically track and visualize microglial activation, inflammation, and disease progression.
STAR Methods
CONTACT FOR REAGENT AND RESOURCE SHARING
Further information and requests for resources and reagents should be directed to and will be fulfilled by the Lead Contact, Dr. Beth Stevens (beth.stevens@childrens.harvard.edu).
EXPERIMENTAL MODEL AND SUBJECT DETAILS
Animal Studies:
All experiments were reviewed and overseen by the institutional animal use and care committee at Boston Children’s Hospital in accordance with all NIH guidelines for the humane treatment of animals. C57bl/6J (Jackson labs) were used for all single cell RNA sequencing, RNAscope, and immunohistochemistry experiments at the ages denoted in the manuscript. For the normal development single cell RNA sequencing experiments 4 E14.5 male, 4 E14.5 female, 3 P4 male, 3 P4 female, 1 P5 male, 1 P5 female, 4 P30 male, 4 P100 male, 4 P100 female, 4 P540 male mice were used. For the demyelination experiments, 9 P100 male mice were used in total (3 per condition). The P5 Percoll comparison single cell RNA sequencing experiments were done using nine P5 female mice. Timed breeders were set up to produce E14.5 animals by combining male and female breeders in the evening and if a plug was found the following morning the developing embryos were marked as embryonic day 0.5 (E0.5). A mixture of male and female mice was used for the RNAscope experiments.
Human MS Studies:
Brain tissue was obtained through a UK prospective donor scheme with full ethical approval from the UK Multiple Sclerosis (MS) Tissue Bank (MREC/02/2/39). See Supplemental Table 3 for patient information.
METHOD DETAILS
Generation of microglia single cell suspensions for sequencing:
Centrifuges and tools were all prechilled to 4°C or on ice. Mice were transcardially perfused using ice cold Hank’s balanced salt solution (HBSS) and the brains were quickly dissected and placed on ice. Brains were minced using a scalpel and then Dounce homogenized in ice cold HBSS 15-20 times each with the loose and tight pestles while simultaneously rotating the pestle. The cell suspension was then transferred to prechilled 50 mL tubes and passed through a pre-wet (with HBSS) 70 micron cell strainer. Cell suspensions were then transferred into a prechilled 15mL tube and spun down at 300g for 5 minutes in a centrifuge set to 4°C. For P30 and older samples, debris and myelin were removed using a modified cold Percoll gradient: Cell pellets were resuspended in 10 mL (total) of ice cold 40% Percoll (Sigma) diluted in HBSS and then spun for 30 minutes at 500g with full acceleration and braking. Using this approach, the microglia pellet at the bottom of the 15mL tube and the Percoll and myelin were then removed by vacuum suction. The cell pellet was washed with 10 mL of ice cold HBSS and spun again for 5 minutes at 300g at 4°C. All samples were then resuspended in 500 microliters of ice cold FACS buffer (0.5% BSA, 1mM EDTA, in 1× PBS, Sterile Filtered) containing Cd11b (PE), CD45 (APC-Cy7), and Cx3cr1 (APC) antibodies from Biolegend at a 1:200 dilution for 30 minutes on ice. Samples were then washed in 10 mL of ice cold FACS buffer and spun down for 5 minutes at 300g and then resuspended in 500 microliters of ice cold FACS buffer. Prechilled 96 well plates (Eppendorf) were precoated with FACS buffer for 1 hour on ice and then all but 5 microliters of FACS buffer was removed from each well. Plates were kept on ice until the respective sample was ready to sort. 12,000-15,000 microglia were then sorted on a BD FACSAria II using the 70 micron nozzle with purity mode into individual wells with a sort speed of approximately 10,000 events per second. Each sample took approximately 5-10 minutes to sort. After sorting one sample the plate was immediately put back on ice. The resulting volume in each well was approximately 20 microliters depending on the number of cells sorted.
Single cell sequencing:
FACS purified microglia were sequenced using the Chromium single cell gene expression platform (10× Genomics). Approximately 10,000-13,000 microglia from each sample were directly loaded into each sample well following manufacturer instructions and combined into droplets with barcoded beads using the Chromium controller. Manufacturer specifications were followed for generation of the barcoded libraries and then the samples were sequenced to an average depth of 40,000-60,000 reads on an Illumina Nextseq 500 sequencer.
NAscope probes and antibodies
RNAscope:
Apoe (313271), Birc5 (422701), C1qa (441221), Ccl4 (421071), Cxcl10 (408921), Fabp5 (504331), Fcrls (441231), Mif (513801), Ms4A7 (314601), Spp1 (435191).
Immunohistochemistry:
anti-Tmem119 (for mouse staining, Abcam ab209064, 1:500), anti-Tmem119 (for human staining, Sigma, HPA051870, 1:500), anti-CCL4/MIP-1 beta (for mouse staining, R&D Systems AF-451 1:25), anti-CCL4/MIP-1 beta (for human staining, R&D Systems AF-271, 1:25), anti-HLA-DR (LN3) (Abcam).
FACS:
anti-Cd11b [M1/70] PE (Biolegend, 101208, 1:200), anti-Cd45 APC-Cy7 (Biolegend, 103116, 1:200), anti-Cx3cr1 (Biolegend, 149008, 1:200).
High throughput processing and quantification of RNAscope smFISH:
Sectioning:
Mice were anesthetized and perfused intracardially with ice cold HBSS. Heads (E14.5) or brains (P5, P30, P540) were removed and flash frozen using liquid nitrogen and then hemispheres were cut into 16 micron sagittal sections using a cryostat and stored at −80°C until use. To sample the entire brain, slides were divided into four groups representing one quarter of the brain hemisphere and one slide from each group (4 total) was selected for each staining.
RNAscope:
The RNAscope Fluorescent Multiplex Assay (ACD Biosystems) was performed according to the ACD protocol for fresh-frozen tissue. Brains sections from each time point (E14.5, P5, P30) were hybridized with three mRNA probes per experiment. Fcrls was used as the common universal microglial marker for each set of probes. Additionally, the ACD 3-plex negative control probe was used on one section per slide to confirm signal specificity. The probes were amplified according to manufacturer’s instructions and labeled with the following fluorophores for each experiment: Alexa 488nm, Atto 550nm, Atto 647nm.
High throughput automated analysis:
A Zeiss Axio Scan.Z1 automated slide scanning microscope was used to take 20× tiled images of entire sagittal sections for each hybridized sample. For high resolution representative examples of each probe set, 60× confocal images were acquired on a Zeiss LSM 710 and a maximum intensity projected was presented in each figure following minimal processing to remove tissue background. For the aged brain tissue smFISH, a channel was left unstained to identify autoflourescent material. We performed spectral gating on the LSM 710 microscope to narrow the collected emission spectra for the Alexa 488 and Atto 550 dyes and to minimize the autofluorescence.
LPC-induced demyelination:
Mice were deeply anaesthetized using 100 mg/kg Ketamine and 10mg/kg Xylazine. Lysolecithin (1% Lyso, 2uL, EMD chemicals) or saline was injected bilaterally into the external capsule of 12-16wk old mice using a Hamilton syringe. Injections were made using a stereotaxic apparatus at the following coordinates: 1.0 mm anterior to Bregma, 1.5 mm lateral, 3.0 mm deep. The day of injection was denoted as 0 days post lesion (dpl). Mice were then left for a period of 7 dpl and then processed for immunohistochemistry, smFISH, or single cell sequencing. For single cell sequencing analysis, mice were perfused using ice cold HBSS and then brains were dissected and place into a pre-cooled metal brain mold/slice matrix and 1mm brain sections were removed and placed in ice cold HBSS. The lesioned or saline-injected areas were micro dissected on ice and then processed using small 1mL dounce homogenizers and processed as described in the single cell suspension section of the Material and Methods.
Immunohistochemistry:
Mouse:
Mice were anesthetized and perfused intracardially with ice cold HBSS and drop fixed overnight in 4% paraformaldehyde (PFA). Brain sections (25um) were collected using a cryostat and mounted onto charged slides and stored at −80°C until use. Brain sections were rehydrated in PBS, and blocked for one hour at room temperature in blocking solution (10% donkey serum, 0.2% triton X-100, in 1× PBS) and then transferred to a carrier solution (5% donkey serum, 0.2% triton X-100, in 1× PBS) containing diluted antibodies (see RNAscope probes and antibodies of the Material and Methods). Sections were incubated overnight at 4°C and then washed three times for 10 minutes each in PBS and then secondary Alexa-flour conjugated antibodies diluted in carrier solution (1:500) were added to the sections for one hour at room temperature. Sections were then washed three times for 10 minutes each in PBS and then Vectashield mounting media containing DAPI and coverslips were added to the slides. Slides were imaged using a Perkin Elmer Ultraview Vox spinning disk confocal microscope and presented as maximum intensity projections. Large fields of view were imaged and stitched together using Volocity software.
Human tissue:
Snap-frozen tissue was sectioned at 10 μm and classified according to the International Classification of Neurological Disease using Luxol fast blue staining and HLA-DR. Sections were fixed in 4% paraformaldehyde for one hour at room temperature, and permeabilized in methanol for 10 min at −20°C. Foll owing antigen retrieval, sections were blocked with 10% normal donkey serum and 0.1% Triton™ X-100 in 1× PBS for one hour at room temperature. Primary antibodies were then diluted in blocking solution and added to sections and incubated overnight at 4°C. Sections were washed three times in PBS and then Alexa-flour conjugated secondary antibodies were applied (1:500) for two hours at room temperature. Sections were then washed three times in PBS and then treated with 0.05% Sudan Black B (Sigma) in 70% ethanol to eliminate tissue autofluorescence and then thoroughly washed to remove any excess. Sections were mounted in Fluoromount Aqueous Mounting Medium (Sigma) and nuclei were stained by DAPI (4′,6-diamidino-2-phenylindole; Thermofisher). Fluorescent images were acquired on a Leica SPE confocal microscope and presented as maximum intensity projections. Ccl4 antibody specificity was tested using secondary antibody only controls as well as with antibody preadsorption using recombinant Ccl4 protein, as previously described (Sekar et al., 2016). The number of Tmem119+ and Tmem119+Ccl4+ cells were counted per 10× field for several fields of view and reported as the percentage of microglia that were double positive for both markers. For MS tissue counts were taken from both inside the active lesion and in unaffected white matter and compared to control patients
QUANTIFICATION AND STATISTICAL ANALYSIS
Single cell data analysis:
Sequenced samples were processed using the Cell Ranger 1.2 pipeline and aligned to the GRCm38 (mm10) mouse reference genome. For each sample a digital gene expression matrix (DGE) was generated containing the raw UMI counts for each cell in a given sample. DGEs from each sample were then merged and processed using the independent component analysis (ICA) based platform, as described in (Saunders et al., 2018). Cell with fewer than 650 detected genes/cell and genes that were expressed by fewer than 20 cells (0.025% of all cells in the dataset) were removed before identification of variable genes in the dataset, cell centering and scaling, and generation of ICs. For the total dataset analysis (Figure 1), two rounds of ICA were performed. In the first round, 50 ICs were generated. The goal of the first round of clustering analysis was to identify (and remove) contaminating cell types using well-established markers for neurons and other brain cell types. Following this stage, a second round of ICA was performed using 40 ICs on microglia and immune cells. ICs corresponding to batch or replicate effects were removed from analysis, and the cells were then clustered based on their values for the remaining ICs. We used a clustering resolution parameter value of 0.8. For the aging comparison (Figure 5) only one round of ICA was performed using 20 ICs at a resolution of 0.8. For the analysis of the injured white matter a first round ICA was performed with 15 ICs at a resolution of 0.125, and then sub-clustering analysis of the injury responsive microglia was performed using an automatically generated number of ICs, as previously described (Saunders et al., 2018). For each analysis ICs were curated and assigned to one of the following categories: ICs for which high-scoring cells expressed markers of other cell types (“doublets”); ICs for which fewer than 5 cells had high cell loading scores (“outliers”); noisy ICs or ICs that correlated with batch or individual sample replicate (“artifacts”); or ICs to be used for subsequent clustering analysis (“real”). Genes that define each cluster of microglia exceed a minimum threshold of 1.5 fold change and a P-value less than 1E-4 and were adjusted using Benjamini–Hochberg false discovery rate (FDR) correction.
tSNE plots of gene expression
Centered and scaled UMI count values per cell were transformed by multiplying by 10,000, adding 1 and then taking the log of these values. These values were plotted using a custom R script and ggplot2 with the YlOrBr scale from the RColorBrewer package.
Proportion of sample counts analysis
Meta-cells were generated by summing the UMI counts for all cells in a sample per cluster (e.g. E14.5 male 1 cells in cluster 1) and then normalized by dividing that number by the total UMI counts for that sample in all clusters. Graphs were plotted using a custom R script and ggplot2.
Percent of cells per cluster/sample analysis
To calculate the percent of cells per cluster from each sample, the number of cells from each sample in a given cluster was calculated and normalized to the number of cells per sample. These values were then scaled to the other replicate samples. Significantly enriched samples were identified using a two-way ANOVA with Tukey’s post-hoc test and P-values are reported in each figure.
The percent of cells per sample for a specific cluster were calculated by dividing the number of cells assigned to a cluster for a sample by the total number of cells in that sample. Statistical comparisons between the ages were identified using a one-way ANOVA with Tukey’s post hoc test and P-values are reported in each figure.
Heatmaps
Centered and scaled UMI count values per cell were transformed by multiplying by 10,000, adding 1 and then taking the log of these values. Heatmaps in Figures 5 and 6 were generated by plotting these values using pheatmap in R with row scaling to produce z-score values using the color ramps blue2red color scale.
Pathway analysis
Upregulated marker genes from each cluster (Supplemental table 1) were converted to ENSEMBL gene ids and uploaded to the InnateDb database (InnateDB.com). Pathway analysis was performed using Hypergeometric testing and a Benjamini Hochberg correction for multiple testing. The top 15 enriched pathways with a corrected P-value less than 0.05 from the Reactome and Kegg databases were reported.
Gene overlap comparison of ATM, IRM, and DAM
Cluster marker lists from (Keren-Shaul et al., 2017) (DAM) were downloaded (Supplemental Table 3, mmc3) and used for analysis. Genes from the IRM and ATM were taken from Supplemental table 1 (Cluster IR2 and Cluster 4, respectively). A minimum fold change greater than 1.5 and a P-value lower than 1E-10 were used to curate the lists. Unique and overlapping genes between each microglia cluster were identified and reported in Supp. Fig 7b and Supp. Table 2.
CCA analysis of IRM and DAM
Raw data from (Keren-Shaul et al., 2017) (DAM) were downloaded from GEO: GSE98971 (https://www.ncbi.nlm.nih.gov/geo/query/acc.cgi?acc=GSE98971). All control and 5xFAD replicates were used for clustering analysis. Control WB, Saline WM, and LPC WM samples were compared with the DAM samples. For all samples a gene cutoff of 300 genes per cell was used to accommodate the lower gene content of the DAM data. DAM samples were clustered using the ICA pipeline and non-microglial immune cells (NK cells, T cells, B cells, Monocytes and Granulocytes) were removed from the dataset. All samples were then merged and analyzed using Canonical Correlation Analysis (CCA) as part of the Seurat single cell analysis package (Butler et al., 2018; Satija et al., 2015). In short, 1500 of the most variable genes between the datasets were chosen and CCA was run to identify 20 CCs. The MetageneBicor plot was used to choose the 10 CCs that preceeded the CC saturation point. The cells were then clustered at a resolution of 0.15 with a tSNE perplexity of 40.
For subclustering analysis using CCA, the cells from Cluster MC2 were reanalyzed as described above, but using the top 1000 variable genes and 6 CCs. Cells were clustered at a resolution of 0.4 with a tSNE perplexity of 50. All plots from the CCA analysis were generated using Seurat’s built in functions as well as ggplot2 in R.
Metacell analysis
Mono/Macs were removed from samples based on the clustering analysis in Figure 1. Metacells were generated by summing all the counts from all the cells in each individual sample at each age and condition. Each metacell was then normalized using Deseq2 (Love et al., 2014) and plotted using ggplot2 in R.
High throughput processing and quantification of RNAscope smFISH:
For automated analysis, slide scanned images were downsampled to 50% size and a background subtraction was performed in ImageJ. Images from each channel were processed in Ilastik, an open source program that uses interactive machine learning to further separate punctate RNAscope signal from tissue background. The software was trained using multiple images from each channel and the pixel classification was applied to all images of the same channel from each experiment. Processed images were output from Ilastik as binary masks with cells in white and background in black.
ROIs were hand drawn on the DAPI channel from each section using a custom CellProfiler pipeline. Postnatal timepoints had 4 ROIs: cerebellum, cortex, subcortical axon tracts, and the rest of the brain. Embryonic brains had a single ROI drawn to capture the entire brain. The ROI drawings were used as binary masks to overlay onto the images before quantification to exclude all cells outside of the ROI.
For each experiment, a custom CellProfiler pipeline was designed to process the binary Ilastik output images. Generally, the pipeline identified each Fcrls positive cell and each cell positive for the specific probe(s) from each experiment. The experimental probes were shrunken down to a single pixel in the center of the cell then expanded into a 5-pixel diameter circle. If the circular objects were found within the borders of the Fcrls positive cells, the cells were considered double or triple positive. Some modifications were made to tailor this approach to the unique aspects of each set of probes (see below). Masks from this analysis are presented in each figure to demonstrate the distributions of probe positive microglia. The number of double positive microglia was divided by the total number of Fcrls positive microglia in each ROI and statistics were performed using an unpaired Student’s t-test for direct comparisons, a two way ANOVA with Tukey’s post hoc test for multiple brain region/condition comparisons.
Specific procedures for each probe set:
Spp1: The Spp1 probe produced a very strong signal that covered a wider diameter than Fcrls positive cells. Because of this, the order was reversed and Fcrls positive cells were shrunken down to a single point and expanded to a 5-pixel diameter circle. Spp1 positive cells that contained a 5-pixel Fcrls positive object were considered double-positive.
Birc5: Birc5 positive objects were shrunken down to a single pixel, but not expanded to a 5-pixel diameter circle to avoid false positives with closely grouped cells.
Mif/Fabp5: Due to the high expression of Mif and Fabp5 in numerous cell types, microglia needed to contain both Mif and Fabp5 positive objects to be considered positive.
smFISH in saline- and LPC-injected animals was performed on 16 micron coronal sections as described above. Slides were imaged using a Perkin Elmer Ultraview Vox spinning disk confocal microscope and presented as maximum intensity projections. Large fields of view were imaged and stitched together using Velocity software. The number of double positive microglia per square millimeter in LPC lesions was quantified by hand in several sections per animal in three animals per condition.
Imaging and quantifying chromogenic in situ slides
The RNAscope® 2.5 HD Duplex Detection Kit (Chromogenic) was used in experiments involving 18 month-old mice to avoid autofluorescence from lipofuscin accumulation in the aged brain (Xu et al., 2008). Brain sections from P30 and P540 brains were hybridized with two mRNA probes per experiment: Fcrls, and Ccl4. The ACD 2-plex negative control probe was used on one section per slide for control purposes. Probes in channel 1 were labeled with HRP enzyme and visualized with a green substrate and probes in channel 2 were labeled with AP enzyme and a red substrate. Hematoxylin was used to mark cell nuclei in blue. Slides were then imaged using a Zeiss Axio Scan.Z1 automated slide scanning microscope to take 20× bright field tile scans of entire sagittal sections. The quantification included brains from five animals at either time point (P30 or P540) with 4-5 sections for each, spaced across a single hemisphere. The images were coded to obscure the identity of each sample as well as the probes used. A blinded researcher used the manual counting feature in ImageJ to count cells labeled with green substrate (Ccl4+) or co-labeled with green and red substrate (Ccl4+Fcrls+). Counts converted to density measures based on the size of the brain section and averaged across the 4-5 brain sections and reported as Ccl4+Fcrls+ cells per mm2. Statistics were performed using an unpaired Student’s t-test for direct comparison of whole-brain Ccl4+Fcrls+ cell densities between the P30 and P540 samples.
DATA AND SOFTWARE AVAILABILITY
Raw fastq files and Cell Ranger 1.2 processed digital gene expression matrixes (DGE) for each animal/sample in the NIH GEO database (GSE121654).
ADDITIONAL RESOURCES
We developed a searchable website where users can easily examine microglia gene expression patterns in our dataset. This can be found at www.microgliasinglecell.com. Please direct any website related questions to the lead contact for this manuscript.
Supplementary Material
KEY RESOURCES TABLE
| REAGENT or RESOURCE | SOURCE | IDENTIFIER |
|---|---|---|
| Antibodies | ||
| Anti-TMEM119 - for mouse staining | Abcam | cat#: ab209064 |
| Anti-TMEM119 - for human staining | Sigma | cat#: HPA051870 |
| Anti-CCL4/MIP-1 beta – for mouse staining | R&D Systems | cat#: AF-451-NA |
| Anti-CCL4/MIP-1 beta – for human staining | R&D Systems | cat#: AF-271-NA |
| HLA-DR | Abcam | cat#: ab166777 |
| CD11b PE – for FACS | Biolegend | cat#: 101208 |
| CD45 APC/Cy7 – for FACS | Biolegend | cat#: 103116 |
| CX3CR1 APC | Biolegend | cat#: 149008 |
| Bacterial and Virus Strains | ||
| Biological Samples | ||
| Human: MS and control brain tissue | UK Multiple Sclerosis (MS) Tissue Bank | See Table S3 |
| Chemicals, Peptides, and Recombinant Proteins | ||
| Percoll | Sigma-Aldrich | cat#: P1644 |
| Ultrapure 0.5M EDTA | Invitrogen | cat#: 15575-038 |
| Bovine Serum Albumin (BSA) | Sigma-Aldrich | cat#: A2153 |
| Sudan Black | Sigma-Aldrich | cat#: 199664 |
| L-α-lyso-Lecithin (Lysolecithin), Egg Yolk | EMD Millipore | cat#: 440154 |
| Triton X-100 | Millipore Sigma | cat#: T8787 |
| Critical Commercial Assays | ||
| Chromium Single Cell 3′ Library & Gel Bead Kit v1 and v2 | 10× Genomics | cat#: 120237 (v2) |
| Chromium i7 Multiplex Kit | 10× Genomics | cat#: 120262 |
| Chromium Single Cell A Chip Kit | 10× Genomics | cat#: 120236 |
| NextSeq 500/550 High Output v2 kit (150 cycles) | Illumina | cat#: FC-404-2002 |
| RNAscope® Fluorescent Multiplex | ACD | cat#: 320850 |
| RNAscope® 2.5 HD Duplex Assay | ACD | cat#: 322430 |
| Apoe (probe) | ACD | cat#: 313271 |
| Birc5 (probe) | ACD | cat#: 422701 |
| C1qa (probe) | ACD | cat#: 441221 |
| Ccl4 (probe) | ACD | cat#: 421071 |
| Cxcl10 (probe) | ACD | cat#: 408921 |
| Fabp5 (probe) | ACD | cat#: 504331 |
| Fcrls (probe) | ACD | cat#: 441231 |
| Mif (probe) | ACD | cat#: 513801 |
| Ms4A7 (probe) | ACD | cat#: 314601 |
| Spp1 (probe) | ACD | cat#: 435191 |
| Deposited Data | ||
| Raw fastq files and digital gene expression matrixes (DGE) | This paper | acsn#: GSE121654, https://www.ncbi.nlm.nih.gov/geo/ |
| Searchable microglia gene expression website | This paper | www.microgliasinglecell.com |
| Experimental Models: Cell Lines | ||
| Experimental Models: Organisms/Strains | ||
| Mouse: C57bl/6J | Jackson Labs | stock#: 000664 |
| Oligonucleotides | ||
| Recombinant DNA | ||
| Software and Algorithms | ||
| CellProfiler | Carpenter et al. Genome Biology 2006 | Version: 2.2.0 |
| Ilastik | Sommer et al. ISBI Proceedings 2011 | Version: 1.3.0 |
| R Studio | https://www.rstudio.com/ | Version: 1.1.383 |
| R | https://www.r-project.org/ | Version: 3.5.1 |
| Seurat | Satija et al. Nat. Biotechnol 2015 | Version: 2.3.4 |
| Seurat (CCA analysis) | Butler et al. Nat. Biotechnol 2018 | Version: 2.3.4 |
| ICA Cluster | Saunders et al. Cell 2018 | Version: 2.0.0 |
| ImageJ (Fiji) | Schindelin et al. Nat. Methods 2012 | Version: 1.51 |
| Other | ||
| Dounce homogenizer – 7mL | Wheaton | cat#: 3432T40 |
| Dounce homogenizer – 2mL | Kimble Chase | cat#: 885300-0002 |
| Blue Skirted 96-well plates | Eppendorf | cat#: 30129334 |
| Hanks Balanced Salt Solution (HBSS) | Corning | cat#: 21-022-CM |
| Hamilton syringe | Hamilton | cat#: 80030 |
| Metal brain mold/slice matrix | World Precision Instruments | cat#: RBMS-200C |
| Donkey Serum | Millipore Sigma | cat#: D9663-10ML |
| ProLong™ Gold Antifade Mountant with DAPI | Invitrogen | cat#: P36931 |
| Vectashield with DAPI | Vector Laboratories | cat#: H-1200 |
| Flouromount Aqueous Mounting Medium | Sigma-Aldrich | cat#: F4680 |
Highlights.
-
-
Mouse microglia are heterogenous cells that are most diverse in the developing brain.
-
-
Unique microglia transcriptional states can be localized to many brain regions.
-
-
Small subsets of varied inflammatory microglia found in the aged brain.
-
-
Diverse activated microglia subpopulations found in mouse demyelinated lesions and human MS.
Acknowledgements
We would like to thank Dr. Richard Ransohoff, Dr. Christina Usher, and Dr. Daisy Robinton for their critical feedback and insight while preparing the manuscript. We would like to thank Jon Hammond for developing the website and searchable dataset (www.microgliasinglecell.com). This work was funded by grants from the Simons Foundation/SFARI (#346197 to S.M. and B.S.), Rettsyndrome.org mentored fellowship training award (#3214 to T.H.), Silvio O. Conte Center (NIH #P50MH112491 to B.S. and S.M.), Stanley Center for Psychiatric Illness at the Broad Institute (B.S. and S.M.), and Helen Hay Whitney Fellowship (A.S.), Lundbeck Foundation International Postdoc Fellowships (L.D-O.)
Footnotes
Publisher's Disclaimer: This is a PDF file of an unedited manuscript that has been accepted for publication. As a service to our customers we are providing this early version of the manuscript. The manuscript will undergo copyediting, typesetting, and review of the resulting proof before it is published in its final citable form. Please note that during the production process errors may be discovered which could affect the content, and all legal disclaimers that apply to the journal pertain.
Declaration of interests
The authors declare no competing interests.
References
- Baruch K, Deczkowska A, David E, Castellano JM, Miller O, Kertser A, Berkutzki T, Barnett-Itzhaki Z, Bezalel D, Wyss-Coray T, et al. (2014). Aging. Aging-induced type I interferon response at the choroid plexus negatively affects brain function. Science 346, 89–93. [DOI] [PMC free article] [PubMed] [Google Scholar]
- Bennett FC, Bennett ML, Yaqoob F, Mulinyawe SB, Grant GA, Hayden Gephart M, Plowey ED, and Barres BA (2018). A Combination of Ontogeny and CNS Environment Establishes Microglial Identity. Neuron. [DOI] [PMC free article] [PubMed] [Google Scholar]
- Bennett ML, Bennett FC, Liddelow SA, Ajami B, Zamanian JL, Fernhoff NB, Mulinyawe SB, Bohlen CJ, Adil A, Tucker A, et al. (2016). New tools for studying microglia in the mouse and human CNS. Proc Natl Acad Sci U S A 113, E1738–1746. [DOI] [PMC free article] [PubMed] [Google Scholar]
- Butler A, Hoffman P, Smibert P, Papalexi E, and Satija R (2018). Integrating single-cell transcriptomic data across different conditions, technologies, and species. Nat Biotechnol 36, 411–420. [DOI] [PMC free article] [PubMed] [Google Scholar]
- Butovsky O, Jedrychowski MP, Moore CS, Cialic R, Lanser AJ, Gabriely G, Koeglsperger T, Dake B, Wu PM, Doykan CE, et al. (2014). Identification of a unique TGF-beta-dependent molecular and functional signature in microglia. Nat Neurosci 17, 131–143. [DOI] [PMC free article] [PubMed] [Google Scholar]
- Calandra T, and Roger T (2003). Macrophage migration inhibitory factor: a regulator of innate immunity. Nat Rev Immunol 3, 791–800. [DOI] [PMC free article] [PubMed] [Google Scholar]
- Chou RC, Kim ND, Sadik CD, Seung E, Lan Y, Byrne MH, Haribabu B, Iwakura Y, and Luster AD (2010). Lipid-cytokine-chemokine cascade drives neutrophil recruitment in a murine model of inflammatory arthritis. Immunity 33, 266–278. [DOI] [PMC free article] [PubMed] [Google Scholar]
- Elmore MR, Najafi AR, Koike MA, Dagher NN, Spangenberg EE, Rice RA, Kitazawa M, Matusow B, Nguyen H, West BL, et al. (2014). Colony-stimulating factor 1 receptor signaling is necessary for microglia viability, unmasking a microglia progenitor cell in the adult brain. Neuron 82, 380–397. [DOI] [PMC free article] [PubMed] [Google Scholar]
- Eon Kuek L, Leffler M, Mackay GA, and Hulett MD (2016). The MS4A family: counting past 1, 2 and 3. Immunol Cell Biol 94, 11–23. [DOI] [PubMed] [Google Scholar]
- Everts B, Amiel E, Huang SC, Smith AM, Chang CH, Lam WY, Redmann V, Freitas TC, Blagih J, van der Windt GJ, et al. (2014). TLR-driven early glycolytic reprogramming via the kinases TBK1-IKKvarepsilon supports the anabolic demands of dendritic cell activation. Nat Immunol 15, 323–332. [DOI] [PMC free article] [PubMed] [Google Scholar]
- Franceschi C, Capri M, Monti D, Giunta S, Olivieri F, Sevini F, Panourgia MP, Invidia L, Celani L, Scurti M, et al. (2007). Inflammaging and anti-inflammaging: a systemic perspective on aging and longevity emerged from studies in humans. Mech Ageing Dev 128, 92–105. [DOI] [PubMed] [Google Scholar]
- Fuger P, Hefendehl JK, Veeraraghavalu K, Wendeln AC, Schlosser C, Obermuller U, Wegenast-Braun BM, Neher JJ, Martus P, Kohsaka S, et al. (2017). Microglia turnover with aging and in an Alzheimer’s model via long-term in vivo single-cell imaging. Nat Neurosci 20, 1371–1376. [DOI] [PubMed] [Google Scholar]
- Furuichi K, Gao JL, Horuk R, Wada T, Kaneko S, and Murphy PM (2008). Chemokine receptor CCR1 regulates inflammatory cell infiltration after renal ischemia-reperfusion injury. J Immunol 181, 8670–8676. [DOI] [PMC free article] [PubMed] [Google Scholar]
- Gadani SP, Walsh JT, Lukens JR, and Kipnis J (2015). Dealing with Danger in the CNS: The Response of the Immune System to Injury. Neuron 87, 47–62. [DOI] [PMC free article] [PubMed] [Google Scholar]
- Gilchrist M, Thorsson V, Li B, Rust AG, Korb M, Roach JC, Kennedy K, Hai T, Bolouri H, and Aderem A (2006). Systems biology approaches identify ATF3 as a negative regulator of Toll-like receptor 4. Nature 441, 173–178. [DOI] [PubMed] [Google Scholar]
- Ginhoux F, Greter M, Leboeuf M, Nandi S, See P, Gokhan S, Mehler MF, Conway SJ, Ng LG, Stanley ER, et al. (2010). Fate mapping analysis reveals that adult microglia derive from primitive macrophages. Science 330, 841–845. [DOI] [PMC free article] [PubMed] [Google Scholar]
- Goldmann T, Wieghofer P, Jordao MJ, Prutek F, Hagemeyer N, Frenzel K, Amann L, Staszewski O, Kierdorf K, Krueger M, et al. (2016). Origin, fate and dynamics of macrophages at central nervous system interfaces. Nat Immunol 17, 797–805. [DOI] [PMC free article] [PubMed] [Google Scholar]
- Gosselin D, Link VM, Romanoski CE, Fonseca GJ, Eichenfield DZ, Spann NJ, Stender JD, Chun HB, Garner H, Geissmann F, et al. (2014). Environment drives selection and function of enhancers controlling tissue-specific macrophage identities. Cell 159, 1327–1340. [DOI] [PMC free article] [PubMed] [Google Scholar]
- Grabert K, Michoel T, Karavolos MH, Clohisey S, Baillie JK, Stevens MP, Freeman TC, Summers KM, and McColl BW (2016). Microglial brain region-dependent diversity and selective regional sensitivities to aging. Nat Neurosci 19, 504–516. [DOI] [PMC free article] [PubMed] [Google Scholar]
- Greer PL, Bear DM, Lassance JM, Bloom ML, Tsukahara T, Pashkovski SL, Masuda FK, Nowlan AC, Kirchner R, Hoekstra HE, et al. (2016). A Family of non-GPCR Chemosensors Defines an Alternative Logic for Mammalian Olfaction. Cell 165, 1734–1748. [DOI] [PMC free article] [PubMed] [Google Scholar]
- Hagemeyer N, Hanft KM, Akriditou MA, Unger N, Park ES, Stanley ER, Staszewski O, Dimou L, and Prinz M (2017). Microglia contribute to normal myelinogenesis and to oligodendrocyte progenitor maintenance during adulthood. Acta Neuropathol 134, 441–458. [DOI] [PMC free article] [PubMed] [Google Scholar]
- Hall SM (1972). The effect of injections of lysophosphatidyl choline into white matter of the adult mouse spinal cord. J Cell Sci 10, 535–546. [DOI] [PubMed] [Google Scholar]
- Hammond TR, Gadea A, Dupree J, Kerninon C, Nait-Oumesmar B, Aguirre A, and Gallo V (2014). Astrocyte-derived endothelin-1 inhibits remyelination through notch activation. Neuron 81, 588–602. [DOI] [PMC free article] [PubMed] [Google Scholar]
- Hanamsagar R, Alter MD, Block CS, Sullivan H, Bolton JL, and Bilbo SD (2017). Generation of a microglial developmental index in mice and in humans reveals a sex difference in maturation and immune reactivity. Glia 65, 1504–1520. [DOI] [PMC free article] [PubMed] [Google Scholar]
- Hickman SE, Kingery ND, Ohsumi TK, Borowsky ML, Wang LC, Means TK, and El Khoury J (2013). The microglial sensome revealed by direct RNA sequencing. Nat Neurosci 16, 1896–1905. [DOI] [PMC free article] [PubMed] [Google Scholar]
- Hollingworth P, Harold D, Sims R, Gerrish A, Lambert JC, Carrasquillo MM, Abraham R, Hamshere ML, Pahwa JS, Moskvina V, et al. (2011). Common variants at ABCA7, MS4A6A/MS4A4E, EPHA1, CD33 and CD2AP are associated with Alzheimer’s disease. Nat Genet 43, 429–435. [DOI] [PMC free article] [PubMed] [Google Scholar]
- Hong S, Beja-Glasser VF, Nfonoyim BM, Frouin A, Li S, Ramakrishnan S, Merry KM, Shi Q, Rosenthal A, Barres BA, et al. (2016). Complement and microglia mediate early synapse loss in Alzheimer mouse models. Science 352, 712–716. [DOI] [PMC free article] [PubMed] [Google Scholar]
- Kannan-Thulasiraman P, Seachrist DD, Mahabeleshwar GH, Jain MK, and Noy N (2010). Fatty acid-binding protein 5 and PPARbeta/delta are critical mediators of epidermal growth factor receptor-induced carcinoma cell growth. J Biol Chem 285, 19106–19115. [DOI] [PMC free article] [PubMed] [Google Scholar]
- Karperien A, Ahammer H, and Jelinek HF (2013). Quantitating the subtleties of microglial morphology with fractal analysis. Front Cell Neurosci 7, 3. [DOI] [PMC free article] [PubMed] [Google Scholar]
- Keren-Shaul H, Spinrad A, Weiner A, Matcovitch-Natan O, Dvir-Szternfeld R, Ulland TK, David E, Baruch K, Lara-Astaiso D, Toth B, et al. (2017). A Unique Microglia Type Associated with Restricting Development of Alzheimer’s Disease. Cell 169, 1276–1290 e1217. [DOI] [PubMed] [Google Scholar]
- Lavin Y, Winter D, Blecher-Gonen R, David E, Keren-Shaul H, Merad M, Jung S, and Amit I (2014). Tissue-resident macrophage enhancer landscapes are shaped by the local microenvironment. Cell 159, 1312–1326. [DOI] [PMC free article] [PubMed] [Google Scholar]
- Liddelow SA, Guttenplan KA, Clarke LE, Bennett FC, Bohlen CJ, Schirmer L, Bennett ML, Munch AE, Chung WS, Peterson TC, et al. (2017). Neurotoxic reactive astrocytes are induced by activated microglia. Nature 541, 481–487. [DOI] [PMC free article] [PubMed] [Google Scholar]
- Liu RZ, Mita R, Beaulieu M, Gao Z, and Godbout R (2010). Fatty acid binding proteins in brain development and disease. Int J Dev Biol 54, 1229–1239. [DOI] [PubMed] [Google Scholar]
- Love MI, Huber W, and Anders S (2014). Moderated estimation of fold change and dispersion for RNA-seq data with DESeq2. Genome Biol 15, 550. [DOI] [PMC free article] [PubMed] [Google Scholar]
- Ma J, Yu JT, and Tan L (2015). MS4A Cluster in Alzheimer’s Disease. Mol Neurobiol 51, 1240–1248. [DOI] [PubMed] [Google Scholar]
- Macosko EZ, Basu A, Satija R, Nemesh J, Shekhar K, Goldman M, Tirosh I, Bialas AR, Kamitaki N, Martersteck EM, et al. (2015). Highly Parallel Genome-wide Expression Profiling of Individual Cells Using Nanoliter Droplets. Cell 161, 1202–1214. [DOI] [PMC free article] [PubMed] [Google Scholar]
- Matcovitch-Natan O, Winter DR, Giladi A, Vargas Aguilar S, Spinrad A, Sarrazin S, Ben-Yehuda H, David E, Zelada Gonzalez F, Perrin P, et al. (2016). Microglia development follows a stepwise program to regulate brain homeostasis. Science 353, aad8670. [DOI] [PubMed] [Google Scholar]
- Mathys H, Adaikkan C, Gao F, Young JZ, Manet E, Hemberg M, De Jager PL, Ransohoff RM, Regev A, and Tsai LH (2017). Temporal Tracking of Microglia Activation in Neurodegeneration at Single-Cell Resolution. Cell Rep 21, 366–380. [DOI] [PMC free article] [PubMed] [Google Scholar]
- Mills EL, Kelly B, Logan A, Costa ASH, Varma M, Bryant CE, Tourlomousis P, Dabritz JHM, Gottlieb E, Latorre I, et al. (2016). Succinate Dehydrogenase Supports Metabolic Repurposing of Mitochondria to Drive Inflammatory Macrophages. Cell 167, 457–470 e413. [DOI] [PMC free article] [PubMed] [Google Scholar]
- Miron VE, Boyd A, Zhao JW, Yuen TJ, Ruckh JM, Shadrach JL, van Wijngaarden P, Wagers AJ, Williams A, Franklin RJM, et al. (2013). M2 microglia and macrophages drive oligodendrocyte differentiation during CNS remyelination. Nat Neurosci 16, 1211–1218. [DOI] [PMC free article] [PubMed] [Google Scholar]
- Montagne A, Barnes SR, Sweeney MD, Halliday MR, Sagare AP, Zhao Z, Toga AW, Jacobs RE, Liu CY, Amezcua L, et al. (2015). Blood-brain barrier breakdown in the aging human hippocampus. Neuron 85, 296–302. [DOI] [PMC free article] [PubMed] [Google Scholar]
- Murman DL (2015). The Impact of Age on Cognition. Semin Hear 36, 111–121. [DOI] [PMC free article] [PubMed] [Google Scholar]
- Murray PJ, Allen JE, Biswas SK, Fisher EA, Gilroy DW, Goerdt S, Gordon S, Hamilton JA, Ivashkiv LB, Lawrence T, et al. (2014). Macrophage activation and polarization: nomenclature and experimental guidelines. Immunity 41, 14–20. [DOI] [PMC free article] [PubMed] [Google Scholar]
- Naj AC, Jun G, Beecham GW, Wang LS, Vardarajan BN, Buros J, Gallins PJ, Buxbaum JD, Jarvik GP, Crane PK, et al. (2011). Common variants at MS4A4/MS4A6E, CD2AP, CD33 and EPHA1 are associated with late-onset Alzheimer’s disease. Nat Genet 43, 436–441. [DOI] [PMC free article] [PubMed] [Google Scholar]
- O’Neill LA, and Pearce EJ (2016). Immunometabolism governs dendritic cell and macrophage function. J Exp Med 213, 15–23. [DOI] [PMC free article] [PubMed] [Google Scholar]
- Paloneva J, Kestila M, Wu J, Salminen A, Bohling T, Ruotsalainen V, Hakola P, Bakker AB, Phillips JH, Pekkarinen P, et al. (2000). Loss-of-function mutations in TYROBP (DAP12) result in a presenile dementia with bone cysts. Nat Genet 25, 357–361. [DOI] [PubMed] [Google Scholar]
- Politis M, Su P, and Piccini P (2012). Imaging of microglia in patients with neurodegenerative disorders. Front Pharmacol 3, 96. [DOI] [PMC free article] [PubMed] [Google Scholar]
- Poon HF, Calabrese V, Scapagnini G, and Butterfield DA (2004). Free radicals and brain aging. Clin Geriatr Med 20, 329–359. [DOI] [PubMed] [Google Scholar]
- Rademakers R, Baker M, Nicholson AM, Rutherford NJ, Finch N, Soto-Ortolaza A, Lash J, Wider C, Wojtas A, DeJesus-Hernandez M, et al. (2011). Mutations in the colony stimulating factor 1 receptor (CSF1R) gene cause hereditary diffuse leukoencephalopathy with spheroids. Nat Genet 44, 200–205. [DOI] [PMC free article] [PubMed] [Google Scholar]
- Ransohoff RM (2016). A polarizing question: do M1 and M2 microglia exist? Nat Neurosci 19, 987–991. [DOI] [PubMed] [Google Scholar]
- Salter MW, and Stevens B (2017). Microglia emerge as central players in brain disease. Nat Med 23, 1018–1027. [DOI] [PubMed] [Google Scholar]
- Satija R, Farrell JA, Gennert D, Schier AF, and Regev A (2015). Spatial reconstruction of single-cell gene expression data. Nat Biotechnol 33, 495–502. [DOI] [PMC free article] [PubMed] [Google Scholar]
- Saunders A, Macosko EZ, Wysoker A, Goldman M, Krienen FM, de Rivera H, Bien E, Baum M, Bortolin L, Wang S, et al. (2018). Molecular Diversity and Specializations among the Cells of the Adult Mouse Brain. Cell 174, 1015–1030 e1016. [DOI] [PMC free article] [PubMed] [Google Scholar]
- Schafer DP, and Stevens B (2015). Microglia Function in Central Nervous System Development and Plasticity. Cold Spring Harb Perspect Biol 7, a020545. [DOI] [PMC free article] [PubMed] [Google Scholar]
- Sekar A, Bialas AR, de Rivera H, Davis A, Hammond TR, Kamitaki N, Tooley K, Presumey J, Baum M, Van Doren V, et al. (2016). Schizophrenia risk from complex variation of complement component 4. Nature 530, 177–183. [DOI] [PMC free article] [PubMed] [Google Scholar]
- Smith EE, Schneider JA, Wardlaw JM, and Greenberg SM (2012). Cerebral microinfarcts: the invisible lesions. Lancet Neurol 11, 272–282. [DOI] [PMC free article] [PubMed] [Google Scholar]
- Squarzoni P, Oller G, Hoeffel G, Pont-Lezica L, Rostaing P, Low D, Bessis A, Ginhoux F, and Garel S (2014). Microglia modulate wiring of the embryonic forebrain. Cell Rep 8, 1271–1279. [DOI] [PubMed] [Google Scholar]
- Szczucinski A, and Losy J (2007). Chemokines and chemokine receptors in multiple sclerosis. Potential targets for new therapies. Acta Neurol Scand 115, 137–146. [DOI] [PubMed] [Google Scholar]
- Takeuchi H, Jin S, Wang J, Zhang G, Kawanokuchi J, Kuno R, Sonobe Y, Mizuno T, and Suzumura A (2006). Tumor necrosis factor-alpha induces neurotoxicity via glutamate release from hemichannels of activated microglia in an autocrine manner. J Biol Chem 281, 21362–21368. [DOI] [PubMed] [Google Scholar]
- Thion MS, Low D, Silvin A, Chen J, Grisel P, Schulte-Schrepping J, Blecher R, Ulas T, Squarzoni P, Hoeffel G, et al. (2018). Microbiome Influences Prenatal and Adult Microglia in a Sex-Specific Manner. Cell 172, 500–516 e516. [DOI] [PMC free article] [PubMed] [Google Scholar]
- Ueno M, Fujita Y, Tanaka T, Nakamura Y, Kikuta J, Ishii M, and Yamashita T (2013). Layer V cortical neurons require microglial support for survival during postnatal development. Nat Neurosci 16, 543–551. [DOI] [PubMed] [Google Scholar]
- Weber C, Weber KS, Klier C, Gu S, Wank R, Horuk R, and Nelson PJ (2001). Specialized roles of the chemokine receptors CCR1 and CCR5 in the recruitment of monocytes and T(H)1-like/CD45RO(+) T cells. Blood 97, 1144–1146. [DOI] [PubMed] [Google Scholar]
- Wlodarczyk A, Holtman IR, Krueger M, Yogev N, Bruttger J, Khorooshi R, Benmamar-Badel A, de Boer-Bergsma JJ, Martin NA, Karram K, et al. (2017). A novel microglial subset plays a key role in myelinogenesis in developing brain. EMBO J 36, 3292–3308. [DOI] [PMC free article] [PubMed] [Google Scholar]
- Wong K, Noubade R, Manzanillo P, Ota N, Foreman O, Hackney JA, Friedman BA, Pappu R, Scearce-Levie K, and Ouyang W (2017). Mice deficient in NRROS show abnormal microglial development and neurological disorders. Nat Immunol 18, 633–641. [DOI] [PubMed] [Google Scholar]
- Xu H, Chen M, Manivannan A, Lois N, and Forrester JV (2008). Age-dependent accumulation of lipofuscin in perivascular and subretinal microglia in experimental mice. Aging Cell 7, 58–68. [DOI] [PubMed] [Google Scholar]
- Ye L, Huang Y, Zhao L, Li Y, Sun L, Zhou Y, Qian G, and Zheng JC (2013). IL-1beta and TNF-alpha induce neurotoxicity through glutamate production: a potential role for neuronal glutaminase. J Neurochem 125, 897–908. [DOI] [PMC free article] [PubMed] [Google Scholar]
- Zheng GX, Terry JM, Belgrader P, Ryvkin P, Bent ZW, Wilson R, Ziraldo SB, Wheeler TD, McDermott GP, Zhu J, et al. (2017). Massively parallel digital transcriptional profiling of single cells. Nat Commun 8, 14049. [DOI] [PMC free article] [PubMed] [Google Scholar]
- Zrzavy T, Hametner S, Wimmer I, Butovsky O, Weiner HL, and Lassmann H (2017). Loss of ‘homeostatic’ microglia and patterns of their activation in active multiple sclerosis. Brain 140, 1900–1913. [DOI] [PMC free article] [PubMed] [Google Scholar]
Associated Data
This section collects any data citations, data availability statements, or supplementary materials included in this article.
Supplementary Materials
Data Availability Statement
Raw fastq files and Cell Ranger 1.2 processed digital gene expression matrixes (DGE) for each animal/sample in the NIH GEO database (GSE121654).