Abstract
This experimental study explored the response of burning liquid fuel droplets to one-dimensional acoustic standing waves created within a closed, atmospheric waveguide. Building upon prior droplet combustion studies quantifying mean and temporal flame response of several alternative fuels to moderate acoustic excitation (Sevilla-Esparza, et al., Combustion and Flame, 161(6):1604–1619, 2014), the present work focused on higher amplitude acoustic forcing observed to create periodic partial extinction and reignition (PPER) of flames enveloping the droplet. Detailed examination of ethanol droplets exposed to a range of acoustic forcing conditions (frequencies and amplitudes in the vicinity of a pressure node) yielded several different combustion regimes: one with sustained oscillatory flames, one with PPER, and then full extinction at very high excitation amplitudes. Phase-locked OH* chemiluminescence imaging and local temporal pressure measurements allowed quantification of the combustion-acoustic coupling through the local Rayleigh index. Similar behavior was observed for JP-8 and liquid synthetic fuel derived via the Fischer-Tropsch process, but with quantitative differences based on different reaction time scales. Estimates of the mean and oscillatory strain rates experienced by the flames during excitation assisted with interpreting specific relationships among acoustic, chemical, and fluid mechanical/straining time scales that can lead to a greater understanding of PPER.
Keywords: Acoustically-coupled combustion, Droplet combustion, Periodic partial extinction, reignition
1. Introduction
Acoustically coupled combustion instabilities have been a major challenge in the development of liquid rocket engines (LREs) and gas turbine engines over many decades [1, 2]. Typically, these instabilities are spontaneously excited, and are characterized by large-scale, self-sustained pressure oscillations corresponding to a natural acoustic mode of the combustion chamber [2, 3, 4]. Large scale combustion instabilities are generally associated with a feedback cycle among temporal velocity oscillations u′, pressure oscillations p′, and oscillatory heat release q′ in the reactive system, resulting in enhancement of the instability when the latter two parameters are in phase, or nearly so, per the well-known Rayleigh criterion [5]. Conversely, when pressure and heat release oscillations are out of phase with respect to one another, there is suggested to be a dampening of the instability [6]. For a reactive system, combustion instability can be described mathematically over an acoustic period T using the Rayleigh index G at a given location x as
| (1) |
where a positive G value denotes in-phase fluctuations of pressure and heat release and hence instability, while out-of-phase p′ and q′ lead to a negative G value and presumably stable combustion. Although the Rayleigh criterion has been shown to be consistent with naturally occurring thermo-acoustic instabilities in a large number of combustion systems [3], relating the bulk properties of the reactive system to the detailed acoustically-coupled flame dynamics is a topic of great interest, especially in the context of alternative fuels and their use in established combustor systems.
The single isolated burning fuel droplet represents a heterogeneous reactive process that provides a fundamental means to investigate condensed phase combustion relevant to both air-breathing and rocket engine systems. Evaporation at the droplet surface acts as a source of fuel vapor which reacts with the surrounding oxidizer, forming a diffusion flame structure. While in reactive liquid sprays the flame generally surrounds the spray itself [7], causing the behavior of individual burning droplets to be a necessary component of models for such sprays [8]. Further, fundamental reactive processes associated with single droplet combustion are relevant to numerous multiphase reactive systems, including those shown to be susceptible to self-excitation of combustion instabilities [9, 10, 11, 12, 13, 14, 15].
Over the past decade our group has examined burning fuel droplets within a controlled acoustic environment to explore fundamental acoustically-coupled combustion processes in normal gravity and microgravity [16, 17, 18]. Recent normal gravity experiments quantify global flame properties (e.g., bulk flame deflections and mean droplet burning rate constant K) as well as temporally oscillatory parameters (e.g., acoustic pressure p′ and flame OH* chemiluminescent intensity I′) throughout the acoustic cycle, from which the Rayleigh index G may be extracted. For all four fuels examined in Sevilla, et al. [16], bulk flame deflection characteristics are qualitatively consistent with the notion of a spatially variable acoustic radiation force causing the flame to deflect away from the pressure node (PN), as theorized by Tanabe et al. [19, 20, 21] for burning droplets and heated objects in microgravity. Enhancement of the droplet burning rate constant K under acoustic excitation in the vicinity of a PN, due to increased heat/mass transfer rates and larger velocity perturbations, has also been observed.
In normal gravity, buoyancy effects can become more significant than the influence of acoustic excitation, depending on the amplitude of acoustic excitation and the nature of the standing wave. As documented in Dattarajan, et al. [18, 22], for example, methanol droplets situated near a pressure node or velocity antinode (VAN) in normal gravity produce only very moderate increases in burning rate, about 11–15% higher than for unforced, burning droplets. In microgravity, on the other hand, the absence of natural convection due to buoyancy reduces the unforced droplet’s burning rate constant, so with the application of acoustic excitation, burning rate constants have been documented to increase by 85% to over 200% in the vicinity of a PN [18, 19].
In our group’s prior acoustically-coupled droplet combustion study [16], for both alcohol fuels (ethanol, methanol) and sooting hydrocarbons (JP-8, Fischer-Tropsch synfuel), the strongest degree of flame-acoustic coupling observed under moderate excitation occurred for droplets situated near a PN (or VAN) at relatively low frequency excitation (that is, 332 Hz, corresponding to the one-half wave mode for the waveguide), as long as a minimum amplitude of excitation was maintained, of the order , where represents the pressure amplitude at the PAN closest to the PN at x = 0. This corresponds to a VAN of in the vicinity of the burning droplet. Preliminary studies [17], however, suggest that at higher amplitude excitation conditions, prior to complete flame extinction, fuel droplets can experience periodic partial extinction and reignition (PPER) of the oscillating flame structure. The present study more fully characterizes the acoustic excitation conditions (frequency, amplitude, and position relative to the PN) that lead to PPER, demonstrating for the first time that this phenomenon can occur with several alternative fuels under various acoustic forcing conditions. The present study discusses the phenomena in the context of prior theoretical predictions of PPER for strained opposed flow diffusion flames [23]. There is a focus in the present study on ethanol fuel in particular, but other hydrocarbon fuels were also explored which, together with accompanying local flame strain rate estimates, enabled a more fundamental understanding of acoustically-coupled flame dynamics.
2. Experiment setup and data processing
2.1. Acoustic field
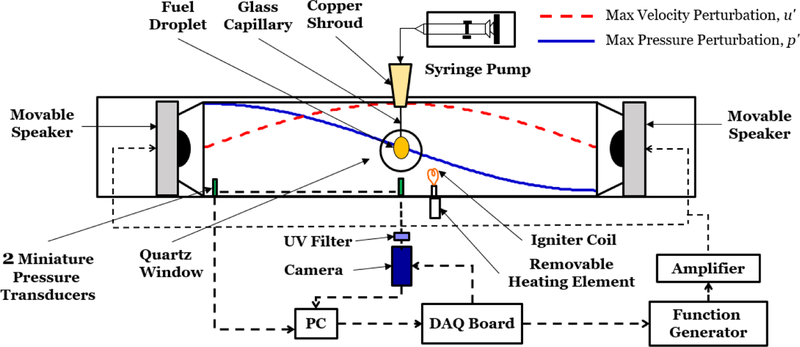
The current study investigated the behavior of liquid hydrocarbon fuel droplets burning within a closed, optically-accessible cylindrical waveguide, operating at atmospheric pressure and with loudspeakers situated at each end (see Fig. 1), as used in prior experiments [16]. As is necessary for phase-locked, long duration imaging, the burning droplet was continuously fed through a borosilicate glass capillary by a syringe pump and fixed in place at the geometrical center of the waveguide tube. This enabled droplet combustion to take place over many minutes, rather than in a few seconds typical of non-fed, suspended droplet experiments. The acoustic drivers were forced at frequencies low enough to create effectively one-dimensional planar waves to which the burning droplets were exposed. When the loudspeakers operate out of phase (∆ϕ = 180°), standing acoustic waves with a PN and corresponding VAN mid-way between the speakers can be created. The speakers could be moved relative to the geometrical center of the waveguide, with a fixed distance between them, to effectively alter the droplet location relative to the PN/VAN.
Figure 1:
Droplet experiment test facility consisting of the acoustic waveguide, droplet feed system, measurement diagnostics and data acquisition system. Sample waveforms for the acoustic pressure p′ and velocity u′ are depicted for the droplet located at the pressure node.
Forcing frequencies fa of 332 Hz, 586 Hz, and 898 Hz were explored in the present study, corresponding to standing wave resonant conditions with a PN at the tube center for two different waveguide lengths. Earlier studies [16] explored even higher frequency excitation at 1500 Hz, but much higher amplitude forcing than practical would have been required to study such frequencies under the present conditions of interest. In order to create a standing wave resonance within the waveguide, fa relates to the waveguide length (distance between speakers), L, and ambient speed of sound c by
| (2) |
where n is an odd integer value corresponding to the resonance number (e.g. n = 1, 3, 5 etc.). A waveguide length of L = 61 cm was implemented for the forcing frequencies of 332 Hz (n = 1) and 898 Hz (n = 3), while L = 31 cm was implemented to permit fa = 586 Hz to correspond to the first resonance. As described in Dattarajan et al. [18] and Sevilla et al. [16], the speakers acted as non-perfectly reflecting boundaries, causing the actual and theoretical resonant frequencies and corresponding wavelengths (λ = c/fa) to deviate from one another, as shown in Table 1.
Table 1:
Theoretical and experimental resonant frequencies and wavelengths
| Speaker Operation (180° out of phase) with PN at x = 0 cm | |||||
|---|---|---|---|---|---|
| Theoretical | Experimental | ||||
| n | L | fa,th [Hz] | λth [cm] | fa,exp [Hz] | λexp [cm] |
| 1 | 61 | 281 | 122 | 332 | 103 |
| 1 | 31 | 553 | 62 | 586 | 58.5 |
| 3 | 61 | 843 | 40.7 | 898 | 38.2 |
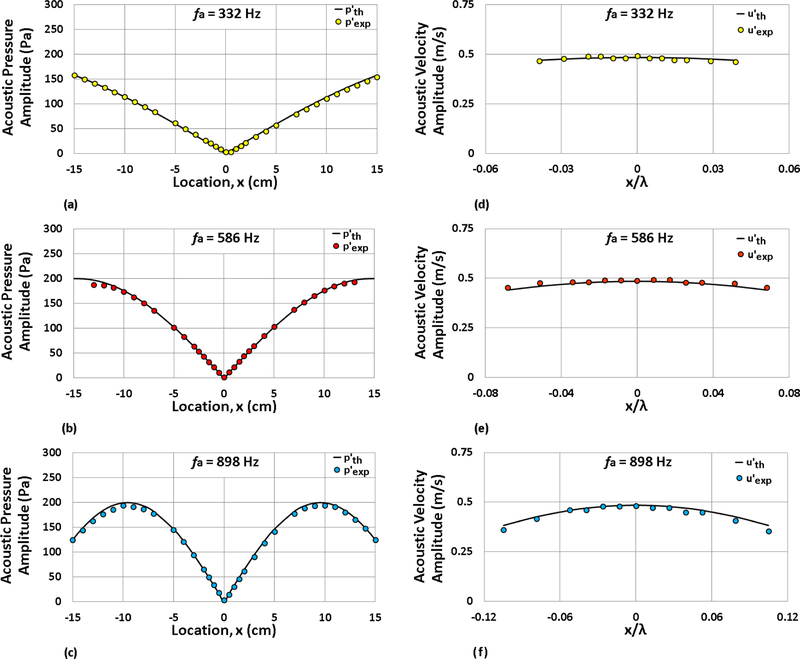
In our previous work [16], the symmetry of the acoustic pressure profile within the waveguide was achieved through the use of two speakers bounding the waveguide, found to be superior to the prior speaker-reflector system [18, 22]. In these prior experiments, sinusoidal forcing signals were generated using LabVIEW™ in conjunction with a National Instruments USB-6251 data acquisition board (DAQ) and output to the speakers through a constant voltage gain stereo amplifier. To reduce asymmetries in the vicinity of the PN [24] and to more accurately obtain the desired pressure amplitude at the pressure antinode (PAN), a new tuning procedure was recently created [25], incorporating feedback control using a Kulite XCS-093–5D miniature pressure transducer located at the PAN between the droplet and closest speaker. The efficiency of this procedures is shown, for example, in Figs. 2(a) - (c), which demonstrate very close agreement between the experimental and theoretical (desired) acoustic pressure perturbation amplitude profiles for the three forcing frequencies at .
Figure 2:
Experimental and theoretical acoustic pressure perturbation amplitude profiles (at locations x/λ within the waveguide) are shown at forcing frequencies (a) 332 Hz, (b) 586 Hz, and (c) 898 Hz. The maximum pressure amplitude at the nearest PAN was = 200 Pa. Corresponding experimental and theoretical acoustic velocity perturbation amplitude profiles are shown at forcing frequencies (d) 332 Hz, (e) 586 Hz, and (f) 898 Hz for = 200 Pa.
For the one-dimensional planar waves generated within the waveguide, the pressure and velocity perturbation fields are related through the linearized momentum equation, yielding an expression for the perturbation pressure associated with a standing wave with a PN at the geometric center (x = 0):
| (3) |
The perturbation velocity field u′(x, t) is then satisfied by
| (4) |
Experimental verification of the perturbation velocity within the waveguide, Eq. (4), was obtained using a Dantec Dynamics 55P11 hot-wire anemometer located at the geometrical center of the waveguide. For calibration, the procedure described in Huelsz and López-Alquicira [26] for an oscillatory flow field arising from acoustic forcing in the absence of mean flow was implemented. The anemometer probe was placed at x = 0 and voltage measurements were acquired for acoustic excitation amplitudes ranging from 0 – 280 Pa in increments of 10 Pa. These voltage measurements were correlated with the theoretical velocity at the probe location from Eq. (4), and repeated for each of the three acoustic forcing frequencies.
Experimental results showing velocity perturbation amplitudes in the vicinity of the PN for each of the three forcing frequencies, at an excitation amplitude (measured at the pressure antinode PAN closest to the PN), are shown in Figs. 2(d) - (f). Note that VAN velocity perturbation amplitudes near the PN are of the order for this condition. Data points for velocity perturbations smaller than the calibration range and the accuracy of the hot wire are not shown. For each forcing frequency, there was close agreement observed between the theoretical and experimental velocity perturbation amplitudes; this allowed the p′ measurement in the vicinity of the droplet location to be used to estimate the local u′ during droplet burning experiments via Eq. (4).
2.2. Optical diagnostics and local pressure measurements
Phase-locked imaging was carried out using a Nanostar ICCD camera equipped with a U-330 bandpass filter and UV lens, permitting the capture of chemiluminescence from the electronically excited hydroxyl radical, OH*, within the flame surrounding the droplet. During combustion, many intermediate chemical radicals are formed and consumed to advance the chemical mechanism to the final products. The electronically excited hydroxyl radical is generated during hydrocarbon combustion through the intermediate reaction involving methylidyne (CH) and diatomic oxygen [27], given by
| (5) |
The deexcitation reaction of the OH* radical
| (6) |
is the step which produces the chemiluminescent intensity UV light centered around 308 nm. The U-330 filter yields maximum transmission of UV light centered around 308 nm, with a FWHM of 140 nm. Typical flame spectra for hydrocarbon combustion in the range 300–400 nm yield primarily the hydroxl radical, with a negligible amount of other species such as formaldehyde (H2CO*) in comparison to OH*, as demonstrated by Kojima et. al [28]. Hence the chemiluminescence captured using the ICCD camera is that of OH*, which, is known to be a marker of heat release rate in a variety of premixed systems [29, 30, 31, 32, 33], and is also associated with flame position and primary reaction zones, as well as maximum temperature regions in diffusion flames associated with burning droplets within microgravity environments [34, 35].
Simultaneous to the OH* chemiluminescence imaging, pressure measurements within the waveguide were obtained via a Kulite XCS-093–5D miniature pressure transducer embedded in the waveguide wall and located at the droplet’s axial position. The Nanostar camera was triggered using the acoustic forcing signal output by the USB-6251 DAQ board with a specific time delay associated with the desired phase. Each captured image was comprised of multiple gate activations of the camera at the same phase in the acoustic cycle, where the gate activation interval △tgate was a specified fraction of the acoustic time period (△tgate = Ta/72 = 1/72fa). Images and corresponding pressure measurements were taken in a phase-locked manner at △ϕ = 24° intervals to produce a detailed temporal profile, i.e., with fifteen points per acoustic cycle. Each of the fifteen data points per cycle, images in the case of OH* chemiluminescence and pressure in the case of pressure perturbations, was averaged over 250 realizations. Typically, each experiment produced temporal data comprising three to four acoustic cycles, until the experiment was concluded or the air within the waveguide was consumed, causing the continuously-fed droplet to cease burning.
2.3. Flame imaging and burning droplet parameters
When a burning fuel droplet is exposed to standing wave excitation in normal gravity, Tanabe et al. [19, 20, 21] theorize the existence of a bulk acoustic radiation force fa acting upon the burning droplet system, with a mathematical form similar to that of a buoyancy force Fb = go(ρp − ρo)V, where ρo is the density of the ambient air, ρp is the density of hot combustion products and other gases surrounding the droplet, go is gravitational acceleration, and V is the volume of the (spherical) flame and droplet system. These forces are suggested to act on the volume of high temperature combustion gases [19, 20, 21], so that the acoustic radiation force takes the form:
| (7) |
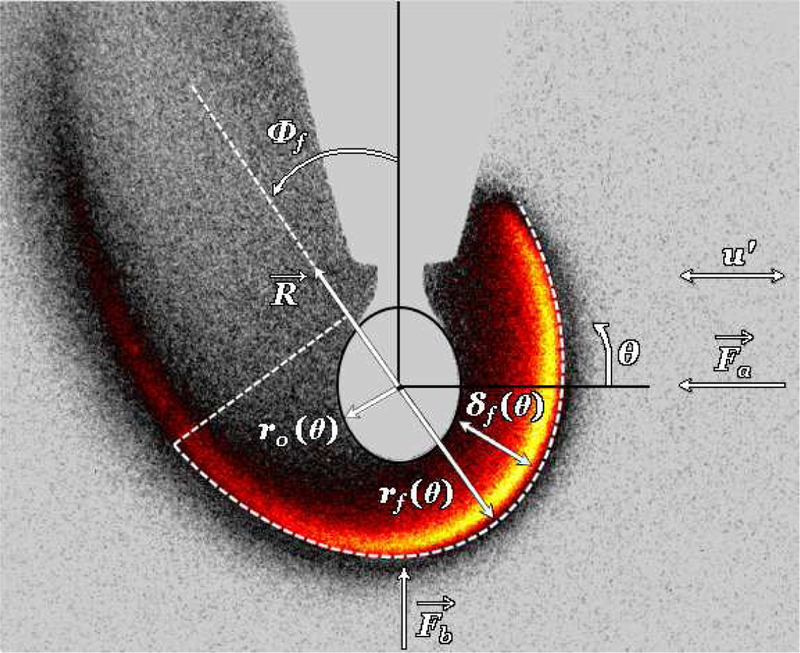
Here α is a constant parameter found to be close to unity [19, 20, 21], and the acoustic acceleration ga takes the form which can be determined mathematically from Eq. (4), as described in Sevilla et al. (2014). The resultant force R from acoustic radiation and buoyancy forces causes the bulk flame to deflect away from the PN, documented in Sevilla et al. (2014) for all conditions explored. Figure 3, for example, shows an OH* chemiluminescence image of an acoustically forced burning fuel droplet positioned 0.029 wavelengths to the left of the pressure node. Hence the measured acoustic acceleration ga can be determined experimentally from the flame deflection angle ϕf, per
| (8) |
as described in our earlier exploration (Sevilla 2014), where the flame shape is fitted to an ellipse to determine the major axis, and thus angle ϕf, via a MATLAB™ script.
Figure 3:
OH* chemiluminescence image showing the reference frame and relevant dimensions for an acoustically forced flame at = 150 Pa and droplet position x/λ = −0.029. Under acoustic excitation, the resultant R of the buoyancy force Fb and acoustic radiation force fa cause the flame to bulk deflect away from the pressure node, where Φf 6= 0. The droplet radius ro, flame radius rf and local standoff distance δf are all functions of θ, which is shown in the designated polar coordinate system where its origin is located at the droplet center.
Figure 3 also labels the polar coordinate system of the deflected flame and the relevant dimensions that describe the burning droplet. These include the droplet radius ro, flame standoff distance δf and flame radius rf. The flame standoff distance δf is defined as the distance between the local flame radius and droplet radius, i.e., δf ≡ rf − ro, where both rf and ro are functions of θ and measured from the droplet center. As the analysis is focused on the flame stagnation region with respect to the locally one-dimensional transverse acoustic oscillations, δf was tracked at either θ = 0° or θ = 180°, depending on the direction of deflection. Under acoustic excitation, the flame itself, and thus the radius, oscillated throughout the acoustic cycle, causing the horizontal flame standoff distance to have both a mean and oscillatory component, .
The droplet shape, however, varied relatively little during the course of the experiments, due to the continual feeding of the droplet via the syringe pump and capillary. A specially designed algorithm utilizing the MATLAB™ edge detection code permitted the local droplet radius ro to be determined. As described in Dattarajan (2006) and Sevilla (2014), the instantaneous burning rate constant K for a continuously-fed fuel droplet is derived from the continuity equation and takes the form
| (9) |
where Qv is the volume flow rate of fuel and d is the temporally evolving droplet diameter, assumed in the analysis to be spherical. For these experiments, as described in Struk [36], d pertains to the diameter of a sphere with the same volume as the actual droplet [18, 22], assuming rotational symmetry about the ϕf = 0° axis. The droplet usually can be approximated as ellipsoidal in shape so that the diameter with the equivalent volume of a sphere takes the form
| (10) |
where a and b are the semi-major and minor axis lengths associated with each droplet image. As d = deqvs. was fairly constant throughout the experiment due to the droplets reaching quasi-steady burning with a constant fuel flow Qv, the second non-fed burning rate term in Eq. (9) was typically very small. This term was nevertheless quantified in the instantaneous calculations for K; these K values were averaged over the entire test time to provide the mean burning rate constant for the experimental conditions under consideration.
Using the phase-locked OH* chemiluminescence images and corresponding instantaneous p′ measurements, the average Rayleigh index G could be determined experimentally via Eq. (1). Clearly, in the present study the combustion oscillations were not self-excited; length scales associated with the waveguide were much larger than that of the burning droplet, causing any potential added energy to the system from the flame-acoustic coupling to be minimal as compared to the total acoustic energy. As described in our previous work [16], the Rayleigh index used in this study is an indication of the degree of flame-acoustic coupling that occurs for relative droplet locations and acoustic forcing conditions, in addition to providing an interpretation of the sign of the Rayleigh index with respect to periodic extinction phenomena. For the Rayleigh index calculation, since the OH* chemiluminescence I′ is typically considered to be directly proportional to the heat release or combustion rate, it may be used to represent q′ [37]. Specially designed software to track the flame and compute the overall integrated intensity of each image was used to quantify the unsteady heat release in the G calculation. It should be noted that, during droplet burning, the total chemiluminescence intensity of the flame gradually decayed over time, even in the absence of acoustic forcing, due to the gradual consumption of oxygen within the closed waveguide. As in prior experiments [16, 24], this decay must be taken into account in order to determine the threshold associated with defining the flame region. While earlier studies employed a fixed threshold intensity level to define the flame zone, our more recent approaches [25] have used a set percentage of the maximum pixel intensity profile to take into account the naturally decaying OH* intensity. While this altered method did not change any priors results [16], the method allowed a more accurate study of the PPER phenomenon to be performed, especially given the rapidly alternating extinction and reignition processes.
Once the overall integrated flame intensity I′ was determined for each image with the associated instantaneous pressure perturbation p′, the experimental value for G at a given location x was calculated using a discretized version of Eq. (1):
| (11) |
where Ncycle is the number of actual acoustic cycles over which data are acquired, m is the number of phase-locked measurements taken, is the forcing amplitude at the PAN closest to the central PN, and Io is the flame intensity for an unforced burning droplet. In total, 3–4 sets of 15 phase-locked datasets, taken at evenly spaced acoustic phase delays, were recorded during the combustion process. Further details on the experimental test facility and data processing techniques may be found in earlier publications [16, 18, 24, 25, 38, 39].
3. Results
3.1. Unforced burning droplet behavior
A series of unforced burning fuel droplet tests were performed to quantify baseline behavior for comparison to acoustically-forced burning droplet conditions. While the focus in the present study was on ethanol droplets, additional data sets were acquired for JP-8 (military aviation fuel) and liquid synthetic fuel derived via the Fischer-Tropsch process (“FT”), to contrast the behavior of non-sooting fuels (e.g., ethanol) with these sooting fuels. Moreover, many of the thermodynamic characteristics of JP-8 and FT fuels are similar to each other, which is one of the reasons that FT fuel has been explored and certified for implementation in the Air Force fleet [40, 41]. Yet these characteristics differ from those for ethanol, as summarized in Table 2, and there are attendant differences in diffusion and chemical reaction timescales as well. Hence exploration of these several fuels, as done in Sevilla, et al.[16] for lower amplitude forcing, can demonstrate differences in coupling among diffusion, reaction and acoustic processes.
Table 2:
Thermodynamic characteristics of alternative fuels explored [24]
| Fuel Property | Ethanol | JP-8 | FT |
|---|---|---|---|
| Chemical Formula | C2H5OH | C11H21 | C12H25 |
| Molecular Weight [kg/kmol] | 46.17 | 147.83 | 164.79 |
| Stoichiometric Air-Fuel Ratio | 8.948 | 15.105 | 15.218 |
| Stoichiometric Mixture Fraction, Zst | 0.087 | 0.059 | 0.061 |
| Specific Heat Capacity* [kJ/(kg-K)] | 2.42 | 1.92 | 2.73 |
| Thermal Conductivity* [W/(m-K)] | 0.179 | 0.115 | 0.00935 |
| Kinematic Viscosity* [mm2/s] | 1.452 | 1.646 | 1.536 |
| Mass Density* [g/cm3] | 0.79 | 0.81 | 0.76 |
| Freezing Temperature, Tfrz. [K] | 158 | 222.7 | 218.7 |
| Boiling Temperature, Tb [K] | 351 | 413–573 | 448–633 |
| Adiabatic Flame Temperature, Tadia. [K] | 2195 [62, 63] | 2338 [64] | 2338 [64] |
| Heat of Vaporization [kJ/kg] | 841 | 441 | 339 |
| Heat of Combustion [kJ/g] | 27 | 43 | 44 |
| Energy Density [kJ/m3] | 21.3 | 34.8 | 33.4 |
| σ [Å] | 4.53 [43] | 6.997† [65] | 7.482‡ [65] |
| ϵ/k[K] | 362.6 [43] | 681.2† [65] | 688.9‡ [65] |
| Binary Diffusion Coefficient, [mm2/s] | 153 | 88 | 82 |
| Characteristic Diffusion Timescale, [ms] | 7.0 | 12.5 | 13.3 |
| Characteristic Chemical Timescale, [ms] | 0.184 | 0.132 | 0.133 |
Calculated for T ≈ 295 K and P ≈ 101,325 Pa
Calculated for T = (Tadia. + Tb,mean)/2 and P ≈ 101,325 Pa
Estimated using δf,mean at θ = 90° for unforced, continually-fed droplet combustion
Estimated using diffusion flamelet theory presented in [45]
For C10H22
For C12H26
Estimates of the characteristic time for diffusion, τdiff., and chemical reaction timescale, τc, for the continually-fed droplet system may be compared to the characteristic acoustic time, τa = 1/fa, using a similar procedure to that in Ogami et. al [42]. The binary diffusion coefficient DAB, for fuel vapor diffusion into the air environment, uses the following expression [43]:
| (12) |
where
| (13) |
and where T is the gas temperature, P is the pressure, MWA and MWB represent the molecular weights of air and fuel, respectively, σAB represents the average collisional diameter of the species, σAB = (σA + σB)/2, and ΩD represents the collision integral. The diffusion coefficient DAB was estimated for all the fuels in this study using values presented in Table 2, taken from the literature and assuming atmospheric pressure conditions and T = Tf = (Tb + Tadia.)/2, which is the theoretical average temperature within the region between the flame and droplet surface [44].
The binary diffusion coefficient DAB for ethanol is 153 mm2/s, almost half that of FT and JP-8, which are very similar to each other and average approximately 85 mm2/s. This makes sense in that these fuels have similar thermodynamic properties. Knowing the diffusion coefficient, the characteristic time scale for diffusion processes, τdiff., can be estimated using
| (14) |
where δf,mean is the mean flame standoff distance, chosen as the approximate diffusion length scale given that the fuel droplets burn for very long periods of time in the present experiment. From this estimate, the average characteristic time for diffusion of the continuously-fed, unforced ethanol droplets was τdiff.,mean ≈ 7 ms, and for JP-8 and FT it was approximately 13 ms.
To estimate the characteristic chemical timescale for reaction processes in the present problem, τc, one can use diffusion flamelet theory from Card and Williams [45], for example. In this analysis, τc takes the form
| (15) |
where Zst is the stoichiometric mixture fraction and χq is the scalar dissipation rate given as
| (16) |
where aq, is of the order ≈ 700 s−1 for ethanol [46] and is of the order ≈ 850 s−1 for FT/JP-8 [47]. Hence, the characteristic chemical timescales can be estimated for the fuels explored in the present study, and are also documented in Table 2. As expected, reaction timescales for JP-8 and FT fuels were quite close to one another, given similarities in other thermodynamic characteristics. Also as expected, the reaction timescales were estimated to be considerably shorter than those for diffusion, consistent with a diffusion limited reaction process.
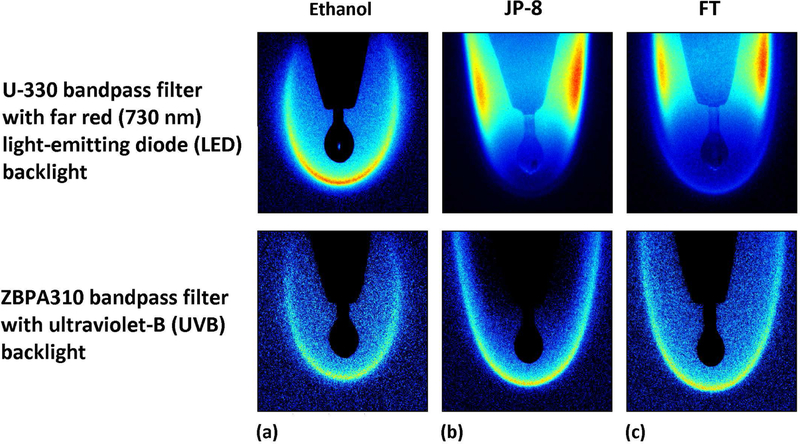
OH* chemiluminescence images for the three different fuel droplets are shown, for reference, in Fig. 4. Droplets burned in essentially a quasi-steady manner with a constant fuel delivery rate Qv, as documented in earlier studies [16]. Images shown in Fig. 4 correspond to all three fuels, utilizing the Nanostar camera with two different optical configurations. One involved a U-330 bandpass filter (330±140 nm) with backlighting of the droplet via a far red (730 nm) light-emitting diode (LED) and the other configuration incorporated a ZBPA310 bandpass filter (310±10 nm) with an ultraviolet-B (280–320 nm) backlight. As shown in Fig. 4, with the former configuration it was difficult to adequately capture OH* chemiluminescence for JP-8 and FT due to the high luminosity from soot formation, resulting from additional transmission in the infrared [24, 38]. The filter was suitable for ethanol combustion imaging. On the other hand, the ZBPA310 bandpass filter configuration provided clear OH* chemiluminescence imaging by blocking the high soot luminosity of JP-8 and FT, yielding a more robust capability in quantifying flame response to external acoustic forcing, and hence this filter was employed for these two fuels. Tests were conducted with continuously-fed burning droplets at a constant fuel delivery rate Qv, with Kcont.−fed determined from Eq. (9). There were additional non-fed droplet experiments conducted, where the droplet was suspended from the borosilicate glass capillary without continual fuel delivery, so that the decay in the droplet diameter over a few seconds due to evaporation enabled extraction of the burning rate constant Knon−fed using the well-known d2-law [8, 48, 49].
Figure 4:
OH* chemiluminescence images contrasting the burning of (a) ethanol, (b) JP-8, and (c) FT droplets in the absence of acoustic excitation using a U-330 bandpass filter with a far red LED backlight and a ZBPA310 bandpass filter with an ultraviolet-B backlight.
The range of measured burning rate constants for the three alternative fuels, via fed and non-fed droplet experiments, is shown in Table 3. The range of established values corresponding to others’ non-fed burning droplet experiments is also shown. For the continuously-fed ethanol droplet tests, the average Kcont.−fed was found to be 0.86 mm2/s, which is higher than the measured non-fed burning rate constant, which has an average of 0.74 mm2/s and a corresponding average coefficient of determination for all non-fed tests equaling 0.997. This latter burning rate constant value was slightly lower than the established Knon−fed values in normal gravity [50, 51, 52], possibly due to the larger capillary diameter as compared with smaller fibers typically used in suspended, non-fed droplet experiments. For JP-8 and FT, the continuously-fed experiments yielded average burning rate constants of 0.85 mm2/s and 0.91 mm2/s, respectively, while the average non-fed burning rate constants measured were 0.87 mm2/s and 0.90 mm2/s. For most fuels explored here, the continuously-fed burning droplets tended to have a slightly higher baseline K value than non-fed droplets, likely due to the much longer time period for burning, generally on the order of minutes, and hence the hotter surrounding gases associated with fed droplets.
Table 3:
Measured continuously-fed/non-fed burning rate constants K for various fuels without acoustic forcing are compared with established values in normal gravity.
| Continuously Fed | Non-Fed | ||||
|---|---|---|---|---|---|
| Fuel | dmean (mm) |
Kcont.−fed, meas. (mm2/s) |
do (mm) |
Knon−fed, meas. (mm2/s) |
Knon−fed, est. (mm2/s) |
| Ethanol | 1.67 | 0.80–0.91 | 1.46 | 0.72–0.77 | 0.75 [50], 0.80±0.05 [51], 0.82 [52] |
| JP-8 | 1.51 | 0.83–0.91 | 1.57 | 0.81–0.93 | 1.08±0.04 [66], 0.87, 1.04 (JP-4) [67] |
| FT | 1.41 | 0.82–0.92 | 1.60 | 0.86–0.93 | - |
3.2. Acoustically coupled droplet combustion behavior
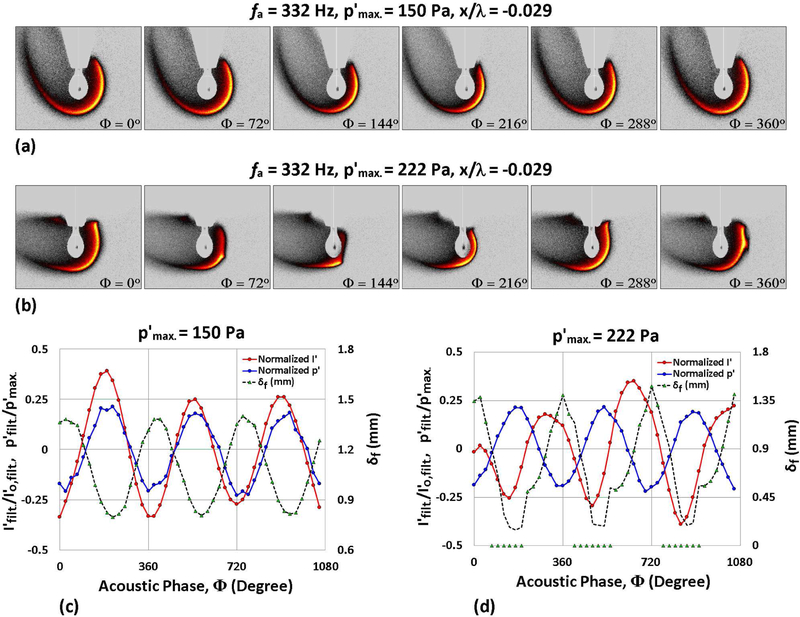
When exposed to acoustic excitation, the burning fuel droplet exhibited one of the following behaviors, depending on the frequency and amplitude of forcing: (1) weakly oscillating motion of the deflected flame, (2) sustained oscillatory flame-acoustic coupling, (3) periodic partial extinction and reignition of the more highly deflected flame, and (4) complete flame extinction after very high amplitude forcing. Results contrasting sustained oscillatory combustion and periodic partial flame extinction and reignition for an ethanol droplet exposed to fa = 332 Hz forcing at two different pressure perturbation amplitudes , for example, are shown in Fig. 5. OH* chemiluminescence images throughout an acoustic cycle show a flame deflected away from the PN (to the left) for both forcing amplitudes 150 Pa and 222 Pa, in Figs. 5(a) and (b), respectively, but with partial extinction of the flame occurring for 222 Pa excitation as it moves towards the droplet at ϕ = 72° and 144°, in the vicinity of the stagnation region, and reignition by ϕ = 216°, as the flame moves away from the droplet. A larger degree of flame deflection is seen for higher amplitude forcing, even with the periodic partial extinction phenomenon.
Figure 5:
OH* chemiluminescence images of a burning ethanol droplet situated at 0.029 wavelengths to the left of the PN during acoustic forcing at 332 Hz for (a) = 150 Pa and (b) 222 Pa. Nondimensionalized measurements of local p′, integrated chemiluminescent intensity I′, and local flame standoff distance δf are plotted as a function of the acoustic phase for the same forcing conditions, at (c) = 150 Pa and (d) 222 Pa.
The associated phase-locked measurements of local perturbation pressure p′, spatially integrated chemiluminescent intensity I′, and horizontal flame standoff distance δf are plotted as a function of the acoustic phase in Figs. 5(c) and (d) for the lower and higher amplitude forcing conditions, corresponding to Figs. 5(a) and (b), respectively. Fig. 5(c) shows that the temporal/phase-locked variation in p′ and I′ were in phase for 150 Pa forcing; the latter is consistent with more vigorous burning as the diffusion flame periodically approaches the droplet surface. This type of coupling has been seen for a range of fuels at moderate excitation amplitudes in the vicinity of the PN in our prior studies [16]. But for higher amplitude excitation at 222 Pa, Fig. 5(d) shows out-of-phase variation in p′ and I′, resulting from localized extinction when the flame approaches the droplet surface and reignition of the flame as it moves away from the surface. For ethanol droplet combustion at fa = 332 Hz, full extinction is observed for pressure perturbation amplitudes exceeding approximately 235 Pa.
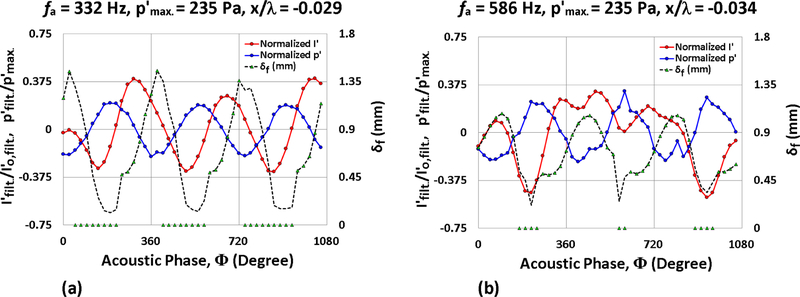
Similar behaviors to those documented in Fig. 5(d) were observed for fuel droplets exposed to higher frequency forcing but at even higher amplitudes. In general, for a given amplitude of excitation, the flame showed a greater response to low-frequency excitation, where the acoustic time scales (Ta = 1/fa) are large compared to the reaction time scales but are closer to diffusion timescales. Based on estimates of diffusion timescales indicated in Section 3.1 (Table 2), it was observed that Ta ≈ 3 ms for 332 Hz excitation approached τdiff.,mean ≈ 7 ms for ethanol more closely than other excitation frequencies. Figs. 6(a) and (b) show phase-locked measurements for ethanol droplets with 235 Pa excitation at 332 Hz and 586 Hz, respectively, for relative x/λ droplet locations yielding comparable theoretical acoustic velocity fluctuations to one another. Droplet positions matching presumably have the same oscillatory velocity field and hence the same oscillatory strain field to which the flame is exposed, as will be discussed in Section 3.3. As can be seen from the temporal/phase-locked δf variations in Figs. 6(a) and (b), the portion of the acoustic cycle corresponding to local flame extinction (denoted by δf = 0) is much longer for 332 Hz forcing than for 586 Hz.
Figure 6:
Nondimensionalized measurements of local p′, integrated chemiluminescent intensity I′, and local flame standoff distance δf are plotted for a burning ethanol droplet as a function of the acoustic phase for = 235 Pa acoustic forcing at (a) 332 Hz and (b) 586 Hz. Droplet displacement locations x/λ = −0.029 and −0.034 are shown for 332 Hz and 586 Hz respectively, as the corresponding theoretical velocity amplitude 0.56 m/s is approximately the same at both positions for 235 Pa forcing.
A limited number of tests were conducted with different types of fuels for droplet exposure to high amplitude excitation in the vicinity of the PN. In particular, the flame-acoustic response of JP-8 and FT was explored because of their thermodynamic similarity to one another, but differences of each with respect to ethanol, as seen in Table 2.
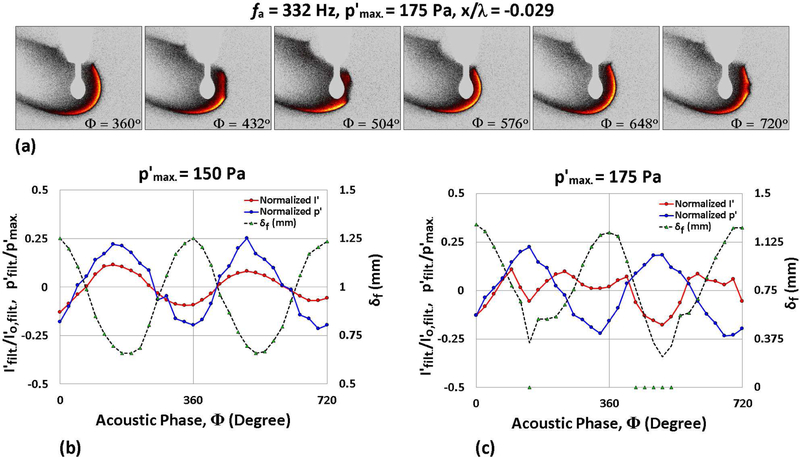
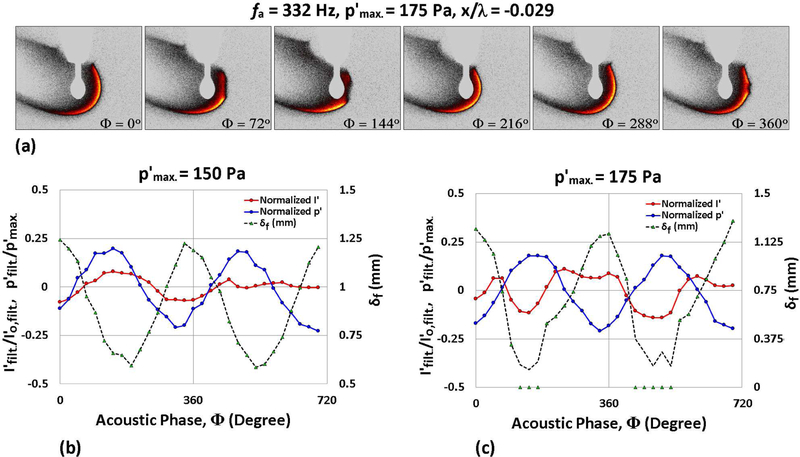
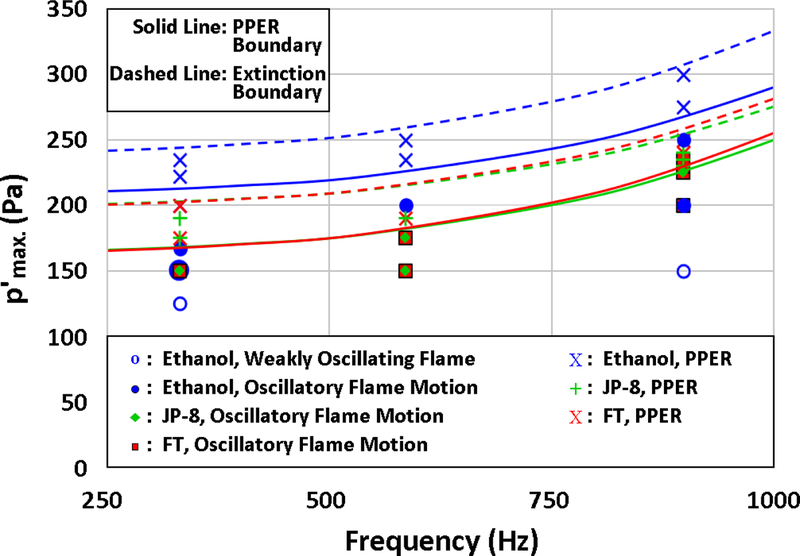
At 332 Hz forcing, the periodic partial extinction and reignition phenomenon was observed for both JP-8 and FT fuels, as seen for ethanol. A sample set of OH* chemiluminescence images for JP-8 and FT displaying PPER over the course of one acoustic period for 332 Hz forcing is shown in Figs. 7(a) and 8(a). It was observed that both JP-8 and FT fuels first demonstrated PPER behavior when was increased to 175 Pa, which was 50 Pa lower than for PPER initiation for ethanol droplets at 332 Hz forcing. Corresponding phase-locked measurements for JP-8 and FT droplets undergoing oscillatory flame motion (at 150 Pa) and PPER (at 175 Pa) are shown in Figs. 7(b) and (c), and in Figs. 8(b) and (c), respectively. As with ethanol, both of these fuels demonstrated in-phase behavior of the oscillatory pressure and flame intensity during sustained oscillatory combustion, while PPER created out-of-phase fluctuation of p′ and I′.
Figure 7:
OH* chemiluminescence images of a burning JP-8 droplet situated at 0.029 wavelengths to the left of the PN during acoustic forcing at 332 Hz for (a) = 175 Pa. Nondimensionalized measurements of local p′, integrated chemiluminescent intensity I′ and local flame standoff distance δf are plotted as a function of the acoustic phase for the same forcing conditions, at (b) = 150 Pa and (c) 175 Pa.
Figure 8:
OH* chemiluminescence images of a burning FT droplet situated at 0.029 wavelengths to the left of the PN during acoustic forcing at 332 Hz for (a) = 175 Pa. Nondimensionalized measurements of local p′, integrated chemiluminescent intensity I′ and local flame standoff distance δf are plotted as a function of the acoustic phase for the same forcing conditions, at (b) = 150 Pa and (c) 175 Pa.
Similar to ethanol, higher amplitude acoustic excitation was required for PPER to occur for JP-8 and FT fuels when forced at higher forcing frequencies. The applied pressure perturbation amplitude for PPER to occur for JP-8 and FT droplets was consistently lower than that for ethanol for all forcing frequencies. Differences in the thermo-physical properties between ethanol and these sooting hydrocarbon fuels clearly contributed to quantitative differences in flame response, and, correspondingly, similarities in behavior between JP-8 and FT fuels likely contributed to the similarities in flame response to acoustic forcing. There was a clear dependence of the PPER phenomenon on the fuel type, and hence, reaction time scales and their likely relationship to the acoustic time scales. This will be explored further in Section 3.3.
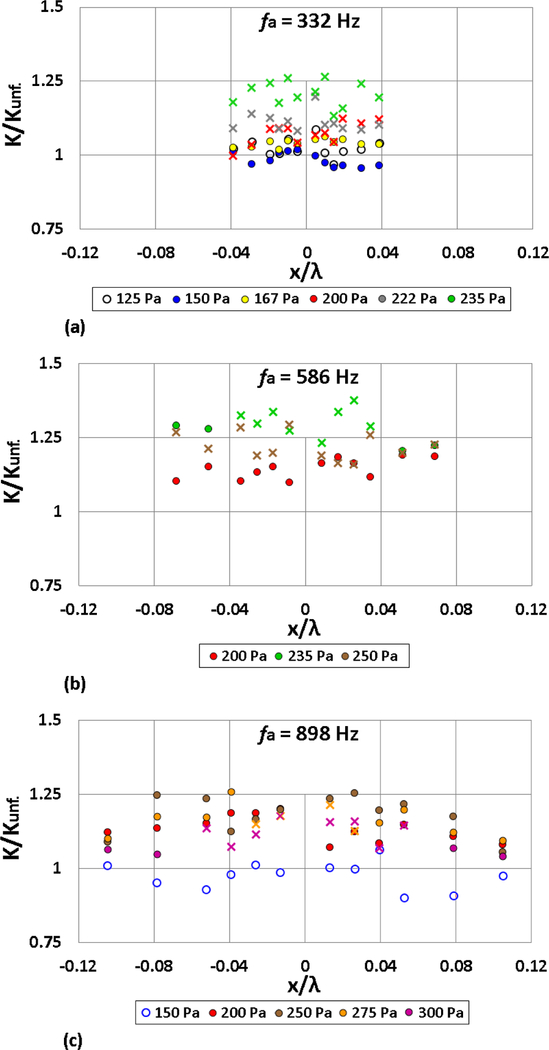
The effect of acoustic forcing on the burning rate constant K for the three excitation frequencies 332 Hz, 586 Hz, and 898 Hz at a range of forcing amplitudes are shown for ethanol in Figs. 9(a)-(c), respectively. These values were normalized by the average K value for the specific fuel in the absence of acoustic excitation (Kunf.) taken during each set of experiments at a given forcing amplitude. For the lower amplitudes of acoustic forcing (e.g., 125 Pa for 332 Hz forcing), the K values for the various droplet positions fell within the range of the unforced values, indicating that the flame exhibited burning behavior similar to that for the unperturbed condition. As the amplitude of forcing was increased for all three frequencies, enhancement of the droplet burning rate constant K was typically observed for all droplets in the vicinity of the PN, consistent with the observations of Kumagi and Isoda [50], Blaszczyk [53], and Dattarajan, et al. [18] in normal gravity.
Figure 9:
Normalized burning rate constant K/Kunf. for ethanol as a function of the droplet displacement x/λ, at forcing frequencies (a) 332 Hz, (b) 586 Hz, and (c) 898 Hz. Depending on the acoustic forcing conditions (frequency and amplitude), the burning fuel droplet is characterized by weakly oscillating flame behavior (○), oscillatory flame motion (•) or periodic partial extinction and reignition (x).
Interestingly, even when PPER occurred at high amplitude excitation, the local K value increased above that for continual burning at lower amplitude excitation. This observation was consistent with much slower evaporative time scales than the acoustic time scales to which the flame responded (in most cases, differing by several orders of magnitude, even for smaller droplets). At the highest amplitudes for the three forcing frequencies corresponding to PPER, K typically increased by 20 – 30% when compared to the average unforced condition. As the forcing frequency was increased from 332 Hz to 898 Hz for a given excitation amplitude, the spatial variation in K with relative droplet position x/λ was more apparent due to the reduced wavelength. While average K values tended to be higher in the vicinity of the PN , the burning rate constants were closer to the unforced values for droplets situated farther from the PN. As noted in detail in Sevilla [16, 24], droplet flames are generally much less deflected for x/λ locations further from the PN, with a higher mean horizontal flame standoff distance δf,mean and hence a flame configuration and burning rate constant that is closer to unforced conditions.
It should be noted that the droplet size for the acoustically-forced experiments are larger than for typical sprays, as there are limitations on the capillary size. However, while K is affected by the initial droplet size, it would not be substantially altered for droplets within injector sprays to the point where the evaporative time scales are no longer slower than the acoustic time scales for acoustically-forced droplet combustion, except for very fine sprays. Therefore, the relative effect of acoustic coupling would be expected to be similar for smaller droplets present within a reactive spray.
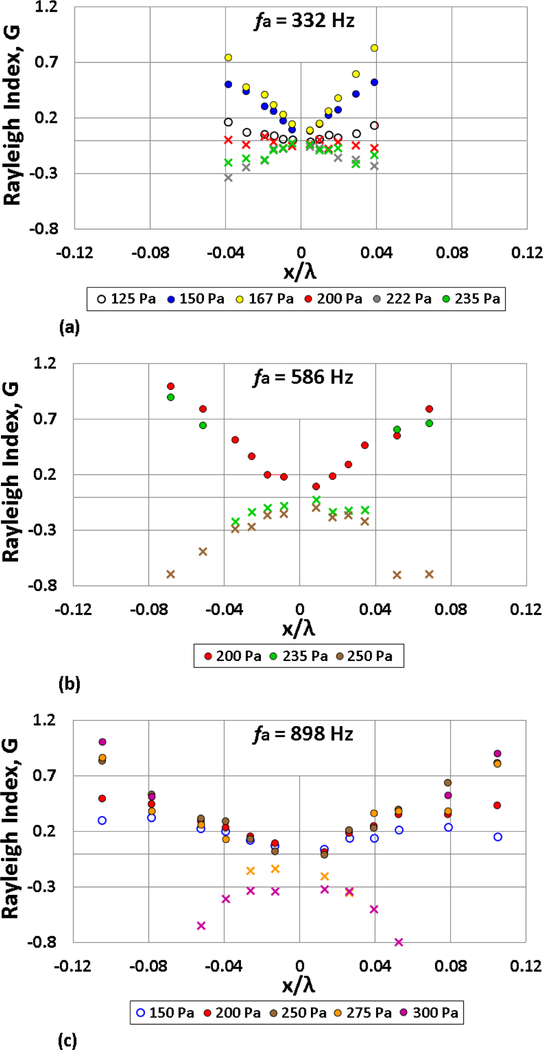
Experimental values for the Rayleigh index G were calculated by substituting the normalized p′ and I′ phased-locked measurements into Eq. (11) for droplets situated at various x/λ locations. The Rayleigh index spatial distribution, G(x), for the three forcing frequencies at the investigated amplitudes for ethanol combustion is shown in Fig. 10. G varied substantially based on the nature of flame response, that is, weak or strongly oscillatory flame motion or PPER, depending on the specific forcing condition and the relative droplet location. For the acoustic forcing conditions leading to oscillatory flame-acoustic coupling, the in-phase variation of p′ and I′ always led to positive G values of varying magnitude (denoting combustion instability). Consistent with the definition of G(x) in Eq. (1), G was zero precisely at the PN, but then increased spatially as one moves away from the PN. For continuous oscillatory flame motion, an increase in p′ and I′ created higher G values at higher amplitude forcing. But when the acoustic forcing amplitude was large enough for the burning fuel droplet to locally extinguish and reignite periodically, as during PPER, the calculated Rayleigh index became negative due to the out-of-phase behavior of p′ and I′ indicated in Figs. 5(d), 6(a), and 6(b). A negative G theoretically suggests stable combustion, despite clear oscillatory flame behavior during the periodic partial extinction and reignition process.
Figure 10:
Rayleigh index G as a function of the ethanol droplet displacement x/λ, at forcing frequencies (a) 332 Hz, (b) 586 Hz, and (c) 898 Hz. Depending on the acoustic forcing conditions (frequency and amplitude), the burning fuel droplet is characterized by weakly oscillating flame behavior (○), oscillatory flame motion (•) or periodic partial extinction and reignition (x).
The transition from positive to negative Rayleigh index values occurred at higher amplitude excitation for higher frequencies. For ethanol, periodic partial extinction and reignition was first observed at = 200 Pa for 332 Hz and was not present until 275 Pa acoustic forcing for 898 Hz, further signifying that the flame responds more vigorously to lower frequency excitation. Interestingly, for 586 Hz and 898 Hz forcing shown in Figs. 10(b) and (c) respectively, not all the x/λ droplet locations produced partial extinction at a large forcing amplitude. The droplets situated in the vicinity of the PN began to exhibit partial extinction behavior at lower amplitude forcing than those further away from the PN, where the flame deflection and velocity perturbations were reduced. For example, during 586 Hz excitation at 235 Pa and 898 Hz forcing at 275 Pa and 300 Pa, there was a spatial transition in G(x) from positive to negative values for a fixed excitation amplitude as the droplet was situated closer to x/λ = 0. This was not observed for 332 Hz forcing where, for the length of the present waveguide, there was very little variation in the velocity field u′ (Fig. 2(d)). Based on the fact that PPER was observed for droplets located close to the PN (VAN), and thus exposed to higher velocity perturbations, the partial extinction behavior could well be driven by the velocity perturbation-induced strain imposed on the flames. This interpretation will be used to explore the foregoing observations in the next section.
3.3. Periodic flame strain
An interpretation of periodically oscillating flames associated with acoustically-forced droplet combustion, especially in the vicinity of large velocity perturbations, naturally could involve unsteady, oscillating, periodically strained diffusion flames. Strained or opposed-flow diffusion flames have been studied for several decades, principally because of their relevance in representing a model for turbulent reactive flow known as the coherent or laminar flamelet [54, 55]. The strained flame’s surface area is governed by the competition between generation due to fluid mechanical stretching and consumption due to burning. Unsteadiness in the strain field is particularly important in understanding the nature of turbulent flames, and indeed, the temporal evolution of the strain field has been shown to have a significant effect on the ignition and evolution of flame structures in complex flowfields [56, 57].
In exploring the structure, ignition and extinction for periodically strained diffusion flames [23, 58, 59], the normal strain rate may be characterized as having the following mathematical form:
| (17) |
where ϵs is the mean strain rate and ϵ′ is the oscillatory strain amplitude to which the flame is exposed at frequency f. A number of computational studies for the single opposed flow diffusion flame [23, 58, 60] or strained fuel strip [59] exposed to oscillatory strain indicate flame behavior to be quasi-steady for excitation at very low frequencies, fully responsive at low to moderate frequencies, and, as the frequency is increased such that the acoustic or oscillatory time scales approach reactive time scales, the flame response weakens until there is minimal flame response.
Using activation energy asymptotics, the theoretical findings of Ghoniem et al. [23] suggest that when the oscillatory strain amplitude ϵ′ is in general larger than the mean strain rate ϵs, periodic local extinction and reignition of the flame can occur. The partial extinction behavior is associated with a sub-cycle compressive strain which momentarily depletes the reactants; when positive strain-induced reactant periodically enters the hot reaction zone, reignition of the flame occurs.
Such ideas on periodically strained flames clearly have relevance to the oscillatory flames formed in the stagnation region of the burning droplets in the present study. To characterize the velocity perturbation-induced strain field for the present configuration shown in Fig. 3, we consider the bulk acoustic radiation force fa, which acts to deflect the flame away from the PN, to create the mean strain rate ϵs acting in the stagnation region of the droplet. As a rough approximation, one can estimate the low Reynolds number bulk flow to take the form of Oseen flow over a sphere of radius ro [39, 61], yielding a normal strain rate in the stagnation region that takes the form:
| (18) |
where U∞ is the effective bulk velocity causing the flame to deflect as a result of the acoustic radiation force. U∞ may be determined from an energy balance of the kinetic energy of the hot combustion products with the work done on the burning droplet due to the resultant acceleration gres. arising from acoustic acceleration ga and gravitational acceleration go [39]. The expression for the effective velocity reduces to
| (19) |
where Tf is the average temperature within the region between the flame and droplet surface and To is the local ambient gas temperature just outside of the burning droplet system. In the current configuration, the oscillatory strain rate amplitude ϵ′ results from the local perturbation velocity in the x-direction, whose amplitude, , is known accurately from the local temporal pressure perturbation measurements. Estimates for ϵ′ may be extracted from Eq. (18) as well, with replacing U∞ [39].
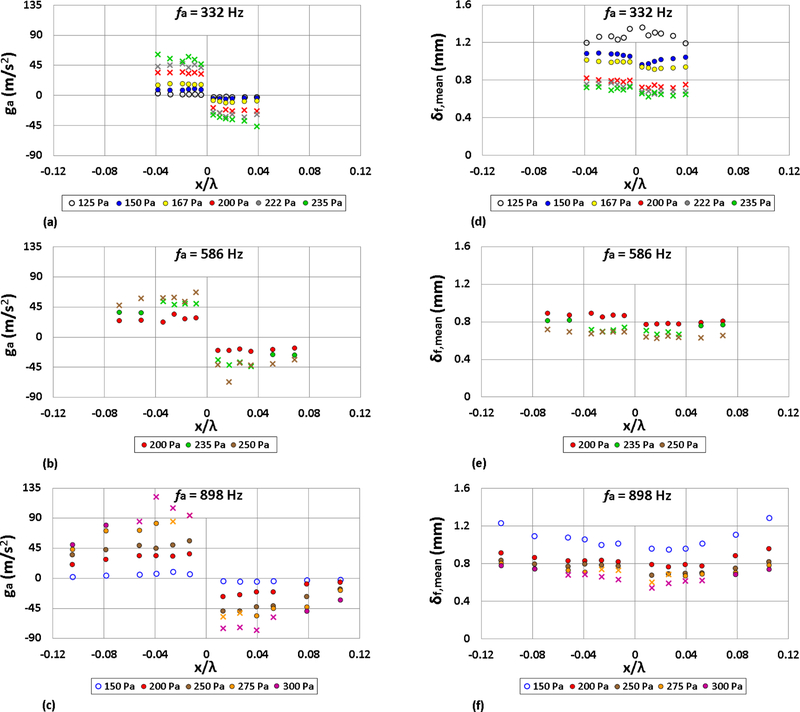
For the strain rate estimates via Eq. (18), the local acoustic acceleration ga, derived experimentally from the deflection angle per Eq. (8), as well as the mean standoff distance, δf,mean, in the horizontal direction (see Fig. 3), need to be determined for each set of forcing frequencies and amplitudes. Figs. 11(a)-(c) show the local acoustic acceleration ga as a function of droplet location for the three different forcing frequencies and various forcing amplitudes. Positive ga refers to deflection to the left of the PN, and negative ga to the right. Figs. 11(d)-(f) show δf,mean for the same conditions. As expected, for each frequency, the magnitude of the acoustic acceleration increased with higher amplitude forcing, as this corresponded to a larger degree of bulk flame deflection. The time-averaged horizontal standoff distance δf,mean in contrast, decreased with higher amplitude acoustic forcing, consistent with an increase in the flame oscillation amplitude and burning rate constant, even during PPER. Combined, the trends for ga and δf,mean contribute to an increase in ϵs and ϵ′ with higher amplitudes of acoustic excitation.
Figure 11:
Acoustic acceleration ga as a function of the ethanol droplet displacement x/λ, at forcing frequencies (a) 332 Hz, (b) 586 Hz, and (c) 898 Hz, as well as mean flame standoff distances δf,mean for (d) 332 Hz, (e) 586 Hz, and (f) 898 Hz acoustic forcing. Depending on the acoustic forcing conditions (frequency and amplitude), the burning fuel droplet is characterized by weakly oscillating flame behavior (○), oscillatory flame motion (•) or periodic partial extinction and reignition (x).
In order to estimate the temperature terms appearing in Eq. (19), temperature measurements in the vicinity of the burning droplet were made using a Platinum-Rhodium (Pt-10%-Rh/Pt) thermocouple with 0.125 mm wire diameter. Temperature measurements were made for an unforced burning ethanol droplet, where the thermocouple was moved systematically from approximately two droplet diameters away from the center of the droplet to the flame front and into the hot reaction zone in the vicinity of the droplet. As expected, the farthest positions measured temperatures close to 300 K, which corresponded to the ambient temperature within the waveguide. As the thermocouple was moved closer to the burning droplet, the temperature increased linearly up to approximately 1150 K at the flame front and reached a maximum at about 1250 K within the reaction zone between the droplet and flame front. From these experimental results, the temperatures shown in Table 4 were used for the strain rate estimates. It should be noted that the flame region temperature, Tf, was taken to be 1200 K, as this was the average of the temperature measurements within the reaction zone between the droplet and flame front, whereas To was the measured temperature at the mid-span location between the droplet flame location and where the ambient temperature reached 300 K. Tf was found to be consistent with the theoretical analysis by Law and Williams [44], where the flame temperature region is approximated as the average of the adiabatic flame temperature and boiling temperature of the fuel. For an ethanol droplet burning in a quiescent air environment, which produces Tf = (2195 K + 351 K)/2 = 1273 K, this is within a reasonable range of the measured Tf. It is noted that even if 1273 K is used instead as the assumed flame region temperature, there was no significant difference in the mean strain rate estimates.
Table 4:
Relevant temperatures for the strain rate estimates based on thermocouple measurements.
| Tf (K) | To (K) | T∞ (K) |
|---|---|---|
| 1200 | 650 | 296 |
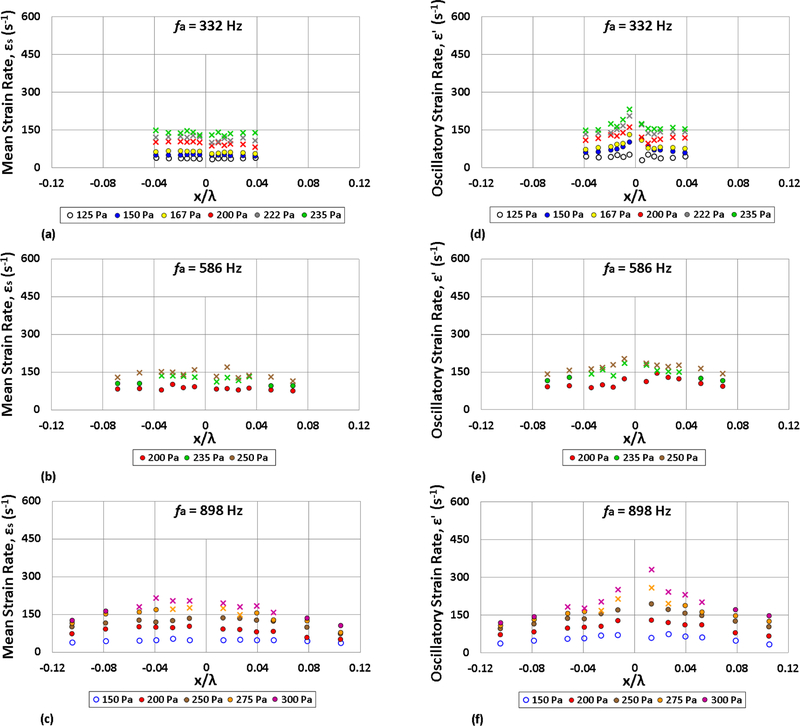
Based on the foregoing approximations, the mean ϵs and oscillatory ϵ′ strain rate estimates for the three forcing frequencies and a range of amplitudes are shown in Figs. 12(a)-(c) and 12(d)-(f), respectively. The mean strain rate ranged from ϵs ≈ 10 – 200 s−1 for the various droplet locations, for excitation amplitudes ranging from , while the oscillatory strain rate ranged from ϵ′ ≈ 50 s−1 to 350 s−1 for the same amplitude range. As expected, ϵs increased uniformly with higher amplitude forcing. For 332 Hz and 586 Hz forcing, there was typically not much spatial variation of mean strain rate ϵs, while forcing at 898 Hz exhibited some ϵs spatial variation due to the reduction in acoustic acceleration away from the PN; this spatial variation in ϵs became more prevalent at higher values of .
Figure 12:
Estimates of the mean ϵs and oscillatory ϵ′ strain rate as a function of the ethanol droplet displacement x/λs, at forcing frequencies (a) 332 Hz, (b) 586 Hz, and (c) 898 Hz. Depending on the acoustic forcing conditions (frequency and amplitude), the burning fuel droplet is characterized by weakly oscillating flame behavior (○), oscillatory flame motion (•) or periodic partial extinction and reignition (x).
The oscillatory strain rate ϵ′, in contrast, had significant spatial variation, where the large periodic velocity perturbations u′ at the VAN created large amplitude oscillatory strain fields to which the burning droplets close to the PN were exposed. For forcing at all frequencies, ϵ′ increased at a larger rate than ϵs, with the greatest increase in ϵ′ for droplets situated close to the PN.
The oscillatory strained diffusion flame study by Ghoniem, et al. [23] suggests that ϵ′ exceeds ϵs for moderate frequency excitation conditions producing periodic partial extinction and reignition. The present strain estimates appeared to be consistent with this prediction in the case where droplets were situated very close to the PN, which saw magnitudes of ϵ′ as high as 136 s−1 greater than ϵs. On the other hand, some of the acoustic conditions corresponding to vigorous oscillatory flame motion but without extinction also had ϵ′ > ϵs, albeit to a lesser degree, and in a few cases, some PPER behavior was associated with ϵs and ϵ′ values that were very close to one another, especially for high frequency excitation. Given that the strain estimates here were highly approximate, it is notable that there was consistency with the oscillatory strained flame theory for high amplitude strain of droplet flames closest to the PN.
The experimentally observed droplet flame response as a function of applied acoustic frequency and pressure amplitude for the three fuels is summarized in Fig. 13, where weakly and vigorously oscillating flames, as well as burning fuel droplets located close to the PN experiencing PPER and full extinction, are identified. As noted previously, it can be seen that the JP-8 and FT fuels demonstrated very similar flame response behavior to one another, as their thermodynamic properties and hence chemical and diffusion characteristics were similar to one another. Both of these fuels produced PPER at a pressure amplitude higher than approximately 175 Pa and full extinction for an excitation level exceeding 200 Pa for 332 Hz forcing. In contrast, ethanol first demonstrated PPER at 200 Pa, with full extinction occurring at greater than 235 Pa, and hence was more stable in the presence of large acoustic perturbations. Similar trends were found for these fuels at 586 Hz and 898 Hz forcing, where the PPER boundary for FT and JP-8 was approximately 190 Pa for 586 Hz forcing and ethanol was correspondingly at 235 Pa. Forcing at 898 Hz required the highest amplitude of acoustic excitation to cause partial and full extinction for all fuel types, with FT demonstrating a slightly greater resistance to transition into the partial extinction regime than JP-8, with ethanol again requiring the largest amplitude for PPER at 275 Pa. It should be noted that the extinction boundaries for all fuels showed a dramatic increase in required amplitude to cause PPER for high frequencies, which is consistent with periodically strained flame theory [23, 58, 59].
Figure 13:
PPER and full extinction boundaries for ethanol, JP-8, and FT fuels. The burning droplet considered here was situated at similar relative positions close to the PN, i.e., x/λ = −0.029 for 332 Hz and x/λ = −0.026 for 586 Hz and 898 Hz.
4. Concluding Remarks
The present experimental study explored droplet combustion processes in the presence of acoustic disturbances for three different liquid fuels and for a range of standing wave excitation conditions. Focusing on disturbances in the vicinity of the pressure node (or velocity antinode) and building on previous experiments [16] at moderate excitation amplitudes, systematic increases in the acoustic excitation amplitude enabled us to identify new coupling phenomena relevant to acoustically-coupled condensed phase combustion processes.
The major observation in this study pertains to the phenomenon of periodic partial extinction and reignition (PPER), whereby at a high enough amplitude of acoustic excitation, , the continuously oscillatory flame motion associated with the droplet flame transitioned to one that periodically extinguished in the vicinity of the stagnation region as the flame approached the droplet surface. This extinction was associated with a temporal increase in the local rate of normal flame strain as the flame moved toward the droplet surface, but as the strain rate was reduced and the bulk reactive structure moved away from the droplet surface, reignition of the flame took place, and then the cycle repeated. This cyclical process was observed to be quite repeatable in phase-locked OH* chemiluminescence imaging for various fuels explored.
For a given fuel, the excitation amplitude at which PPER started to occur increased with increasing excitation frequency. Such findings suggested that as the applied frequency increased or acoustic timescale was reduced, approaching reaction timescales, the flame did not respond as vigorously to excitation at a given amplitude, requiring higher amplitude forcing to display the same behavior as at lower frequencies, consistent with strained flame theory [23, 58, 59, 60]. The fact that, at a given frequency, the value of at which PPER started to occur was different for ethanol as compared with JP-8 and FT fuels similarly indicates that the relationship between acoustic and reaction timescales governs the initiation of such behavior. The same can be said for the conditions leading to full extinction of the flame. Interestingly, the quantitative similarity in response to acoustic coupling by both JP-8 and FT fuels, shown in Fig. 13, is significant in that the latter has been suggested as an appropriate replacement for aviation fuels [40, 41]. The present findings indicated that, in addition to thermodynamic similarities in properties between the two fuels, the nature of acoustically-coupled combustion processes may be remarkably similar from a qualitative as well as quantitative perspective, certainly relevant to their behavior in lean-burning airbreathing propulsion systems.
In general, the PPER phenomenon appears to be consistent with theoretical predictions of periodically strained opposed-flow diffusion flames by Ghoniem et al. [23]. While estimates of the mean and oscillatory strain rate in the present studies were quite approximate, the present studies did show that, especially in the vicinity of strong velocity perturbations such as the PN location, oscillatory strain rates generally exceeded mean strain rates acting in the vicinity of the droplet flames stagnation region (Fig. 12) when PPER was present. Thus, there is considerable evidence for the role of acoustically-coupled flame strain in the present phenomena.
While the use of the Rayleigh index G as a metric in studying combustion instabilities may not be as robust for PPER phenomena, in that there truly was flame-acoustic coupling despite a negative G value, as in Fig. 10, the transition in G from being positive to negative clearly represents a precursor to full flame extinction for this burning droplet configuration. This transition in G was observed for all applied forcing frequencies in the three fuels studied in these experiments. This metric, and the phenomena associated with it, will be additionally important in exploring alternative fuels. The present studies suggested that the chemical reaction/diffusion time scales compared with the acoustic time scales govern the extinction boundaries. Furthermore, as the thermodynamic properties directly affect the chemical reaction/diffusion time scales, this could explain why different burning fuel droplets exhibit different extinction boundaries. Thus, characterizing differences among the various chemical, acoustic, and fluid mechanical time scales can provide insights into different flame responses and hence into the fundamental nature of combustion instabilities.
5. Acknowledgments
The authors would like to thank Ben Barthel, Ari Ekmekji, and Phuoc-Hai Tran for their assistance with this study, as well as Kulite Semiconductor Products, Inc. for their donation of the pressure transducers used in this study. This work has been supported by the Air Force Office of Scientific Research under Grant FA 9550-15-1-0339, with Dr. Mitat Birkan as program manager. Dario Valentini was supported at UCLA by the University of Pisa, and Miguel Plascencia and Andres Vargas were supported in part by the UCLA Cota-Robles fellowship.
References
- [1].Crocco L, Cheng S, Theory Of Combustion Instability In Liquid Propellant Rocket Motors, AGARDOGRAPH, Butterworth Scientific Publications, 1956. [Google Scholar]
- [2].Lieuwen T, Yang V, Progress in Aeronautics and Astronautics: Combustion Instabilities in Gas Turbine Engines: Operational Experience, Fundamental Mechanisms, and Modeling, AIAA, 2006. [Google Scholar]
- [3].Candel SM, Combustion instabilities coupled by pressure waves and their active control, Proceedings of the Combustion Institute 24 (1) (1992) 1277–1296. doi: 10.1016/S0082-0784(06)80150-5. [DOI] [Google Scholar]
- [4].Culick FE, Some recent results for nonlinear acoustics in combustion chambers, AIAA Journal 32 (1) (1994) 146–169. doi: 10.2514/3.11962. [DOI] [Google Scholar]
- [5].Rayleigh J, The explanation of certain acoustical phenomena, Nature 18 (1878) 319–321. doi: 10.1038/018319a0. [DOI] [Google Scholar]
- [6].Putnam AA, Combustion-Driven Oscillations in Industry (Fuel & Energy Science), 1st Edition, American Elsevier, New York City, NY, 1971. [Google Scholar]
- [7].Sirignano WA, Fuel vaporization and spray combustion theory, Progress in Energy and Combustion Science 9 (4) (1983) 291–322. doi: 10.1016/0360-1285(83)90011-4. [DOI] [Google Scholar]
- [8].Faeth GM, Current status of droplet and liquid combustion,, Progress in Energy and Combustion Science 3 (4) (1977) 191–224. doi: 10.1016/0360-1285(77)90012-0. [DOI] [Google Scholar]
- [9].Juniper M, Tripathi A, Scouflaire P, Rolon J, Candel S, Structure of cryogenic flames at elevated pressures, Proceedings of the Combustion Institute 28.
- [10].Candel S, Juniper M, Singla G, Scouflaire P, Rolon C, Structure and dynamics of cryogenic flames at supercritical pressures, Combustion Science and Technology 178.
- [11].Chehroudi B, Davis DW, Talley D, The effects of pressure and acoustic field on a cryogenic coaxial jet, 42nd AIAA Aerospace Sciences Meeting & Exhibit Paper AIAA-2004–1330
- [12].Leyva I, Rodriguez JI, Chehroudi B, Talley D, Preliminary results on coaxial jet spread angles and the effects of variable phase transverse acoustic fields, 46th AIAA Aerospace Sciences Meeting & Exhibit Paper AIAA-2008–0950
- [13].Rodriguez JI, Leyva I, Chehroudi B, Talley D, Effects of a variable-phase transverse acoustic field on a coaxial injector at subcritical and near-critical conditions, ILASS Americas, 21st Annual Conference on Liquid Atomization and Spray Systems
- [14].Teshome S, Leyva I, Talley D, Karagozian AR, Cryogenic high-pressure shear-coaxial jets exposed to transverse acoustic forcing, 50th AIAA Aerospace Sciences Meeting & Exhibit Paper AIAA-2012–1265
- [15].Forliti DJ, Badakhshan A, Wegener J, Leyva IA, Talley DG, The response of cryogenic h2/o2 coaxial jet flames to acoustic disturbances, 53th AIAA Aerospace Sciences Meeting & Exhibit Paper AIAA-2015–1607
- [16].Sevilla-Esparza CI, Wegener JL, Teshome S, Rodriguez JI, Smith OI, Karagozian AR, Droplet combustion in the presence of acoustic excitation, Combustion and Flame 161 (6) (2014) 1604–1619. doi: 10.1016/j.combustflame.2013.12.012. [DOI] [Google Scholar]
- [17].Valentini D, Tran PH, Lopez B, Ekmekji A, Smith OI, Karagozian AR, Partial extinction and the rayleigh index in acoustically driven fuel droplet combustion, Bulletin of the American Physical Society 59 (2014) 16. [Google Scholar]
- [18].Dattarajan S, Lutomirski A, Lobbia RB, Smith OI, Karagozian AR, Acoustic excitation of droplet combustion in microgravity and normal gravity, Combustion and Flame 144 (1–2) (2006) 299–317. doi: 10.1016/j.combustflame.2005.07.013. [DOI] [Google Scholar]
- [19].Tanabe M, Morita T, Aoki K, Satoh K, Fujimori T, Sato J, Influence of standing sound waves on droplet combustion, Proceedings of the Combustion Institute 28 (1) (2000) 1007–1013. doi: 10.1016/S0082-0784(00)80308-2. [DOI] [Google Scholar]
- [20].Tanabe M, Kuwahara T, Satoh K, Fujimori T, Sato J, Kono M, Droplet combustion in standing sound waves, Proceedings of the Combustion Institute 30 (2) (2005) 1957–1964. doi: 10.1016/j.proci.2004.07.019. [DOI] [Google Scholar]
- [21].Tanabe M, Drop tower experiments and numerical modeling on the combustion-induced secondary flow in standing acoustic fields, Microgravity Science and Technology 22 (4) (2010) 507–515. doi: 10.1007/s12217-010-9225-6. [DOI] [Google Scholar]
- [22].Dattarajan S, Acoustically excited droplet combustion in normal gravity and microgravity, Ph.D. Dissertation, University of California, Los Angeles: (2004). [Google Scholar]
- [23].Ghoniem AF, Soteriou MC, Knio OM, Cetegen B, Effect of steady and periodic strain on unsteady flamelet combustion, Proceedings of the Combustion Insitute 24 (1) (1992) 223–230. doi: 10.1016/S0082-0784(06)80031-7. [DOI] [Google Scholar]
- [24].Sevilla-Esparza CI, Oscillatory flame response in acoustically coupled fuel droplet combustion, M.S. Thesis, University of California, Los Angeles: (2013). [Google Scholar]
- [25].Valentini D, Modelling and testing of chemical propulsion rocket subsystems, Ph.D. Dissertation, University of Pisa; (2015). [Google Scholar]
- [26].Huelsz G, López-Alquicira F, Hot-wire anemometry in acoustic waves, Experiments in Fluids 30 (3) (2001) 283–285. doi: 10.1007/s003480000174. [DOI] [Google Scholar]
- [27].Gaydon A, The Spectroscopy of Flames, Chapman and Hall, London, England. [Google Scholar]
- [28].Kojima J, Ikeda Y, Nakajima T, Spatially resolved measurement of oh*, ch*, and c∗2 chemiluminescence in the reaction zone of laminar methane/air premixed flames, Proceedings of the Combustion Institute 28 (2000) 1757–1764. [Google Scholar]
- [29].Diederichsen J, Gould R, Combustion instability: Radiation from premixed flames of variable burning velocity, Combustion and Flame 9 (1) (1965) 25–31. [Google Scholar]
- [30].Anders H, Christensen M, Johansson B, Franke A, Richter M, Alden M, A study of the homogeneous charge compression ignition combustion process by chemiluminescence imaging, SAE Technical Paper 1999–01-3680
- [31].Lawn C, Distributions of instantaneous heat release by the cross-correlation of chemiluminescent emissions, Combustion and Flame 123 (1) (2000) 227–240. [Google Scholar]
- [32].Haber L, Vandsburger U, Saunders W, Khanna V, An experimental examination of the relationship between chemiluminescent light emissions and heat-release rate under non-adiabatic conditions, Tech. rep., DTIC Document (2001)
- [33].Timmerman B, Bryanston-Cross P, Optical investigation of heat release and nox production in combustion, Journal of Physics Conference Series 85.
- [34].Marchese A, Dryer F, Nayagam V, Colantino R, Hydroxyl radical chemiluminescence imaging and the structure of microgravity droplet flames, Proceedings of the Combustion Institute (1996) 1219–1226.
- [35].Marchese A, Dryer F, Colantino R, Nayagam V, Microgravity combustion of methanol and methanol/water droplets: Drop tower experiments and model predictions, Proceedings of the Combustion Institute (1996) 1209–1217.
- [36].Struk PM, Ackerman M, Nayagam V, Dietrich DL, On calculating burning rates during fibre supported droplet combustion, Microgravity Science and Technology 11 (4) (1998) 144–151. [Google Scholar]
- [37].Leo MD, Saveliev A, Kennedy LA, Zelepouga SA, Oh and ch luminescence in opposed flow methan oxy-flames, Combustion and Flame 149 (4) (2007) 435–447. doi: 10.1016/j.combustflame.2007.01.008. [DOI] [Google Scholar]
- [38].Wegener JL, Multi-phase combustion and transport processes under the influence of acoustic excitation, Ph.D. Dissertation, University of California, Los Angeles: (2014). [Google Scholar]
- [39].Teshome S, Droplet combustion and non-reactive shear-coaxial jets with transverse acoustic excitation, Ph.D. Dissertation, University of California, Los Angeles: (2012). [Google Scholar]
- [40].Karagozian AR, Dahm WJA, Glasgow E, Howe R, Kroo I, Murray R, Shyu H, Technology options for improved air vehicle fuel efficiency, Tech. Rep. SAB-TR-06–04, Air Force Scientific Advisory Board Report (2006).
- [41].Erbschloe D, Air force alternative fuels process paves way to future, Tech. rep., Air Force Air Mobility Command, Sapphire Energy Report (2012).
- [42].Ogami Y, Sakurai S, Hasegawa S, Jangi M, Nakamura H, Yoshinaga K, Kobayashi H, Microgravity experiments of single droplet combustion in oscillatory flow at elevated pressure, Proceedings of the Combustion Institute 32.
- [43].Poling BE, Prausnitz JM, O’Connell JP, The Properties of Gases and Liquids, 5th Edition, McGraw-Hill, Boston, MA, 2001. [Google Scholar]
- [44].Law C, Williams F, Kinetics and convection in the combustion of alkane droplets, Combustion and Flame 19 (3) (1972) 393–405. doi: 10.1016/0010-2180(72)90009-0. [DOI] [Google Scholar]
- [45].Card J, Williams F, Asymptotic analysis of the structure and extinction of spherically symmetrical n-heptane diffusion flames, Combustion Science and Technology 84 (1–6) (1992) 91–119. doi: 10.1080/00102209208951847. [DOI] [Google Scholar]
- [46].Veloo P, Wang Y, Egolfopoulos F, Westbrook C, A comparative experimental and computational study of methanol, ethanol, and n-butanol flames, Combustion and Flame 157 (10) (2010) 1989–2004. doi: 10.1016/j.combustflame.2010.04.001. [DOI] [Google Scholar]
- [47].Ji C, Wang Y, Egolfopoulos F, Flame studies of conventional and alternative jet fuels, Journal of Propulsion and Power 27 (4) (2011) 856–863. doi: 10.2514/1.B34105. [DOI] [Google Scholar]
- [48].Turns SR, An Introduction to Combustion: Concepts and Applications, 8th Edition, McGraw-Hill Higher Education, Boston, MA, 2000. [Google Scholar]
- [49].Law CK, Recent advances in droplet vaporization and combustion, Progress in Energy and Combustion Science 8 (3) (1982) 171–201. [Google Scholar]
- [50].Kumagai S, Isoda H, Combustion of fuel droplets in a vibrating air field, Symposium (International) on Combustion 5 (1) (1955) 129–132. doi: 10.1016/S0082-0784(55)80019-7. [DOI] [Google Scholar]
- [51].Pfeil MA, Groven LJ, Lucht RP, Son SF, Effects of ammonia borane on the combustion of an ethanol droplet at atmospheric pressure, Combustion and Flame 160 (10) (2013) 2194–2203. doi: 10.1016/j.combustflame.2013.04.014. [DOI] [Google Scholar]
- [52].Godsave G, Studies of the combustion of drops in a fuel spray – the burning of single drops of fuel,, Symposium (International) on Combustion 4 (1) (1952) 818–830. doi: 10.1016/S0082-0784(53)80107-4. [DOI] [Google Scholar]
- [53].Blaszczyk J, Acoustically disturbed fuel droplet combustion, Fuel 70 (9) (1991) 1023–1025. doi: 10.1016/0016-2361(91)90254-8. [DOI] [Google Scholar]
- [54].Marble FE, Broadwell JE, The coherent flame model for turbulent chemical reactions, Tech. Rep. TRW-9-PU, Project Squid Report (1977).
- [55].Peters N, Laminar diffusion flamelet models in non-premixed turbulent combustion, Progress in Energy and Combustion Science 10 (3) (1984) 319–339. doi: 10.1016/0360-1285(84)90114-X URL http://www.sciencedirect.com/science/article/pii/036012858490114X [DOI] [Google Scholar]
- [56].Thevenin D, Candel S, Effect of variable strain on the dynamics of diffusion flame ignition, Combustion Science and Technology 91 (1–3) (1993) 73–94. doi: 10.1080/00102209308907634. [DOI] [Google Scholar]
- [57].Kistler J, Sung C, Kreutz T, Law C, Nishioka M, Extinction of counterflow diffusion flames under velocity oscillations, Proceedings of the Combustion Institute (1996) 113–120.
- [58].Egolfopoulos FN, Campbell CS, Unsteady counterflowing strained diffusion flames: diffusion-limited frequency response, Journal of Fluid Mechanics 318 (1996) 1–29. doi: 10.1017/S0022112096007008. [DOI] [Google Scholar]
- [59].Selerland T, Karagozian AR, Ignition, burning and extinction of a strained fuel strip with complex kinetics, Combustion Science and Technology 131 (1–6) (1998) 251–276. doi: 10.1080/00102209808935763. [DOI] [Google Scholar]
- [60].Im HG, Chen JH, Chen J, Chemical response of methane/air diffusion flames to unsteady strain rate, Combustion and Flame 118 (1–2) (1999) 204–212. [Google Scholar]
- [61].Panton RL, Incompressible Flow, John Wiley & Sons, Inc., Hoboken, NJ. [Google Scholar]
- [62].Glassman I, Yetter R, Combustion, Academic Press, San Diego, CA. [Google Scholar]
- [63].Tanvir S, Qiao L, Effect of addition of energetic nanoparticles on droplet-burning rate of liquid fuels, Journal of Propulsion and Power 31 (1) (2015) 408–415. doi: 10.2514/1.B35500. [DOI] [Google Scholar]
- [64].Narayanaswamy K, Pitsch H, Pepiot P, A component library framework for deriving kinetic mechanisms for multi-component fuel surrogates: Application for jet fuel surrogates, Combustion and Flame 165 (2016) 288–309. doi: 10.1016/j.combustflame.2015.12.013. [DOI] [Google Scholar]
- [65].Violi A, Chemistry and transport properties for jet fuel combustion, Tech. Rep. AFRL-OSR-VA-TR-2013–0168, Air Force Office of Scientific Research (2013).
- [66].Pfeil MA, Changes in combustion behavior of liquid fuels due to the addition of small amounts of ammonia borane or nano aluminum, M.S. Thesis, Purdue University; (2012). [Google Scholar]
- [67].Wood BJ, Wise H, Measurement of the burning constant of a fuel drop, Journal of Applied Physics 28 (9) (1957) 1068. [Google Scholar]


