Abstract
Cancer specific inhibitors reflective of unique metabolic needs, are rare. We describe a novel small molecule, Gboxin, that specifically inhibits primary mouse and human glioblastoma (GBM) cell growth but not mouse embryo fibroblasts or neonatal astrocytes. Gboxin rapidly and irreversibly compromises GBM oxygen consumption. Reliant on its positive charge, Gboxin associates with mitochondrial oxidative phosphorylation complexes in a proton gradient dependent manner and inhibits F0F1 ATP synthase activity. Gboxin resistant cells require a functional mitochondrial permeability transition pore that regulates pH impeding matrix accumulation. Administration of a pharmacologically stable Gboxin analog inhibits GBM allografts and patient derived xenografts. Gboxin toxicity extends to established human cancer cell lines of diverse organ origin and exposes the elevated proton gradient pH in cancer cell mitochondria as a new mode of action for antitumor reagent development.
Glioblastoma is the most aggressive and prevalent primary malignancy of the central nervous system1,2. Current treatments, dominated by radiotherapy and chemotherapy, target proliferating tumor cells and induce potent toxic side effects by harming normal proliferating cells3,4. It is possible that relatively quiescent cancer stem cells (CSCs) in tumors may evade conventional therapies3,5,6. CSCs can have metabolic characteristics that set them apart from proliferating tumor and somatic cells. While proliferative tumor cells rely on aerobic glycolysis, known as the Warburg effect, slow-cycling tumor cells may prefer mitochondrial respiration as a primary source of energy4,5,7-9.
Oxidative phosphorylation (OxPhos) plays a central role in cellular energy. Over 90 proteins encoded by both the nuclear and mitochondrial genomes comprise the OxPhos machinery. The OxPhos electron transport chain (ETC) constitutes four complexes (CI-CIV) that transfer electrons from donors generated by the TCA cycle and fatty acid oxidation to oxygen. Complexes I-IV pump protons out into the mitochondrial intermembrane space elevating pH inside this formed voltage gradient. Complex V (CV; F0F1 ATP synthase) uses the stored energy in the proton gradient to generate ATP. Reactive oxygen species (ROS), a byproduct of the ETC and ATP production, can be mitigated by several mechanisms including the mitochondrial permeability transition pore (mPTP)10,11. Several studies have examined the potential vulnerability of the ETC in cancer cells by inhibition of CI and some may hold promise upon continued validation12,14-17.
Here we describe a novel compound, Gboxin, isolated from a low passage primary culture cell-based high throughput chemical screen designed to filter out toxicity to wild type proliferating cells while limiting lethality to primary GBM stem-like cells. Cancer cells have an unusually high mitochondrial membrane potential and thus retain higher pH within the matrix18-21. Gboxin targets unique features of mitochondrial pH in GBM and other cancer cells, independent of their genetic composition, and exerts its tumor cell specific toxicity in primary culture and in vivo.
Primary GBM culture high throughput screen.
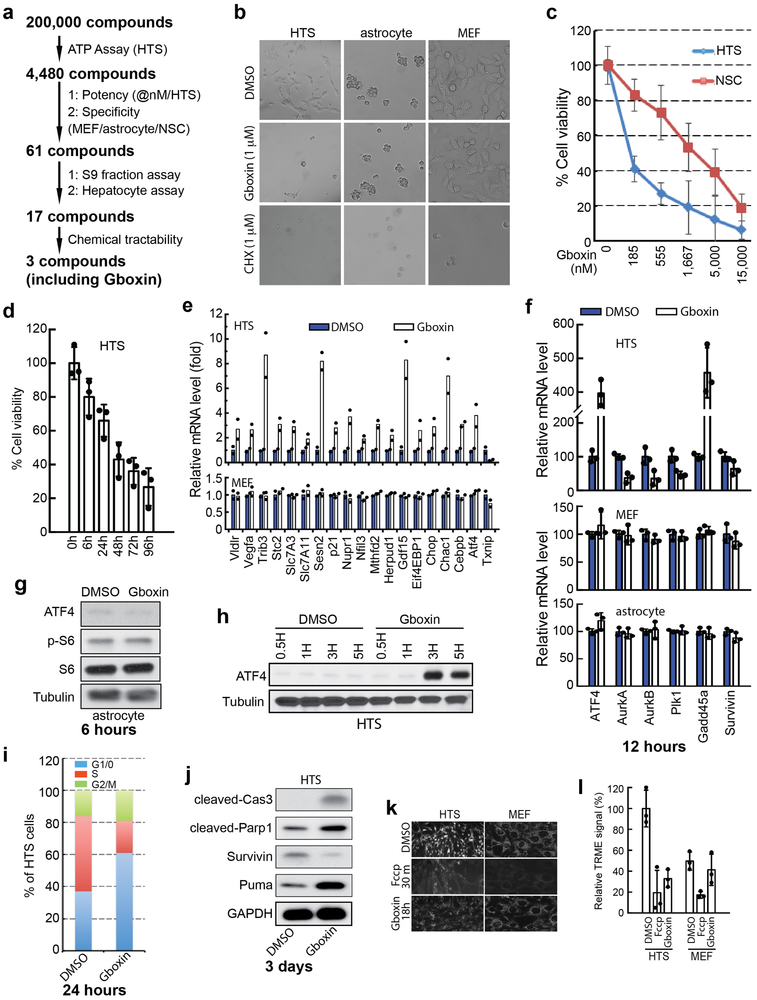
Previous cell-based “anticancer” drug screens have predominantly identified agents that interfere with mitosis, replication, or DNA damage repair22,23. To differentiate between cancer cells and normally dividing cells we considered experimental features to afford improved physiological relevance including use of primary early passage tumor cells, serum free conditions, and low oxygen tension (5%; normoxia). We used a spontaneous GBM mouse model with mutations in three GBM relevant tumor suppressors (Trp53, Pten, and NF1) under hGFAP-cre transgene mediated recombination24,25. Low passage sphere cultures from multiple tumors were pooled to establish primary “high throughput tumor sphere” (HTS) cells frozen as pooled aliquots and used for the entire screening process (see Methods). Using a 96-hour Cell-Titer-Glo® protocol, a chemical screen of 200,000 compounds was performed (Extended data Fig. 1a). To exclude nonspecific or anti-mitotic associated toxicity, a counter screen against primary low passage mouse embryonic fibroblasts (MEFs), neonatal astrocytes, and primary subventricular zone neural stem/progenitor cells (NSCs) was performed. 61 compounds emerged as specific inhibitors of HTS cells with IC50s in the nanomolar range and therapeutic windows ranging from 1 to 3 logs (data not shown). We tested the 61 compounds in S9 fraction and hepatocyte assays, which yielded 17 compounds that were further tested for chemical tractability (Extended data Fig. 1a).
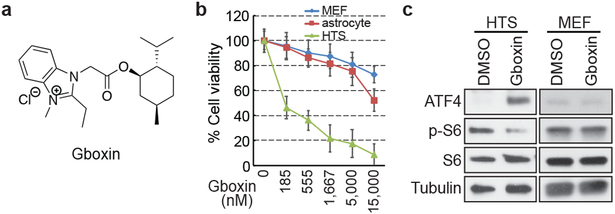
Here we describe the properties of one lead compound, a benzimidazolinium (hereafter Gboxin; IC50: 150 nM; Fig. 1a, b), and its chemical derivatives that specifically inhibit HTS GBM cell growth but not cycling primary MEFs or astrocytes (Fig. 1b and Extended Data Fig. 1b) with irreversible Gboxin growth inhibition between 6 and 24 hours of exposure (Extended data Fig. 1d). Gboxin inhibits wild type neural stem/progenitor cell (NSC) growth but with a greater than tenfold higher IC50 (Extended Data Fig. 1c). Transcriptional microarray analysis after Gboxin treatment revealed specific and sustained gene expression changes in HTS cells versus MEFs and astrocytes including cell cycle and survival regulating genes such as, ATF4, and Survivin (Extended Data Fig. 1e,f and Supplementary Table 1), and Gene Ontology (GO) analysis identified multiple upregulated ATF4 stress response targets (Extended Data Fig. 1e,f; and Supplementary Table 1)26-28. Western blot analysis confirmed HTS specific elevation of ATF4 protein at 3 and 6 hours (Fig. 1c; Extended Data Fig. 1g,h). We also investigated several cancer associated signal transduction pathways following 6 hour Gboxin exposure and found that ATF4 upregulation is temporally accompanied by decreased phosphorylated-S6 levels (p-S6; Fig. 1c). Within 24 hours HTS cells underwent cell cycle arrest (G1/0:S ratio increase) followed by an apoptosis molecular signature within 3 days (Extended data Fig. 1i,j). Thus, in primary GBM (HTS) cells, Gboxin elicits rapid and specific responses leading to cell death that is not manifested in cycling primary MEFs or astrocytes.
Figure 1. Gboxin, a benzimidazolium compound kills primary GBM (HTS) cells but not MEFs or astrocytes.
a. Gboxin structure. b. Cell viability assays (% Cell viability) for HTS, MEF and astrocyte cells exposed to increasing doses of Gboxin (96 hours. Mean ± SD; n=3). c. HTS specific upregulation of ATF4 and suppression of phospho-S6 (p-S6) by western blot analyses (DMSO or Gboxin; 1 μM; 6 hours ). n=3.
Gboxin disrupts primary GBM cell metabolism.
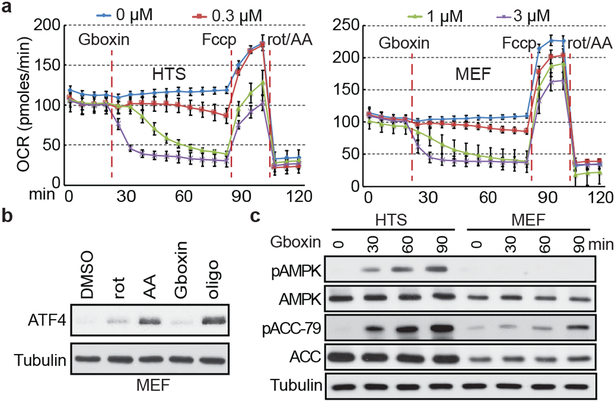
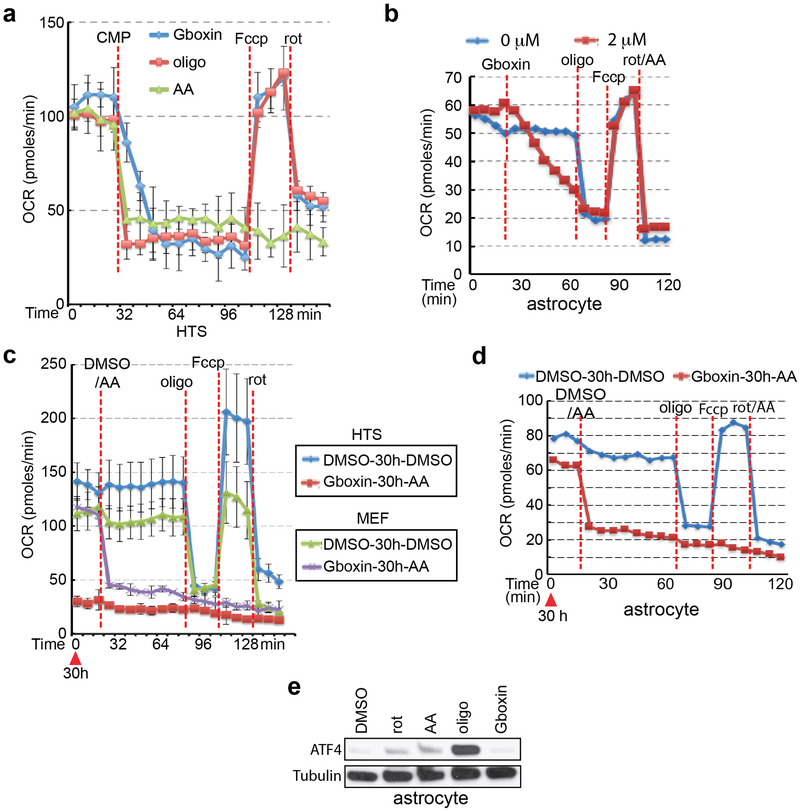
The microarray data showed rapid and sustained transcriptional suppression of Txnip, a regulator of glucose uptake, consumption, and target of oxidative phosphorylation (OxPhos)29,30 (Extended Data Fig. 1e). We examined the status of mitochondrial membrane potential assayed by tetramethylrhodamine ethyl ester perchlorate (TMRE) stain following extended Gboxin treatment31 indicating reduced membrane potential in HTS cells but not in MEFs (Extended Data Fig. 1k,l). We next performed O2 consumption rate (OCR) measurements that showed a dose dependent Gboxin inhibition equally potent to well characterized OxPhos inhibitors (Fig. 2a; Extended Data Fig. 2a). Despite its unique lethality to HTS cells, Gboxin also caused acute OCR depletion in MEFs and astrocytes (Fig. 2a and Extended Data Fig. 2b). However, prolonged (30 hr.) OCR measurement showed that MEFs and astrocytes fully recover (Extended Data Fig. 2c,d). Consistent with the above data, the OxPhos inhibitors rotenone, antimycin A, and oligomycin A which both acutely and chronically impede OCR in all cells, rapidly induced ATF4 in MEFs and astrocytes (Fig. 2b; Extended Data Fig. 2e). AMPK, a rheostat for ATP availability is activated in response to OxPhos inhibition and Gboxin treated HTS cells showed rapid and robust elevation of phospho-AMPK and its target, phospho-ACC-79 (Fig. 2c)32. These data indicate a differential activity of sustained OxPhos inhibition by Gboxin on GBM cells versus wild type cells.
Figure 2. Gboxin inhibits cellular oxygen consumption.
a. Seahorse analyzer assays show HTS (left) and MEF (right) cells undergo acute oxygen consumption (OCR) inhibition. Gboxin (24 min.) at 4 doses (represented by 4 colored lines), Fccp (84 min.); and mixture of rotenone and antimycin A (rot/AA, 112 min.). Mean ± SD; n=3. b. Western blot analyses indicate ATF4 induction in MEFs treated with oligomycin A (oligo, 1 μM), rotenone (rot, 1 μM) or antimycin A (AA, 1 μM) for 6 hours, but not when treated with Gboxin (1 μM). n=3. c. Western blot analyses indicating Gboxin (1 μM) mediated activation of phospho-AMPK (pAMPK) and phospho-ACC-79 (pACC-79) in HTS cells but not MEFs treated for the indicated time periods. n=2.
Gboxin interacts with respiratory chain proteins.
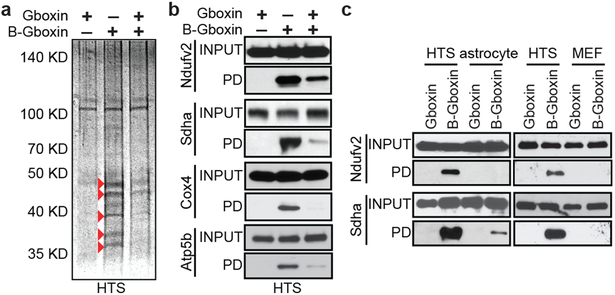
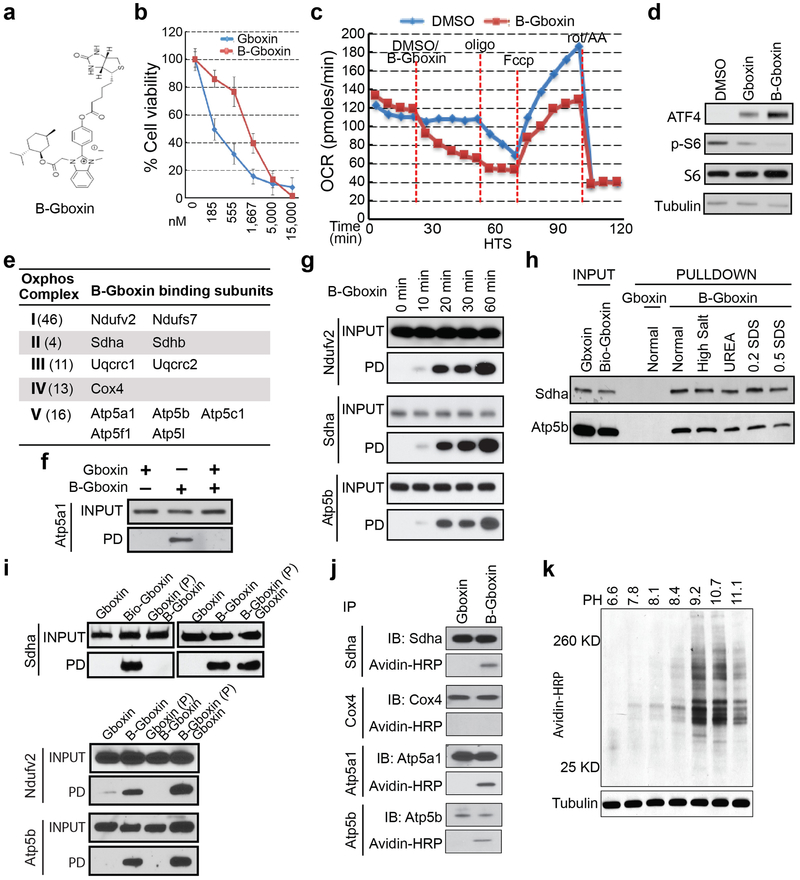
Through structure activity relationship studies (SAR33) we determined that the positive charge on Gboxin is essential for activity (data not shown). We further identified an active analog amenable to biotin moiety modification (B-Gboxin; IC50: 1,530 nM for HTS cells; Extended Data Fig. 3a,b). B-Gboxin conserves Gboxin properties including OCR inhibition, ATF4 induction, and phospho-S6 protein reduction (Extended Data Fig. 3c,d). Biotin mediated pull down experiments using HTS cells pre-treated with B-Gboxin followed by electrophoresis resolved multiple silver stained bands that were absent or reduced when preincubated with unbiotinylated Gboxin, indicating a Gboxin specific interaction (Fig. 3a). Mass-spec analysis of eluate from pull down samples from Gboxin, B-Gboxin, and Gboxin/B-Gboxin treated HTS cells confirmed Gboxin specific interactions and further revealed a biased presence of mitochondrial proteins (Supplementary Table 2). We next purified mitochondria from pretreated HTS cells for pull down and mass spec analysis. Of 58 detected proteins, 12 are components of the OxPhos machinery (Supplementary Table 3 and Extended Data Fig. 3e) including all ETC complexes with CV best represented (5 proteins; Extended Data Fig. 3e). We confirmed OxPhos component interactions using antibodies against components of CI, CII, CIV, and CV, respectively (Fig. 3b and Extended Data Fig. 3f) and showed that B-Gboxin/OxPhos protein interactions occur within 10 minutes (Extended Data Fig. 3g).
Figure 3. B-Gboxin interacts with GBM OxPhos proteins.
a. SDS gel protein silver stain from B-Gboxin pull down assay using live HTS cells treated with: Gboxin, B-Gboxin, or Gboxin followed by B-Gboxin, demonstrates Gboxin specific interactions. Red arrowheads highlight reduced or absent protein bands following Gboxin pretreatment. n=4. b. Biotin pulldown followed by western blot with specific antibodies for Ndufv2, Sdha, Cox4, and Atp5b validate OxPhos protein interaction with Gboxin moiety of B-Gboxin. HTS cells treated with Gboxin, B-Gboxin, or Gboxin followed by B-Gboxin. n=3. c. Reduced MEF and astrocyte OxPhos protein association with B-Gboxin. n=3.
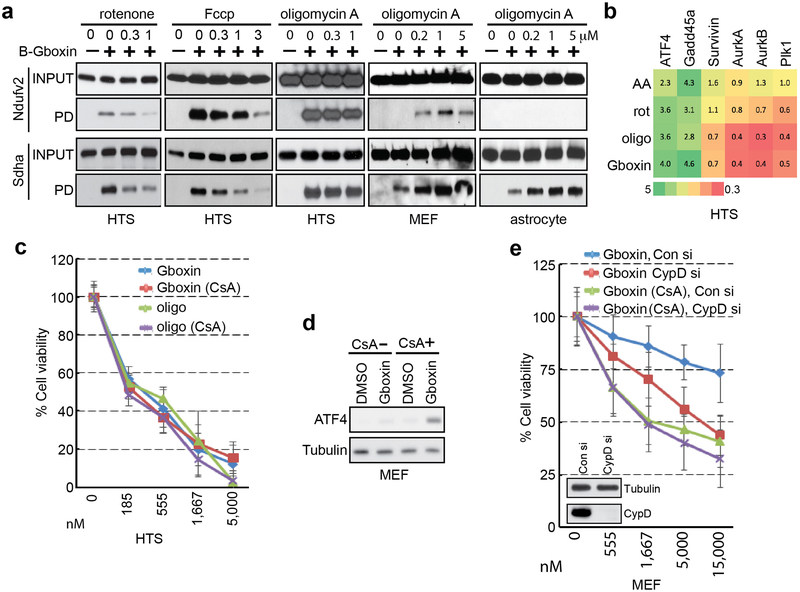
Co-purification interactions between B-Gboxin and OxPhos proteins in Gboxin resistant cells is considerably weakened or absent compared to those in HTS cells (Fig. 3c). Also, detection of B-Gboxin/OxPhos protein interactions requires whole cell pre-incubation and cannot be achieved with incubation of cell lysates (data not shown). Thus, the specific association with OxPhos proteins may be related to the unique environment created by the proton gradient across the mitochondrial inner membrane of cancer cells. To test this, we assayed B-Gboxin/OxPhos protein association in HTS cells in the presence of proton gradient inhibitors. Rotenone and Fccp (a hydrogen ionophore) cause rapid reduction of the mitochondrial inner membrane proton gradient and inhibited B-Gboxin interaction with OxPhos proteins. Conversely, oligomycin A acutely increases the proton gradient and augmented B-Gboxin/OxPhos protein interactions in primary MEFs and astrocytes (Extended Fig. Data 4a).
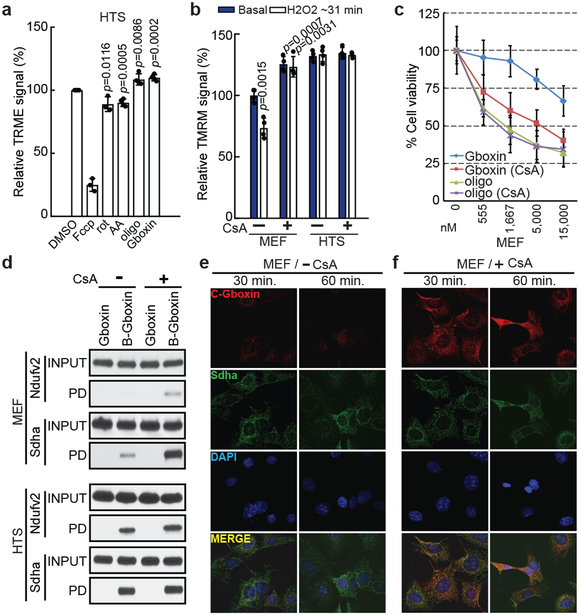
Several indicators point to CV as the functional target for Gboxin mediated cell death. OCR data demonstrate that, like CV inhibitor oligomycin A, Gboxin OCR inhibition can be bypassed by the proton ionophore, Fccp, while CI and CIII inhibitors cannot (Fig. 2a; Extended Data Fig. 2a). Furthermore, like oligomycin A, Gboxin causes an acute increase in mitochondrial membrane potential (Fig. 4a). In contrast antimycin A and rotenone cause an acute reduction of membrane potential (Fig. 4a). Finally, comparison of HTS cell gene expression following exposure to rotenone, antimycin A, oligomycin A, or Gboxin shows a related profile for oligomycin A and Gboxin (Extended Data Fig. 4b).
Figure 4. Gboxin mirrors oligomycin activity and resistance requires functional mPTP.
a. Acute increase of mitochondrial inner membrane potential (relative TRME signal analyzed by flow cytometry) shows similarity between Gboxin and oligomycin A (oligo, CV inhibitor) contrasted with acute membrane depolarization by inhibitors of other complexes. HTS cells treated with DMSO, Fccp (ionophore), rotenone (rot, CI inhibitor), antimycin A (AA, CIII inhibitor), oligomycin A or Gboxin for 10 minutes. Mean ± SD; n=3 for Fccp and rotenone, and n=4 for the rest. Note: CI and CIII inhibitors cause acute reduction of mitochondrial membrane potential. b. H2O2 reduces basal membrane potential in MEFs but not HTS cells. Cyclosporin A (CsA) mPTP inhibition enhances MEF membrane potential and renders them insensitive to ROS (H2O2). HTS cells exhibit higher basal membrane potential and are unresponsive to ROS and CsA. Mean ± SD; n=4. c. CsA sensitizes MEF toxicity to Gboxin > ten-fold. Mean ± SD; n=3. d. MEF mPTP inhibition by CsA elicits B-Gboxin association with OxPhos proteins. Western blots for OxPhos proteins from B-Gboxin pulldown assay using HTS and MEF cells treated with Gboxin or B-Gboxin in CsA presence or absence. PD: pulldown. n=3. e. Minimal C-Gboxin accumulation in MEF mitochondria. n=3. f. CsA induces rapid and sustained mitochondrial accumulation of C-Gboxin comparable in MEFs. n=3. C-Gboxin was probed with an Azide Fluor, and mitochondria were stained with CII Sdha antibody.
Blunted mPTP activity in GBM cells.
The B-Gboxin mitochondrial extract pull downs also identified the protein Adt2, a component of the mPTP (Supplementary Table 3), an unselective voltage-dependent channel to molecules of molecular mass <1.5 kDa11,34-36. Elevated reactive oxygen species (ROS) inside the mitochondrion can be expelled by transient opening of mPTP to reduce membrane potential10. mPTP activity was examined by membrane potential assays using tetramethylrhodamine methyl ester perchlorate (TMRM) fluorescence intensity, and mPTP specific blockade was achieved using the inhibitor, Cyclosporin A (CsA). Under basal conditions, MEFs respond to ROS (H2O2) by reducing membrane potential through opening of mPTP. CsA inhibition of the pore increases basal MEF membrane potential that in the presence of ROS, cannot be relieved (Fig. 4b). In contrast, HTS cells show an elevated basal membrane potential that remains unresponsive to CsA or H2O2 (Fig. 4b)19,21. CsA had no measurable effects on Gboxin function and toxicity in HTS cells (Extended Data Fig. 4c), but remarkably, in the presence of CsA, MEFs became Gboxin sensitive (Fig. 4c), accompanied by rapid ATF4 induction (Extended Data Fig. 4d) and strengthened association of OxPhos proteins with B-Gboxin (Fig. 4d). To exclude possible off-target effects of CsA, we complemented the studies with siRNAs directed against cyclophilin D (CypD; encoded by the PPIF gene), the mPTP target of CsA and achieved similar results (Extended Data Fig. 4e)37. Thus a functional mPTP is essential for Gboxin resistance.
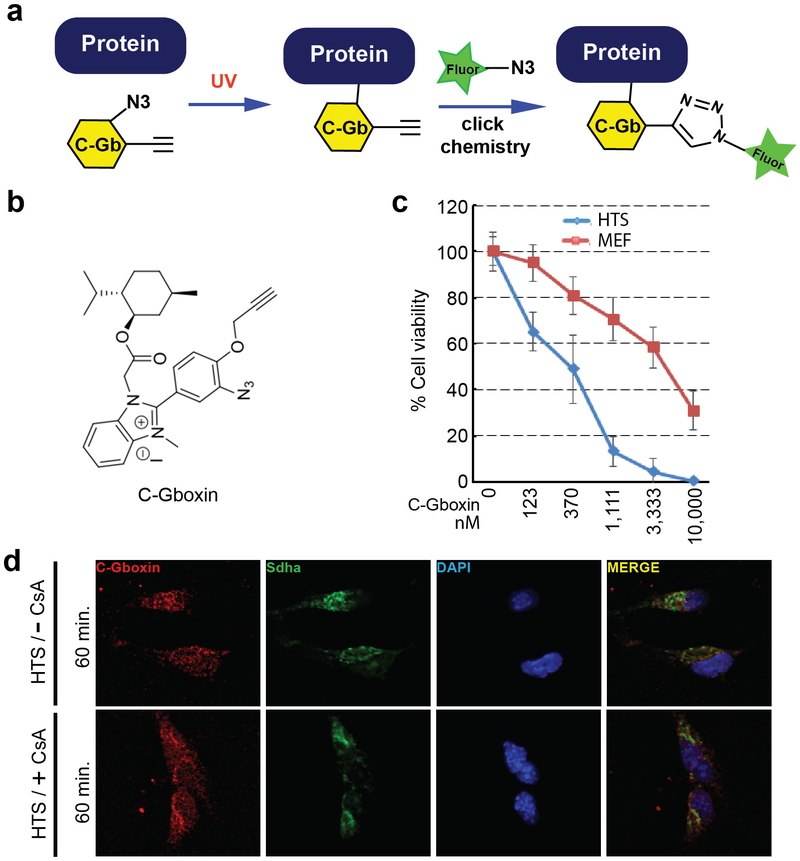
The Gboxin SAR also yielded a functional analog amenable for live cell UV crosslink conjugation (C-Gboxin; IC 50: 350 nM) that can be probed with an Azide Fluor via click chemistry (Extended Data Fig. 5a-c)38. As demonstrated by immunofluorescence colocalization with the OxPhos CII component, SDHA, there is high accumulation of C-Gboxin in GBM cell (HTS) mitochondria (Extended Data Fig. 5d). In contrast resistant MEFs show limited mitochondrial C-Gboxin accumulation (Fig. 4e) that is reversed by CsA (Fig. 4f). These data verify the preceding biochemical data demonstrating that Gboxin specifically accumulates in cancer cell mitochondria. Cyclosporin mediated blockade of mPTP elevates mitochondrial pH (Fig. 4b), Gboxin accumulation and association with OxPhos proteins (Fig. 4d,f); and causes cellular toxicity (Fig. 4c) to previously resistant MEFs.
Gboxin toxicity extends to human tumor cells.
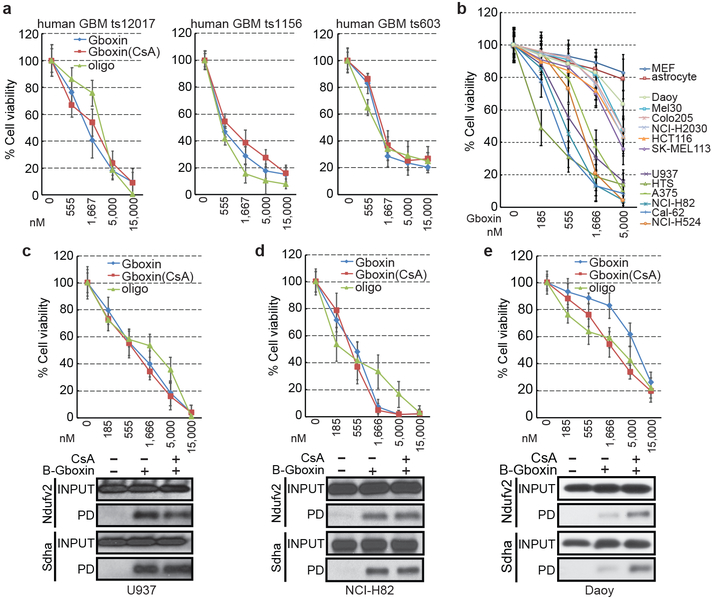
We next tested Gboxin activity on three independent GBM primary mouse cultures (Extended data Fig. 6a) and three GBM patient derived cultures (see Methods; Fig. 5a). All cultures exhibited Gboxin sensitivity with mouse cells having lower IC50 (~150 nM) than human GBM cells (~1 μM; Fig. 5a); indicating blunted mPTP activity in GBM cells of diverse origin39-41.
Figure 5. Gboxin toxicicity on primary human GBM cells and tumor cell lines.
a. Gboxin inhibition of three primary human GBM cell cultures harboring different mutational spectra (ts12017, ts1156 and ts603; see Methods for details) treated with increasing doses of oligomycin A or Gboxin in the presence/absence of CsA (1 μM). n=3. Mean ± SD. b. Gboxin toxicity in multiple human cancer cell lines compared to resistant primary MEFs and astrocytes. All cells tested with the exception of Daoy cells demonstrate a therapeutic index. Mean ± SD; n=3. c-e. Top panels (Mean ± SD): Cell viability assays for Gboxin sensitive U937 & NCI-H82 (c,d), and resistant Daoy (e; IC50: 8,256 nM) human cancer cells treated with increasing doses of oligomycin A or Gboxin in the presence/absence of CsA (1 μM). Daoy cells acquire sensitivity in the presence of CsA (IC50: 1,867 nM). Bottom panels: Western blot images for OxPhos proteins from pull down assays using cells treated with B-Gboxin in the presence/absence of CsA (1 μM). Resistant Daoy cells acquire enhanced OxPhos protein interaction with B-Gboxin only in the presence of CsA. n=3.
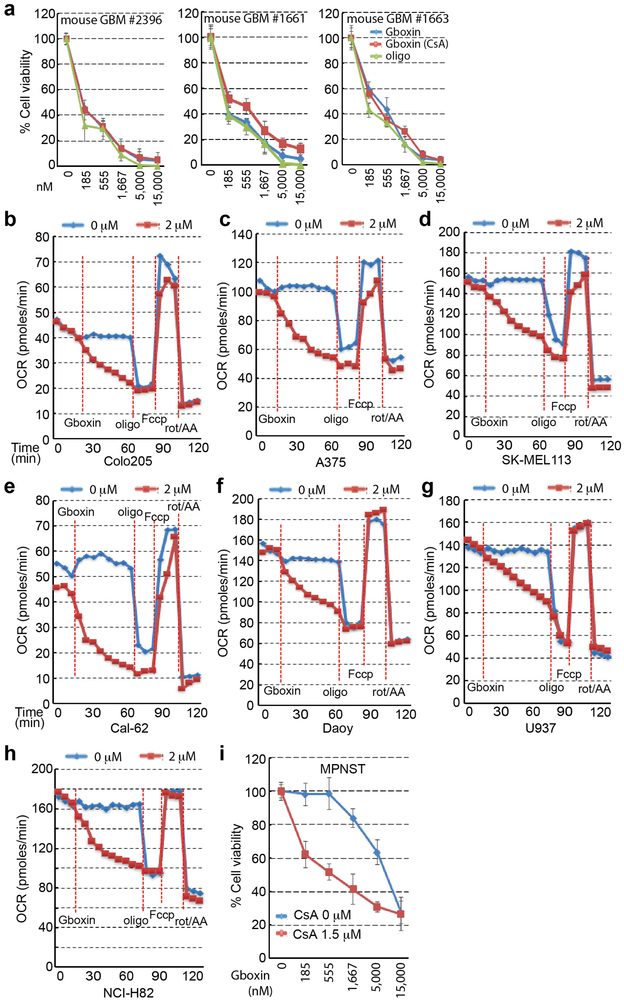
We also assessed the scope of Gboxin activity on well annotated human cancer cell lines derived from diverse tumor types (Fig. 5b-e; and data not shown). A majority of cancer cell lines were Gboxin sensitive with therapeutic windows compared to wild type resistant MEFs and astroctyes (Fig. 5b). OCR assays confirmed Gboxin coupled respiration blockade in representative cell lines (Extended Data Fig. 6b-h). Two cell lines exhibited Gboxin resistance: Daoy human medulloblastoma cells and primary murine malignant peripheral nerve sheath tumor (MPNST) cells42. These resistant tumor cells acquire Gboxin sensitivity and enhanced B-Gboxin OxPhos protein association upon CsA inhibition of the mPTP (Fig. 5e; Extended Data. Fig. 6i). Given the diverse genotypic drivers present in the sensitive human GBM and cancer cell lines, it appears that Gboxin activity is not tied to the specific driver mutations used to the generate the HTS GBM cell screen (NF1, Trp53, and Pten). Moreover, a correlation emerges that, like MEFs, the few Gboxin resistant cancer cells have a CsA responsive, functional mPTP.
Gboxin inhibits mouse and human GBM growth.
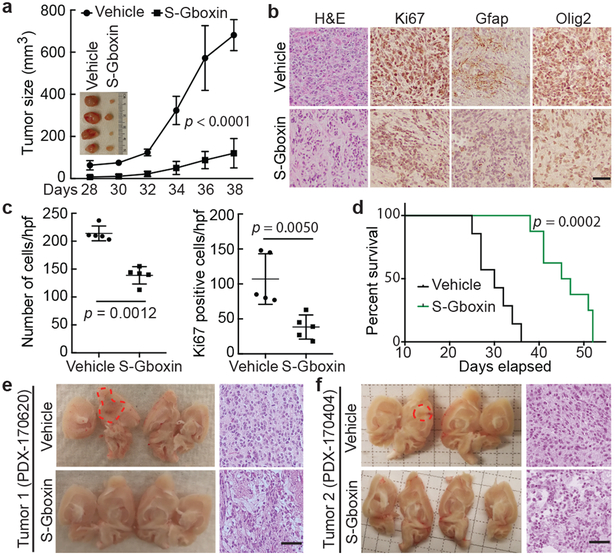
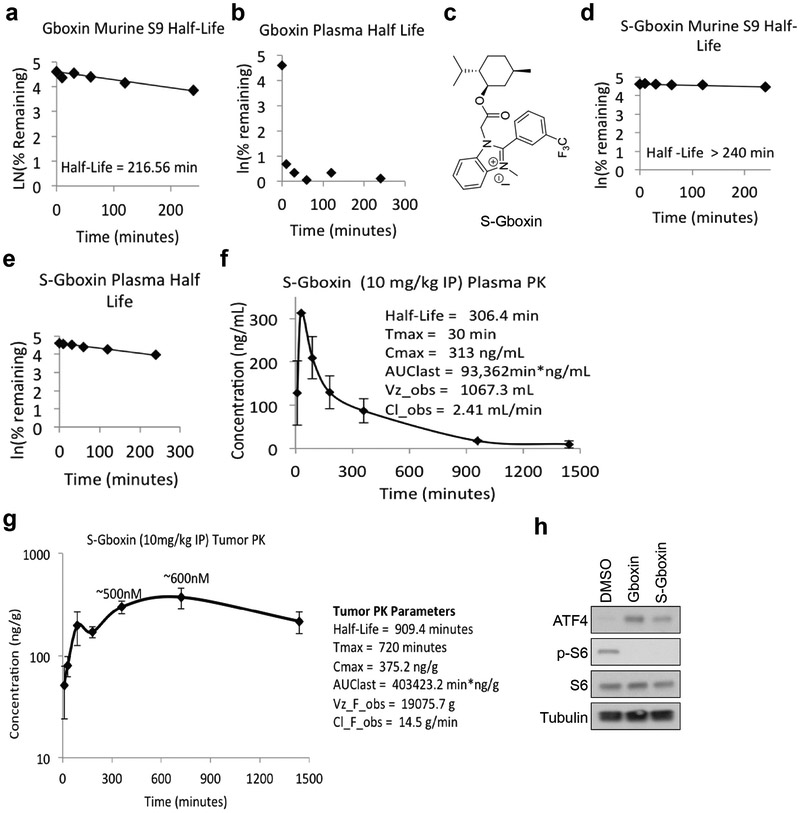
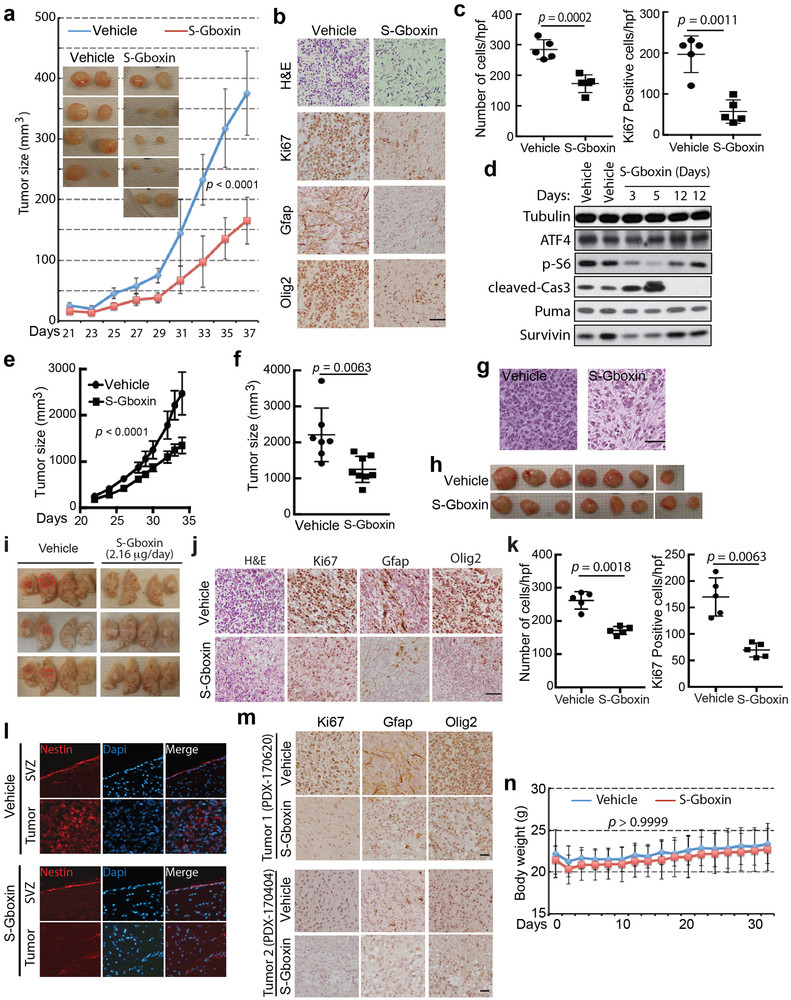
Through the SAR studies, we identified a functional analog (S-Gboxin; IC50: 470 nM; Extended Data Fig. 7a-h) that retained excellent metabolic stability, enhanced plasma stability, and PK-properties (Extended Data Fig. 7d-g) suitable for in vivo studies. Antitumor activity was first assessed by daily S-Gboxin treatment at 10 mg/kg/day beginning on day 3 or day 14 after mouse GBM (HTS cells) allograft flank implantation (Fig. 6a and Extended Data Fig. 8a). S-Gboxin treated mice showed reduced tumor volume, cellular density, proliferation, and enhanced survival in comparison to vehicle controls (Fig. 6b-d and Extended Data Fig. 8b-d). S-Gboxin treated tumors had reduced expression of the high-grade glioma makers, GFAP and Olig2 (Fig. 6b and Extended Data Fig. 8b). Primary human GBM cells were also injected into flanks of immunocompromised mice in the presence of matrigel. After visible tumors were detected (3 days) S-Gboxin was administered daily (10 mg/kg/day) resulting in significant attenuation of growth and decreased cellular density compared to controls (Extended Data Fig. 8e-h).
Figure 6. S-Gboxin inhibits GBM growth in vivo.
a-d, 105 HTS cells injected subcutaneously treated daily with vehicle/S-Gboxin (intraperitoneally; IP) commencing 3 days after allograft. a. Graph indicates tumor growth by volume (WxLxH) assessed every 2 days. Inset image of representative tumors. Vehicle: n=6, S-Gboxin: n=9; Mean ± SD; two-way ANOVA. b. H&E and immunohistochemical staining indicate reduced cellularity, proliferation, and glioma marker expression (Gfap and Olig2) in S-Gboxin treated tumors. n=2. c. Quantification of tumor cellular density (left) and Ki67 positive cells (right) in DMSO/S-Gboxin treated mouse flank tumors. For each group, 5 representative images from 2 tumors/group were used. Mean ± SD; paired t test, two-tailed. d. Kaplan-Meier survival analysis of mice indicating death when tumor volume > 300 mm3. Vehicle: n=7, S-Gboxin n=8; log-rank (Mantel-Cox) test. e-f. Intracranial transplantation of two independent primary passage patient derived GBM tumors (PDX-170620 and PDX-170404) treated via minipumps with vehicle or S-Gboxin. Vehicle: PDX-170620 (n=1) and PDX-170404 (n=1); S-Gboxin: PDX-170620 (n=1) and PDX-170404 (n=2). Dissected brains (left in e and f) and H&E staining (right in e and f) indicating reduced cellularity. Dotted red lines trace the main tumor area. See also Extended data Fig. 8m. Scale bar = 50 μm; Hpf-high power field.
To overcome poor blood brain barrier penetration, we used catheter delivery to test activity in intracranial tumors. Primary mouse GBM cells were orthotopically transplanted followed by a two-week period to allow tumor seeding and surgery recovery, after which catheters were implanted at the site of injection to deliver S-Gboxin locally through subcutaneous minipumps (2.16 μg/day/mouse; see Methods for details). S-Gboxin treatment inhibited tumor growth as manifested by reduced hemorrhaging, cellular density, and decreased proliferation (Extended Data Fig. 8i-k). Histopathology analysis further showed reduced expression of the high-grade glioma makers (Extended Data Fig. 8j,l).
We next tested two independent patient derived xenografts (PDXs). Freshly engrafted patient GBM (P0) were harvested from symptomatic PDX mice and homogenized (Patient Tumor 1) or dissociated into single cells (Patient Tumor 2), and orthotopically implanted into brains of 4 mice each without culturing or additional manipulations (P1). Two weeks (Tumor 1) or 4 weeks (Tumor 2) later, minipumps were implanted to deliver vehicle or S-Gboxin to the tumor area. All vehicle treated mice first showed symptoms of morbidity (41–65 days), and were sacrificed for analysis. S-Gboxin demonstrated inhibition of GBM PDX growth as manifested by general health status, reduced cellular density, cellular proliferation, and GBM marker expression (Fig. 6e,f and Extended Data Fig. 8m). Despite daily in vivo delivery over a four-week period or more, no weight loss (Extended Data Fig. 8n), or overt signs of general health deficits were detected in treated mice (data not shown). We also examined the status of the SVZ stem cell niche following intracranial S-Gboxin treatment. Representative comparison of endogenous Nestin staining from control and S-Gboxin treated tumor bearing mice showed no abnormalities or loss of Nestin staining in the SVZ despite the obvious reduction of Nestin positive cells within the treated tumors (Extended Data Fig. 8l).
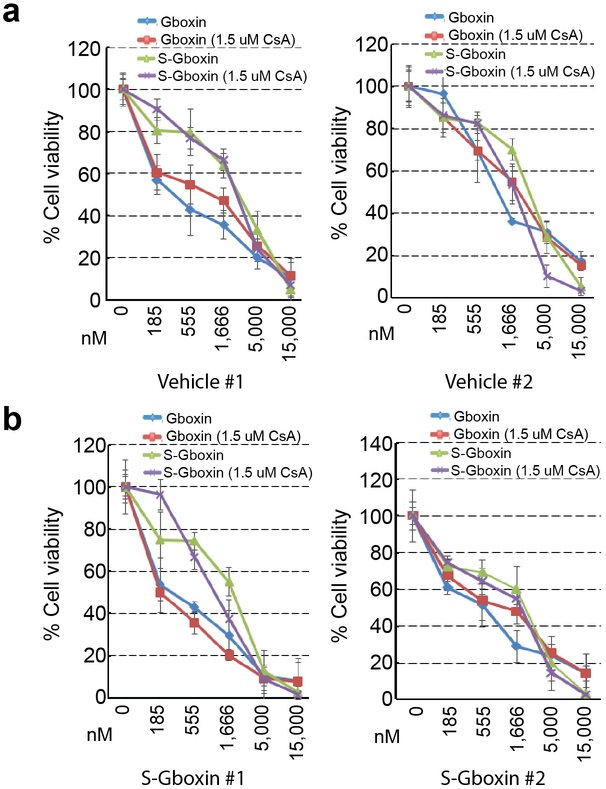
Finally, primary cultures from residual S-Gboxin treated tumors were tested for acquired Gboxin resistance. Four independent tumor primary cultures (two treated with S-Gboxin and two vehicle controls) were tested for Gboxin and S-Gboxin sensitivity. All tumor derived cultures retained full Gboxin sensitivity (Extended Data Fig. 9a,b). Thus, the failure of S-Gboxin to completely abrogate in vivo tumor growth is likely the consequence of inefficient access to the tumor over time and not to acquired resistance through secondary mechanisms, including reactivation of mPTP function.
Discussion.
Effective eradication of proliferating cells does not always result in meaningful therapeutic value. One possible explanation may lie in tumor heterogeneity and the presence of resistant quiescent stem-like cells. Here we sought to identify candidate antitumor molecules that would not display toxicity onto normal cycling cells.
Multiple mitochondrial functions are modified to sustain the cancer cell, and thus may in turn serve as cancer specific targets43-46. Many studies have investigated CI OxPhos inhibitors as cancer therapeutic targets with varying results13,14,47-49. Whether they will inhibit primary culture tumor cells, or in vivo tumors with acceptable toxicity parameters remains to be fully determined13,14. Gboxin, a novel CV inhibitor, relies on its positive charge to accumulate in GBM mitochondria with irreversible toxic effects through rapid and sustained blockade of mitochondrial respiration coupled oxidative phosphorylation. Gboxin resistance in wild type cells rested on functional activity of the mPTP. This uncovers a novel mechanism of action for targeting tumor cells dependent on the heightened proton gradient present across the mitochondrial inner membrane of GBM and other cancer cells tested (Extended Data Fig. 10)50. Elucidation of underlying causes for this apparent mPTP deficit in GBM and other Gboxin sensitive cancer cells merits careful scrutiny and may shed additional light on how metabolism alterations in cancer cells may be targeted.
Primary cultures established from residual treated tumor explants continued to exhibit Gboxin toxicity suggesting that improved delivery, or coupling with additional antitumor agents may serve to completely eradicate tumor growth. The scope of Gboxin toxicity appears to be unrelated to specific driver mutations. Its extended activity to human cancer cell lines opens the possibility that a larger subset of cancers may be susceptible to Gboxin and related targeting strategies.
Supplementary Material
Extended Data
Extended Data Figure 1. Gboxin, isolated from 200,000 compound screen, specifically inhibits GBM growth (HTS cells) but not MEFs or astrocytes.
a. Flow chart of the primary and secondary compound screens performed with HTS, MEF, astrocyte and neural/progenitor stem cells (NSCs). b. Representative live cell images show Gboxin specific toxicity of HTS cells. Cells were treated with DMSO, Gboxin (1 μM) or cycloheximide (CHX, 1 μM) for 3 days. n = 4. c. Cell viability assays for SVZ derived primary neural stem/progenitor cells (NSCs) and HTS cells treated with increasing doses of Gboxin indicate a therapeutic window for HTS cells. n = 3; mean ± SD. d. Cell viability assays show irreversible growth inhibition in HTS cells as early as 6-hours following Gboxin (1 μM) exposure. Cells were exposed to Gboxin for the indicated time periods followed by culturing in Gboxin free medium. Assay was performed 96 hours after initial compound treatment. n = 3; mean ± SD. e. Gboxin induces specific transcription alterations in HTS cells. mRNA specific RT-qPCR analyses in MEFs and HTS cells treated with DMSO or Gboxin for 12 hours. n = 2. f. mRNA specific RT-qPCR assays in HTS, MEF and astrocyte cells treated with DMSO or Gboxin (1 μM) for 12 hours demonstrate HTS specific up and down regulation of gene expression. Mean ± SD; n = 3. g. Representative western blot analyses with astrocyte cells treated with DMSO or Gboxin (1 μM) for 6 hours indicate no effect of Gboxin on expression of ATF4 and phospho-S6 (p-S6). n = 3. h. Representative western blot analyses using HTS cells exposed to DMSO or Gboxin (1 μM) detect ATF4 upregulation within 3 hours after Gboxin treatment. n = 2. i. HTS cell cycle progression analyzed by flow cytometry of cells treated with DMSO or Gboxin (1 μM) for 24 hours indicates an increase of G1/0:S ratio. j. Representative western blot analyses for proteins involved in apoptosis and survival with HTS cells treated with DMSO or Gboxin (1 μM) for 3 days. n = 3. k. Extended Gboxin exposure causes reduction of mitochondrial membrane potential in HTS cells. Representative images for TMRE staining show HTS cell specific neutralization of mitochondrial membrane potential after an 18-hour incubation with Gboxin. n = 3. l. quantification for k. Mean ± SD.
Extended Data Figure 2. Gboxin mediated OxPhos inhibition is reversible in wildtype MEFs and astrocytes.
a-d. Graphs show oxygen consumption rates (OCR) as measured by Seahorse analyzer. a. OCR inhibition of HTS cells by three different compounds (CMP; 32 min.): Gboxin (blue), oligomycin A (red), and antimycin A (green). Fccp (112 min.) and rotenone (136 min.). n = 3; mean ± SEM. b. Gboxin causes acute OCR inhibition in primary neonatal astrocytes (2 μM, red line, 24 min.), oligomycin A (66 min.), Fccp (84 min.), and a mixture of rotenone and antimycin A (102 min.); n = 2. Mean is shown. c. MEFs (green and purple) but not HTS cells (blue and red) regain normal OCR in the presence of Gboxin. Cells pretreated with DMSO (blue and green) or Gboxin (red and purple) for 30 hours (time = 0; red arrowhead). Following the addition of DMSO (blue and green) or antimycin A (red and purple) at 24 min., oligomycin A (88 min.), Fccp (112 min.), and rotenone (136 min.). n = 3; mean ± SEM. d. Astrocytes overcome Gboxin mediated inhibition of OCR. Cells were pretreated with DMSO (blue line) or Gboxin (red lines) for 30 hours (time=0; red arrowhead), followed by the addition of DMSO (blue) or antimycin A (red) at 30hrs. + 18 min., oligomycin A (66 min.), Fccp (84 min.) and a mixture of rotenone and antimycin A (102 min.). n = 2; Mean is shown. e. Representative western blot analyses with astrocytes indicate that, unlike known OxPhos inhibitors, Gboxin treatment does not induce ATF4 expression after a 12-hour exposure. n = 3. rot: rotenone; AA: antimycin A; oligo: oligomycin A; rot/AA: a mixture of rotenone and antimycin A.
Extended Data Figure 3. B-Gboxin interacts with OxPhos proteins.
a. B-Gboxin: structure of Gboxin with covalently linked biotin moiety. b. B-Gboxin toxicity on HTS cells at a higher IC50 (150 nM vs. 1,530 nM). n = 3; mean ± SD. c. B-Gboxin inhibits OCR in HTS cells. OCR was measured under basal conditions and following addition of DMSO (blue) or B-Gboxin (red line; 10 μM) at 24 min., oligomycin A (oligo; 54 min.), Fccp (72 min.), and a mixture of rotenone and antimycin A (rot/AA; 102 min.). n = 2; mean is shown. d. B-Gboxin mediates induction of ATF4 and suppression of p-S6 expression in HTS cells. Cells were treated with DMSO, Gboxin (1 μM), or B-Gboxin (10 μM) for 12 hours. n = 2. e. B-Gboxin associates with multiple components of OxPhos chain. B-Gboxin pulldown followed by mass-spectrometry analyses performed with purified mitochondria from HTS cells treated with Gboxin, B-Gboxin, or Gboxin followed by B-Gboxin. Number in parentheses shows the total known subunits for indicated OxPhos complexes. f-g. Representative western blot analyses validate interactions between B-Gboxin and OxPhos proteins. f. Western blot following biotin pulldown of B-Gboxin verifies complex V, Atp5a1, interaction that can be competed by Gboxin. HTS cells were treated with Gboxin, B-Gboxin, or Gboxin followed by B-Gboxin; n = 3; g. B-Gboxin/OxPhos protein interactions can be detected by pulldown within 10 minutes. HTS cells were treated with B-Gboxin for the indicated time periods; n = 2; h-k. (see Supplementary Results), Evidence of covalent interaction between B-Gboxin and OxPhos proteins. h. Input: Western blots for OxPhos proteins Atp5b or Sdha of HTS cells incubated with Gboxin or B-Gboxin. Pulldown: No signal with Gboxin. B-Gboxin pulldowns were not disrupted by pretreatment of sample with high salt (NaCl 300 mM), Urea (3 M) or SDS (0.2% and 0.5%). n = 2. i. Incubation with Gboxin after preincubation with B-Gboxin cannot displace B-Gboxin interactions with OxPhos proteins, however preincubation with Gboxin followed by B-Gboxin can displace these interactions. HTS cell pulldown assays were treated as indicated. P: preincubated. n = 2. j. Western blot analysis for OxPhos proteins and B-Gboxin binding proteins following immunoprecipitation (IP) assays for corresponding OxPhos proteins as indicated. IB: immunoblot. n = 2. k. Western blot images for B-Gboxin interaction with cell lysate proteins as a function of increasing pH. HTS cell lysates were incubated with B-Gboxin, and pH was adjusted using sodium hydroxide. n = 3.
Extended Data Figure 4. Gboxin interacts with OxPhos proteins in a mitochondrial membrane potential dependent manner, leading to complex V inhibition.
a. Depolarization of mitochondrial inner membrane potential dissipates Gboxin association with OxPhos proteins in HTS cells while increase in membrane potential enhances MEF and astrocyte interactions. HTS, MEF, or astrocyte cells pretreated with different doses of OxPhos inhibitors for 10 minutes and followed by incubating with B-Gboxin for 1 hour. Fccp and rotenone depolarize or decrease mitochondrial inner membrane potential respectively. Oligomycin A mediates increase in membrane potential. PD: pulldown. n = 2. b. RT-qPCR analyses for gene expression change in HTS cells treated with antimycin A, rotenone, oligomycin A, or Gboxin. Fold change in gene expression was compared to DMSO treated cells show enhanced up regulation of Survivin, aurora kinases and Plk1 in oligomycin A and Gboxin treated cells. n = 2. c. Cell viability assays for cells treated with increasing doses of Gboxin or oligomycin A in the presence or absence of CsA. HTS cells are unresponsive to CsA mPTP blockade. Mean ± SD; n = 3. d. MEF mPTP inhibition (CsA) elicits ATF4 cell stress response to Gboxin. Representative western blot for ATF4 expression in MEFs treated with Gboxin (1 μM) in the presence/absence of CsA for 6 hours. n = 2. e. Cell viability assays for MEFs transfected with control siRNA (Con si) or Cyclophilin D siRNA (CypD si) exposed to increasing doses of Gboxin in the presence/absence of CsA (1 μM). Inset shows western blot image for efficiency of CypD knockdown. Mean ± SD; n = 3. rot: rotenone; AA: antimycin A; oligo: oligomycin A.
Extended Data Figure 5. C-Gboxin, a functional Gboxin analog amenable for live cell UV crosslink conjugation and click chemistry.
a. scheme for C-Gboxin (C-Gb) detection in live cells following UV crosslinking and fluorophore click chemistry. b. C-Gboxin structure. c. Cell viability assays show C-Gboxin inhibits HTS cells (IC ~350nm) and not MEF cells (IC50>5um) treated with increasing doses of C-Gboxin. n = 3; mean ± SD. d. C-Gboxin spontaneously accumulates in HTS GBM cell mitochondria. n = 3.
Extended Data Figure 6. Gboxin exerts toxicity on primary mouse GBM cells and inhibits OCR in sampled human cancer cell lines.
a. Gboxin inhibition of three primary mouse GBM cell cultures (#2396, #1661, and #1663), established from NF1/Trp53/Pten mutant GBM, treated with increasing doses of oligomycin A (oligo) or Gboxin in the presence/absence of CsA (1 μM). n = 3, mean ± SD. b-h. OCR Seahorse measurements in sampled cell lines (Colo205, A375, SK-MEL113, Cal-62, Daoy, U937, NCI-H82) under basal conditions and following addition of DMSO or Gboxin (blue or red lines respectively; 18 min.), oligomycin A (oligo; 66 min.), Fccp (84 min.), and a mixture of rotenone and antimycin A (rot/AA; 102 min.). n = 2; mean is shown. i. Viability assay for primary mouse malignant peripheral nerve sheath tumor (MPNST) cells carrying Trp53 and NF1 mutations indicates Gboxin resistance and induced sensitivity by inhibition of mPTP. Thus, Gboxin sensitivity is not directly linked to NF1 and Trp53 driver mutations. n = 3; mean ± SD.
Extended Data Figure 7. S-Gboxin is pharmacokinetically stable and suitable for in vivo studies.
a. Gboxin S9 half-life. n = 1. b. Gboxin plasma half-life. n = 1. c. S-Gboxin structure. d. S-Gboxin S9 half-life. n = 1. e. S-Gboxin plasma half-life. n = 1. f. S-Gboxin plasma PK data. n = 3; mean ± SD. g. S-Gboxin tumor PK data. n = 3 to 6 at each time point; mean ± SD. Plasma (f) and tumor (g) PK data indicates S-Gboxin is suitable for in vivo studies. h. Representative western blots show S-Gboxin, like its original compound Gboxin, upregulates ATF4 and suppresses p-S6 expression in HTS GBM cells. Cells were treated with DMSO, Gboxin (1 μM), or S-Gboxin (1 μM) for 12 hours. n = 2.
Extended Data Figure 8. S-Gboxin inhibits mouse and human GBM growth in vivo.
a-c. 105 HTS cells subcutaneously injected into flanks of nude mice were treated IP daily with vehicle or S-Gboxin commencing 2 weeks after allograft. a. Tumor growth by volume (W x L x H) assessed every 2 days. Insets are representative images for vehicle or S-Gboxin treated tumors harvested after mice were sacrificed. Vehicle: n=8, S-Gboxin: n=11; Mean ± SD; two-way ANOVA. b. Representative H&E and immunohistochemical staining for Ki67, GFAP and Olig2 indicating reduced cellularity, proliferation, and expression of glioma markers after S-Gboxin treatment. Scale bar = 50 μm. n = 2. c. Quantification of tumor cellular density (top panel) and Ki67 positive cells (bottom panel) in vehicle or S-Gboxin treated mouse flank tumors. For each graph, 5 representative images from 2 different tumors were used. Hpf: high power field; Mean ± SD; paired t test, two-tailed. d. Molecular analysis shows S-Gboxin inhibition of p-S6 and transient induction of tumor cell apoptosis as manifested by upregulated cleaved-Cas3 and down regulated Survivin expression at day 3 and 5 after treatment. n = 2. e-h. 2×10⁵ primary PDX cells (ts1156) mixed with matrigel subcutaneously injected into flanks of nude mice were IP treated daily with vehicle or S-Gboxin commencing 3 days after xenograft implantation. e. Graph represents tumor growth measured by tumor volume (W x L x H) assessed every 2 days. Vehicle: n=7, S-Gboxin: n=8; mean ± SEM; two-way ANOVA. f. Quantification of tumor size on the day mice were sacrificed. Vehicle: n=7, S-Gboxin: n=8; unpaired t test, two-tailed. g. Representative H&E staining images for PDX tumors (ts1156) treated with vehicle or S-Gboxin show reduced cellularity after S-Gboxin treatment. Scale bar = 25 μm. n = 2. h. Images show reduced size of S-Gboxin treated PDX tumors (ts1156) harvested after mice were sacrificed. i-k. Intracranial transplantation of primary mouse GBM cells (#1663), followed by installation of subcutaneous minipumps with intracranial catheters after 2 weeks for local delivery of vehicle or S-Gboxin (2.16 μg/day). n=5 for each group. i. Representative images of tumor bearing brains following vehicle or S-Gboxin treatment. Note the marked hemorrhage of tumors (dotted redlines) from vehicle treated brains. j. Representative H&E and immunohistochemical staining of Ki67 and glioma markers (Gfap and Olig2) indicating reduced cellularity, proliferation, and glioma markers in S-Gboxin treated brains. k. Quantification of tumor cellular density (left) and Ki67 positive cells (right) in DMSO/S-Gboxin treated tumors. For each group, 5 representative images from 2 different tumors were used. Mean ± SD; paired t test, two-tailed. l. Intracranial S-Gboxin treatment reduces Nestin expression in tumors but not in adjacent normal SVZ. Representative immunofluorescence staining for Nestin and Dapi staining for intracranial tumors from i. n = 2. m. Immunohistochemical staining for Ki67 and glioma markers (GFAP and Olig2) for intracranial PDX tumors shown in Figure 7 (e and g) indicates reduced proliferation and expression of glioma markers in S-Gboxin treated brains. Upper panel, For Tumor 1, PDX-170620; and bottom panel, for Tumor 2, PDX-170404; Scale bar = 25 μm. n =2. n. Mice treated with S-Gboxin at 10 mg/kg/day for a 32-day period do not exhibit weight variation as compared with vehicle treated mice. Vehicle (n=20); S-Gboxin (n=20); two-way ANOVA.
Extended Data Figure 9. Primary explants from residual S-Gboxin treated tumors retain Gboxin/S-Gboxin sensitivity in culture.
a, b. Cell viability assays show primary tumor cultures from Vehicle (a) or S-Gboxin (b) treated tumors as in Figure 7a. Mean ± SD; n = 3. Residual S-Gboxin treated tumor cells remain sensitive to Gboxin/S-Gboxin and have blunted mPTP response.
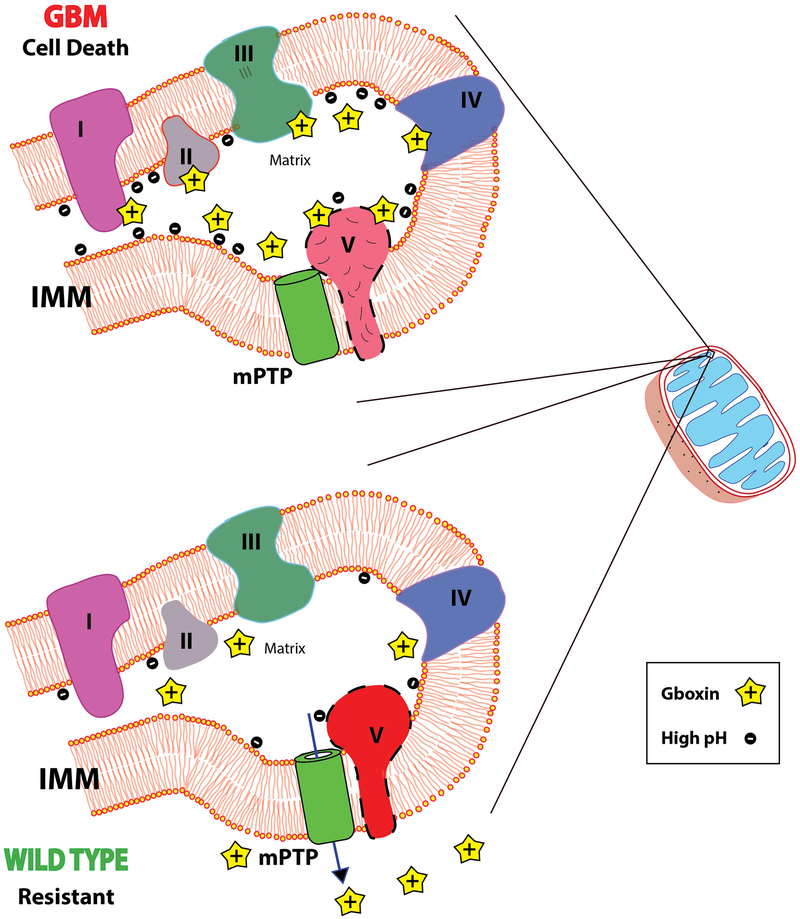
Extended Data Figure 10. Model for Gboxin mediated OxPhos inhibition in GBM cells.
Upper panel: High GBM cell mitochondrial matrix pH and inner mitochondrial membrane (IMM) potential leads to accumulation of positively charged Gboxin that is persistent due to blunted mPTP activity. At high concentration, Gboxin associates with multiple OxPhos proteins and inhibits CV activity causing cell death. Lower panel: In wildtype Gboxin resistant cells, mPTP function stabilizes mitochondrial membrane potential, maintains lower pH limiting mitochondrial Gboxin accumulation, thus limiting OxPhos inhibition and sustaining cell survival. mPTP (Green cylinder) is depicted adjacent to F0F1 ATPase CV. The precise nature and contribution of CV to mPTP remains controversial.
Acknowledgements.
The authors thank Yanjiao Li, Tracey Shipman, and Samhita Bapat for technical assistance. We thank David Sabatini (Whitehead Institute) for supplying U937, NCI-H82, Cal-62 and NCI-H524 cell lines, Neal Rosen (MSKCC) for supplying Mel30, Colo205, NCI-H2030, HCT116, SK-MEL113, and A375 cell lines, Albee Messing (University of Wisconsin-Madison) for supplying primary astrocytes, and Dr. Cameron Brennan (MSKCC) for supplying ts603 IDH1 mutant human GBM cells. SKL was a recipient of the Basic Research Fellowship from American Brain Tumor Association (in memory of Theodore Sapper). L.F.P. received funding from NCI (R35: CA210100 and R01: CA131313). L.F.P. and J.K.D. received funding from CPRIT (RP100782, RP120262, and RP150242). J.K.D. acknowledges support from the Robert A. Welch Foundation (I-1422).
Footnotes
Reporting Summary. Further information on research design is available in the Nature Research Reporting Summary linked to this paper.
Data availability. All important data generated or analyzed during this study are included in this article. Additional supplementary data are available from the corresponding author upon request.
References
- 1.Stupp R et al. Radiotherapy plus concomitant and adjuvant temozolomide for glioblastoma. N Engl J Med 352, 987–996, doi: 10.1056/NEJMoa043330 (2005). [DOI] [PubMed] [Google Scholar]
- 2.Wen PY & Kesari S Malignant gliomas in adults. N Engl J Med 359, 492–507, doi: 10.1056/NEJMra0708126 (2008). [DOI] [PubMed] [Google Scholar]
- 3.Chen J et al. A restricted cell population propagates glioblastoma growth after chemotherapy. Nature 488, 522–526, doi: 10.1038/nature11287 (2012). [DOI] [PMC free article] [PubMed] [Google Scholar]
- 4.Viale A & Draetta GF Metabolic Features of Cancer Treatment Resistance. Recent Results Cancer Res 207, 135–156, doi: 10.1007/978-3-319-42118-6_6 (2016). [DOI] [PubMed] [Google Scholar]
- 5.Viale A et al. Oncogene ablation-resistant pancreatic cancer cells depend on mitochondrial function. Nature 514, 628–632, doi: 10.1038/nature13611 (2014). [DOI] [PMC free article] [PubMed] [Google Scholar]
- 6.Parada LF, Dirks PB & Wechsler-Reya RJ Brain Tumor Stem Cells Remain in Play. J Clin Oncol 35, 2428–2431, doi: 10.1200/JCO.2017.73.9540 (2017). [DOI] [PMC free article] [PubMed] [Google Scholar]
- 7.Caro P et al. Metabolic Signatures Uncover Distinct Targets in Molecular Subsets of Diffuse Large B Cell Lymphoma. Cancer Cell 22, 547–560, doi: 10.1016/j.ccr.2012.08.014 (2012). [DOI] [PMC free article] [PubMed] [Google Scholar]
- 8.Cole A et al. Inhibition of the Mitochondrial Protease ClpP as a Therapeutic Strategy for Human Acute Myeloid Leukemia. Cancer Cell 27, 864–876, doi: 10.1016/j.ccell.2015.05.004 (2015). [DOI] [PMC free article] [PubMed] [Google Scholar]
- 9.Bosc C, Selak MA & Sarry JE Resistance Is Futile: Targeting Mitochondrial Energetics and Metabolism to Overcome Drug Resistance in Cancer Treatment. Cell Metabolism 26, 705–707, doi: 10.1016/j.cmet.2017.10.013 (2017). [DOI] [PubMed] [Google Scholar]
- 10.Zorov DB, Juhaszova M & Sollott SJ Mitochondrial reactive oxygen species (ROS) and ROS-induced ROS release. Physiol Rev 94, 909–950, doi: 10.1152/physrev.00026.2013 (2014). [DOI] [PMC free article] [PubMed] [Google Scholar]
- 11.Biasutto L, Azzolini M, Szabo I & Zoratti M The mitochondrial permeability transition pore in AD 2016: An update. Bba-Mol Cell Res 1863, 2515–2530, doi: 10.1016/j.bbamcr.2016.02.012 (2016). [DOI] [PubMed] [Google Scholar]
- 12.Libby G et al. New Users of Metformin Are at Low Risk of Incident Cancer A cohort study among people with type 2 diabetes. Diabetes Care 32, 1620–1625, doi: 10.2337/dc08-2175 (2009). [DOI] [PMC free article] [PubMed] [Google Scholar]
- 13.Naguib A et al. Mitochondrial Complex I Inhibitors Expose a Vulnerability for Selective Killing of Pten-Null Cells. Cell Rep 23, 58–67, doi: 10.1016/j.celrep.2018.03.032 (2018). [DOI] [PMC free article] [PubMed] [Google Scholar]
- 14.Molina JR et al. An inhibitor of oxidative phosphorylation exploits cancer vulnerability. Nat Med 24, 1036–1046, doi: 10.1038/s41591-018-0052-4 (2018). [DOI] [PubMed] [Google Scholar]
- 15.Wheaton WW et al. Metformin inhibits mitochondrial complex I of cancer cells to reduce tumorigenesis. Elife 3, e02242, doi: 10.7554/eLife.02242 (2014). [DOI] [PMC free article] [PubMed] [Google Scholar]
- 16.Liu X, Romero IL, Litchfield LM, Lengyel E & Locasale JW Metformin Targets Central Carbon Metabolism and Reveals Mitochondrial Requirements in Human Cancers. Cell Metab 24, 728–739, doi: 10.1016/j.cmet.2016.09.005 (2016). [DOI] [PMC free article] [PubMed] [Google Scholar]
- 17.Lord SR et al. Integrated Pharmacodynamic Analysis Identifies Two Metabolic Adaption Pathways to Metformin in Breast Cancer. Cell Metab 28, 679–688 e674, doi: 10.1016/j.cmet.2018.08.021 (2018). [DOI] [PMC free article] [PubMed] [Google Scholar]
- 18.Heerdt BG, Houston MA & Augenlicht LH The intrinsic mitochondrial membrane potential of colonic carcinoma cells is linked to the probability of tumor progression. Cancer Res 65, 9861–9867, doi: 10.1158/0008-5472.Can-05-2444 (2005). [DOI] [PubMed] [Google Scholar]
- 19.Heerdt BG, Houston MA & Augenlicht LH Growth properties of colonic tumor cells are a function of the intrinsic mitochondrial membrane potential. Cancer research 66, 1591–1596, doi: 10.1158/0008-5472.CAN-05-2717 (2006). [DOI] [PubMed] [Google Scholar]
- 20.Modica-Napolitano JS & Aprille JR Delocalized lipophilic cations selectively target the mitochondria of carcinoma cells. Adv Drug Deliv Rev 49, 63–70 (2001). [DOI] [PubMed] [Google Scholar]
- 21.Bernal SD, Lampidis TJ, Summerhayes IC & Chen LB Rhodamine-123 selectively reduces clonal growth of carcinoma cells in vitro. Science 218, 1117–1119 (1982). [DOI] [PubMed] [Google Scholar]
- 22.Jekimovs C et al. Chemotherapeutic compounds targeting the DNA double-strand break repair pathways: the good, the bad, and the promising. Front Oncol 4, 86, doi: 10.3389/fonc.2014.00086 (2014). [DOI] [PMC free article] [PubMed] [Google Scholar]
- 23.Senese S et al. Chemical dissection of the cell cycle: probes for cell biology and anti-cancer drug development. Cell Death Dis 5, e1462, doi: 10.1038/cddis.2014.420 (2014). [DOI] [PMC free article] [PubMed] [Google Scholar]
- 24.Kwon CH et al. Pten haploinsufficiency accelerates formation of high-grade astrocytomas. Cancer Res 68, 3286–3294, doi: 10.1158/0008-54/2.Can-07-6867 (2008). [DOI] [PMC free article] [PubMed] [Google Scholar]
- 25.Zhu Y et al. Early inactivation of p53 tumor suppressor gene cooperating with NF1 loss induces malignant astrocytoma. Cancer cell 8, 119–130, doi: 10.1016/j.ccr.2005.07.004 (2005). [DOI] [PMC free article] [PubMed] [Google Scholar]
- 26.Ye JB et al. The GCN2-ATF4 pathway is critical for tumour cell survival and proliferation in response to nutrient deprivation. Embo J 29, 2082–2096, doi: 10.1038/emboj.2010.81 (2010). [DOI] [PMC free article] [PubMed] [Google Scholar]
- 27.Milani M et al. The Role of ATF4 Stabilization and Autophagy in Resistance of Breast Cancer Cells Treated with Bortezomib. Cancer research 69, 4415–4423, doi: 10.1158/0008-5472.Can-08-2839 (2009). [DOI] [PubMed] [Google Scholar]
- 28.Quiros PM et al. Multi-omics analysis identifies ATF4 as a key regulator of the mitochondrial stress response in mammals. J Cell Biol 216, 2027–2045, doi: 10.1083/jcb.201702058 (2017). [DOI] [PMC free article] [PubMed] [Google Scholar]
- 29.Yu FX, Chai TF, He H, Hagen T & Luo Y Thioredoxin-interacting protein (Txnip) gene expression: sensing oxidative phosphorylation status and glycolytic rate. J Biol Chem 285, 25822–25830, doi: 10.1074/jbc.M110.108290 (2010). [DOI] [PMC free article] [PubMed] [Google Scholar]
- 30.Parikh H et al. TXNIP regulates peripheral glucose metabolism in humans. PLoS Med 4, e158, doi: 10.1371/journal.pmed.0040158 (2007). [DOI] [PMC free article] [PubMed] [Google Scholar]
- 31.Perry SW, Norman JP, Barbieri J, Brown EB & Gelbard HA Mitochondrial membrane potential probes and the proton gradient: a practical usage guide. Biotechniques 50, 98–115, doi: 10.2144/000113610 (2011). [DOI] [PMC free article] [PubMed] [Google Scholar]
- 32.Dasgupta B & Chhipa RR Evolving Lessons on the Complex Role of AMPK in Normal Physiology and Cancer. Trends Pharmacol Sci 37, 192–206, doi: 10.1016/j.tips.2015.11.007 (2016). [DOI] [PMC free article] [PubMed] [Google Scholar]
- 33.De Brabander JK et al. Substituted Benzimidazolium, Pyrido-Imidazolium, or Pyrazino-Imidazolium Compounds as Chemotherapeutic Agents. International Application No. PCT/US2016/065751, Pub. No. WO/2017/100525 (2017). [Google Scholar]
- 34.Bonora M & Pinton P The mitochondrial permeability transition pore and cancer: molecular mechanisms involved in cell death. Front Oncol 4, 302, doi: 10.3389/fonc.2014.00302 (2014). [DOI] [PMC free article] [PubMed] [Google Scholar]
- 35.Zhou W, Marinelli F, Nief C & Faraldo-Gomez JD Atomistic simulations indicate the c-subunit ring of the F1Fo ATP synthase is not the mitochondrial permeability transition pore. Elife 6, doi: 10.7554/eLife.23781 (2017). [DOI] [PMC free article] [PubMed] [Google Scholar]
- 36.Baines CP & Gutierrez-Aguilar M The still uncertain identity of the channel-forming unit(s) of the mitochondrial permeability transition pore. Cell Calcium 73, 121–130, doi: 10.1016/j.ceca.2018.05.003 (2018). [DOI] [PMC free article] [PubMed] [Google Scholar]
- 37.Basso E et al. Properties of the permeability transition pore in mitochondria devoid of cyclophilin D. Journal of Biological Chemistry 280, 18558–18561, doi: 10.1074/jbc.C500089200 (2005). [DOI] [PubMed] [Google Scholar]
- 38.Dubinsky L, Krom BP & Meijler MM Diazirine based photoaffinity labeling. Bioorg Med Chem 20, 554–570, doi: 10.1016/j.bmc.2011.06.066 (2012). [DOI] [PubMed] [Google Scholar]
- 39.Bonora M et al. Molecular mechanisms of cell death: central implication of ATP synthase in mitochondrial permeability transition. Oncogene 34, 1608, doi: 10.1038/onc.2014.462 (2015). [DOI] [PubMed] [Google Scholar]
- 40.Brenner C & Grimm S The permeability transition pore complex in cancer cell death. Oncogene 25, 4744–4756, doi: 10.1038/sj.onc.1209609 (2006). [DOI] [PubMed] [Google Scholar]
- 41.Galluzzi L et al. Molecular mechanisms of cisplatin resistance. Oncogene 31, 1869–1883, doi: 10.1038/onc.2011.384 (2012). [DOI] [PubMed] [Google Scholar]
- 42.Mo W et al. CXCR4/CXCL12 mediate autocrine cell- cycle progression in NF1-associated malignant peripheral nerve sheath tumors. Cell 152, 1077–1090, doi: 10.1016/j.cell.2013.01.053 (2013). [DOI] [PMC free article] [PubMed] [Google Scholar]
- 43.Weinberg SE & Chandel NS Targeting mitochondria metabolism for cancer therapy. Nat Chem Biol 11, 9–15, doi: 10.1038/nchembio.1712 (2015). [DOI] [PMC free article] [PubMed] [Google Scholar]
- 44.Vander Heiden MG & DeBerardinis RJ Understanding the Intersections between Metabolism and Cancer Biology. Cell 168, doi: 10.1016/j.cell.2016.12.039 (2017). [DOI] [PMC free article] [PubMed] [Google Scholar]
- 45.Li F et al. Myc stimulates nuclearly encoded mitochondrial genes and mitochondrial biogenesis. Mol Cell Biol 25, 6225–6234, doi: 10.1128/MCB.25.14.6225-6234.2005 (2005). [DOI] [PMC free article] [PubMed] [Google Scholar]
- 46.Weinberg F et al. Mitochondrial metabolism and ROS generation are essential for Kras-mediated tumorigenicity. Proc Natl Acad Sci U S A 107, 8788–8793, doi: 10.1073/pnas.1003428107 (2010). [DOI] [PMC free article] [PubMed] [Google Scholar]
- 47.Evans JM, Donnelly LA, Emslie-Smith AM, Alessi DR & Morris AD Metformin and reduced risk of cancer in diabetic patients. BMJ 330, 1304–1305, doi: 10.1136/bmj.38415.708634.F7 (2005). [DOI] [PMC free article] [PubMed] [Google Scholar]
- 48.Dilman VM & Anisimov VN Effect of treatment with phenformin, diphenylhydantoin or L-dopa on life span and tumour incidence in C3H/Sn mice. Gerontology 26, 241–246, doi: 10.1159/000212423 (1980). [DOI] [PubMed] [Google Scholar]
- 49.Lissanu Deribe Y et al. Mutations in the SWI/SNF complex induce a targetable dependence on oxidative phosphorylation in lung cancer. Nat Med 24, 1047–1057, doi: 10.1038/s41591-018-0019-5 (2018). [DOI] [PMC free article] [PubMed] [Google Scholar]
- 50.Forrest MD Why cancer cells have a more hyperpolarised mitochondrial membrane potential and emergent prospects for therapy. https://www.biorxiv.org/content/early/2015/08/21/025197 (2015).
Associated Data
This section collects any data citations, data availability statements, or supplementary materials included in this article.


