Abstract
Dysregulation of lipid homeostasis is a precipitating event in the pathogenesis and progression of hepatosteatosis and metabolic syndrome. These conditions are highly prevalent in developed societies and currently have limited options for diagnostic and therapeutic intervention. Here, using a proteomic and lipidomic-wide systems genetic approach, we interrogated lipid regulatory networks in 107 genetically distinct mouse strains to reveal key insights into the control and network structure of mammalian lipid metabolism. These include the identification of plasma lipid signatures that predict pathological lipid abundance in the liver of mice and humans, defining subcellular localization and functionality of lipid-related proteins, and revealing functional protein and genetic variants that are predicted to modulate lipid abundance. Trans-omic analyses using these datasets facilitated the identification and validation of PSMD9 as a previously unknown lipid regulatory protein. Collectively, our study serves as a rich resource for probing mammalian lipid metabolism and provides opportunities for the discovery of therapeutic agents and biomarkers in the setting of hepatic lipotoxicity.
There is an increasingly urgent need to understand the causal factors that contribute to excess lipid accumulation in the liver known as hepatosteatosis, and an equally important need to discover biomarkers and interventions for its early diagnosis and treatment. A major proportion of current and predicted global health burden stems from conditions in which hepatosteatosis is an underlying pathology1. Defining the mechanisms that causally influence hepatosteatosis has historically proven challenging, largely owing to an ill-defined interaction between genetic and environmental factors2. This, together with the insufficient ability for standard genome-wide association studies to capture the effect of environment on complex traits, probably explains why only a small fraction of the estimated 30% heritability for hepatosteatosis has been assigned to specific gene variants3.
Genetic reference panels (GRPs) have become a more tractable way of studying the influence of genetics and environment on complex traits, because unlike studies in humans, GRPs allow for accurate control of environment as well as access to critical metabolic tissues. Importantly, integrating intermediate phenotypes such as transcriptomics, proteomics, metabolomics and lipidomics from such tissues facilitates the discovery of previously unknown linkages between several layers of molecular information. Some previous studies have integrated GRPs and intermediate phenotype data in Drosophila and mice to reveal genetic variants that influence complex traits4–16, highlighting the potential of these approaches to generate important biological insights.
Here we have engaged a GRP of 107 inbred mouse strains and performed lipidomics and proteomics in more than 300 individual mice. Integration of these data with genomics has generated a powerful resource for the study of mammalian lipid metabolism.
Multi-layered proteomic and lipidomic diversity
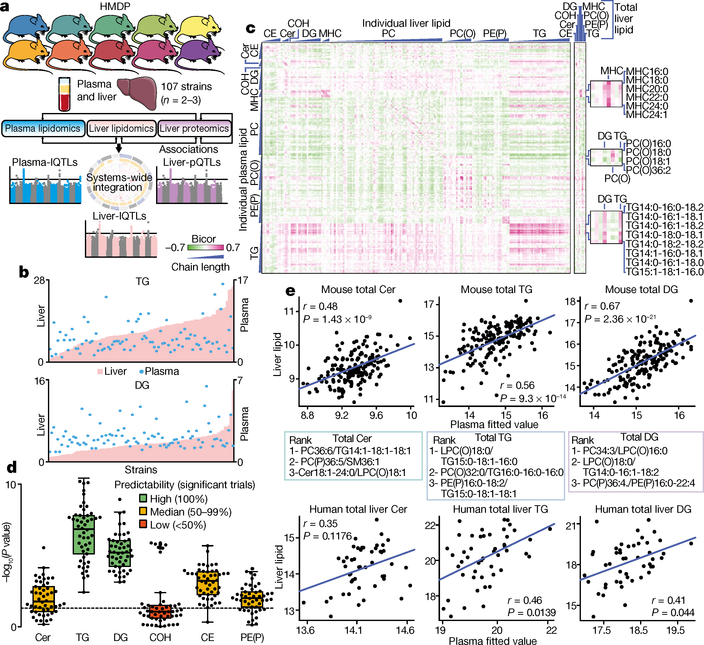
An overview of the study is presented in Fig. 1a. Male mice at approximately 60 days of age were fasted overnight before tissue collection. Proteomic analysis17 of cryo-milled livers detected 7,775 proteins, with 4,311 proteins quantified in more than 50 strains (Supplementary Table 1). Targeted lipidomics on the same cryo-milled livers and corresponding plasma samples quantified 311 lipid species across 23 classes18 (Supplementary Tables 2 and 3).
Fig. 1 |. Lipidomic analysis of HMDP provides unique insights into lipid regulation and prediction.
a, Study overview depicting integration of systems genetic and correlation analysis in replicate mice from the HMDP. b, Fold change in plasma (blue dots) and liver (pink bars) triacylglycerol (TG) and diacylglycerol (DG) abundance across all strains of the HMDP. Data shown as fold change from the lowest strain = 1. Left, liver scale; right, plasma scale. c, Heat map of biweight midcorrelation of 190 lipid species between plasma (rows) and liver (columns). CE, cholesterol ester; Cer, ceramide; COH, free cholesterol; MHC, monohexosylceramide; PC, phosphatidylcholine; PC(O), alkylphosphatidylcholine; PE(P), alkenylphosphatidylethanolamine. Bicor, biweight midcorrelation; positive values are in purple; negative values are in green. Plots on the right depict correlations between individual plasma lipids and total abundance of liver lipids. Zoomed boxes on the right highlight plasma lipids correlating with total MHC or total diacylglycerol or triacylglycerol. d, Linear model significance of procedure to predict hepatic abundance of indicated lipids (each dot represents an individual trial). Tests were classified into predictability based on the number of trials (n = 50) that passed significance (P < 0.05, dotted line). e, Pearson correlation of the linear model between the three indicated plasma lipid ratios and total liver lipid classes in mouse (HMDP) (top panels, n > 268 mice) and a human cohort of obese individuals (bottom panels; n = 58)25.
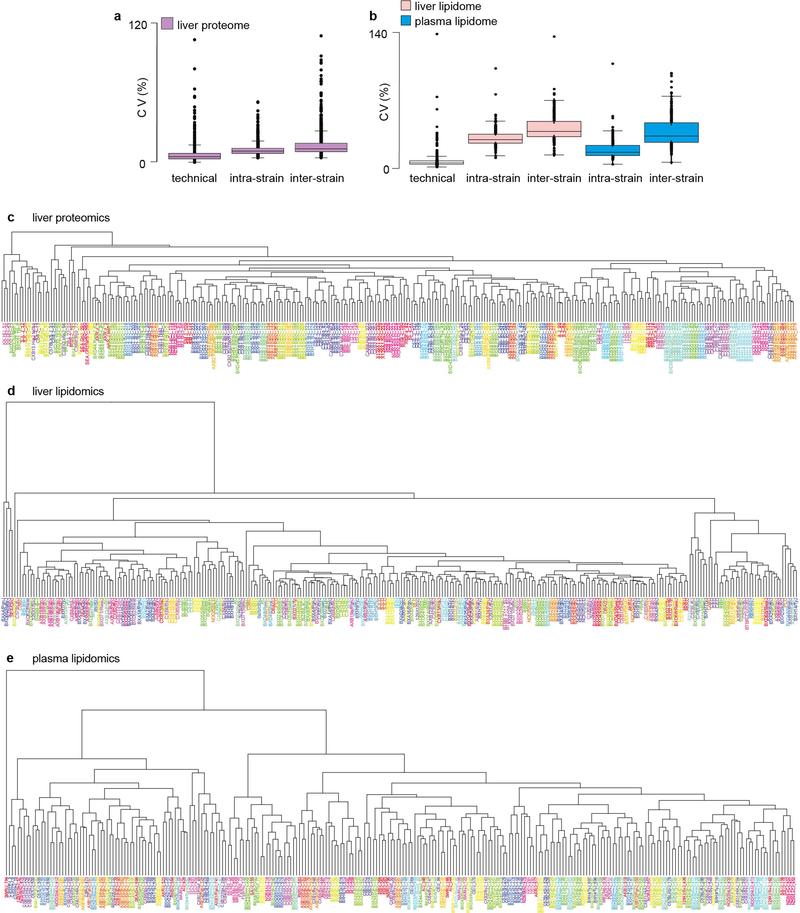
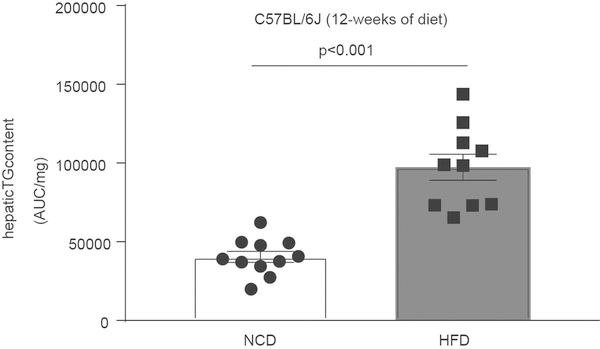
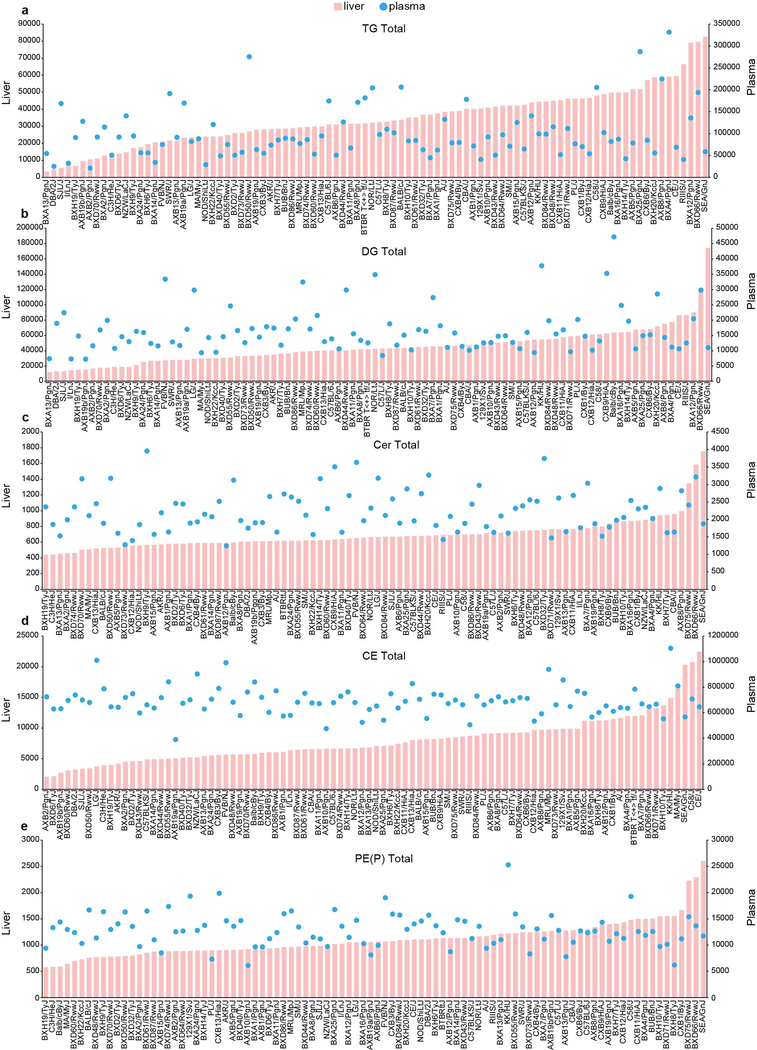
Technical coefficients of variation for the proteomic and lipidomic analyses were both less than 10%, and inter-strain variation was higher than intra-strain variation (Extended Data Fig. 1a, b). Analysis of replicate mice from hybrid mouse diversity panel (HMDP) strains enabled unsupervised hierarchical clustering and analysis of variation. Proteomics data clustered 278 out of 307 (90%) samples into the respective strains, and the liver and plasma lipidomics clustered 125 out of 292 (43%) and 151 out of 293 (51%), respectively (Extended Data Fig. 1c–e). Marked inter-strain lipid variation was observed in both the liver and plasma, particularly with triacylglycerols, which varied by 27-fold and 16-fold, respectively (Fig. 1b, top). This is notable considering all mice were matched for gender, age and environmental conditions. For comparison, the triacylglycerol content at the upper end of this spectrum was similar to that observed in C57BL/6J mice fed a high-fat diet for 12 weeks (Extended Data Fig. 2). Substantial variation was also observed in diacylglycerols (15-fold and 6-fold in the liver and plasma, respectively) (Fig. 1b, bottom), ceramides (4-fold and 3-fold), cholesterol esters (11-fold and 3-fold) and plasmalogens such as alkenylphosphatidylethanolamine (PE(P)) (5-fold and 4-fold) (Extended Data Fig. 3a–e).
Correlation analysis revealed that most lipid classes as a whole were not significantly correlated between liver and plasma (Supplementary Table 4). However, closer investigation of individual species revealed several lipids that were significantly correlated between liver and plasma, including alkylphosphatidylcholines, monohexosylceramides (MHC; also known as Hex1Cer) and PE(P)s (Fig. 1c). Most notably, C14/15-containing triacylglycerols were highly positively correlated with each other in the liver and plasma, as well as with numerous other acylglycerols. Because the accumulation of pathological lipids in the liver has been suggested to underpin hepatic lipotoxicity19,20, we focused on correlations between plasma lipids and some of the proposed hepatic pathological lipids including cholesterol esters, ceramides, free cholesterol, diacylglycerol, MHC, alkylphosphatidylcholine, PE(P) and triacylglycerol (Fig. 1c, right). Plasma MHC lipid species significantly correlated with total liver MHC, whereas plasma C14/15-containing triacylglycerols species positively correlated with the abundance of total hepatic acylglycerols. Conversely, plasma alkylphosphatidylcholine negatively correlated with the abundance of total liver diacyl- and triacylglycerol, which highlights several intricate patterns of inter-compartment lipid regulation.
Prediction of hepatic pathological lipid abundance
Being able to predict the accumulation of pathological lipids in the liver is currently an unmet clinical need. We postulated that the patterns of correlation observed between plasma and liver lipids might be exploited to develop potential blood-based biomarkers for hepatic lipotoxicity. We therefore established machine-learning models in an attempt to predict hepatic pathological lipid abundance. We used a correlation model of pairwise ratios that were prioritized using correlation coefficients, similar to those previously published21–23, to predict the hepatic content of diacylglycerol, triacylglycerol, ceramides, PE(P), cholesterol esters and free cholesterol. Predictions were generated using clustering-based representative feature selection followed by Lasso regression analysis24. High predictability (100% of tests were positive) was obtained for the abundance of hepatic triacylglycerol and diacylglycerol, and median (50–99%) predictability for ceramides, cholesterol esters and PE(P) (Fig. 1d). Testing of these plasma signatures across the entire HMDP dataset revealed highly significant predictability for the abundance of total hepatic ceramides, triacylglycerol and diacylglycerol (Fig. 1e, top). To investigate the translational relevance of these findings, we tested these plasma lipid ratios in a small human cohort of obese individuals with varying degrees of hepatosteatosis (n = 58; mean body mass index > 35)25. The identified ratios demonstrated a significant ability to predict total hepatic triacylglycerol and diacylglycerol in these individuals, with a trend to predict hepatic ceramide abundance (Fig. 1e, bottom). Thus, we have identified lipid signatures in our mouse HMDP datasets, with potential prognostic and diagnostic biomarker applications for hepatic lipotoxicity in humans.
Protein correlation analysis for biological insight
Proteome-wide correlation analysis has been used previously to investigate the role of genetic variants on protein complex abundance11 and define new protein-protein interactions26. We therefore undertook a similar approach to identify unique cellular and protein networks associated with lipid metabolism.
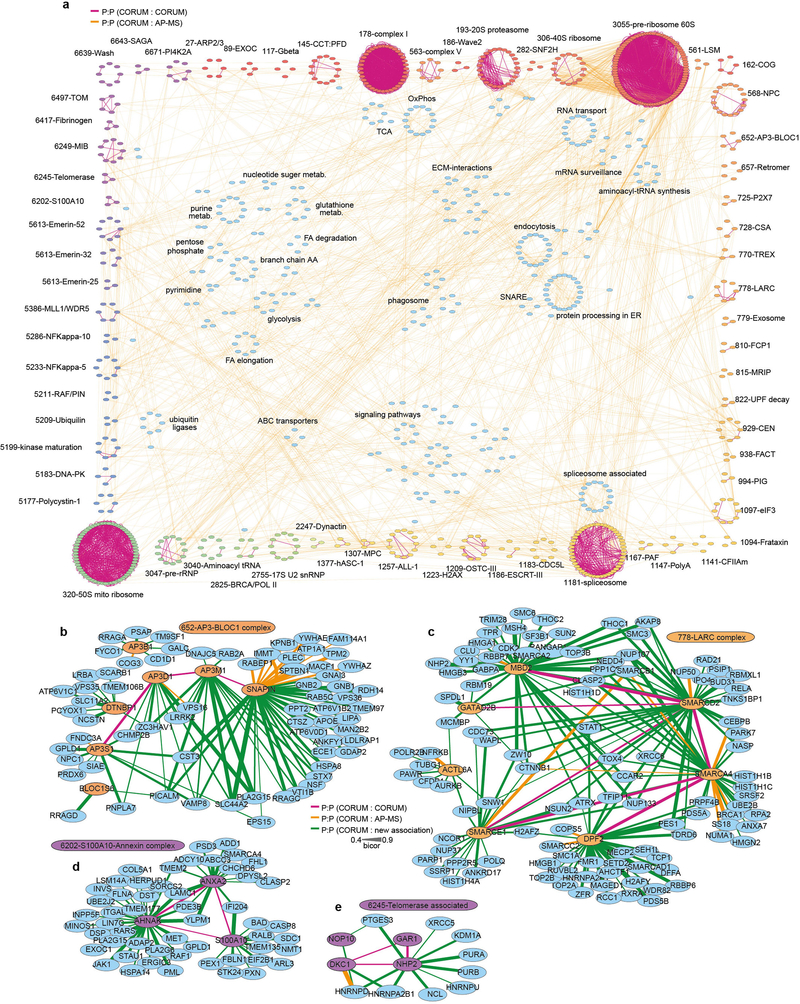
To identify co-regulated protein networks in the liver, we performed correlation analysis of 4,311 proteins quantified in more than 50 strains of HMDP mice (Supplementary Table 5), and integrated these data with previously published datasets (CORUM, HINT and BioGRID27–31) to generate a high-confidence mouse hepatic protein interactome map (Extended Data Fig. 4a). This approach identified many well-defined protein complexes including those from mitochondria, proteasome, ribosome and spliceosome (Extended Data Fig. 4a), as well as hundreds of unique proteins of interest with previously undefined interactions (Extended Data Fig. 4b–e).
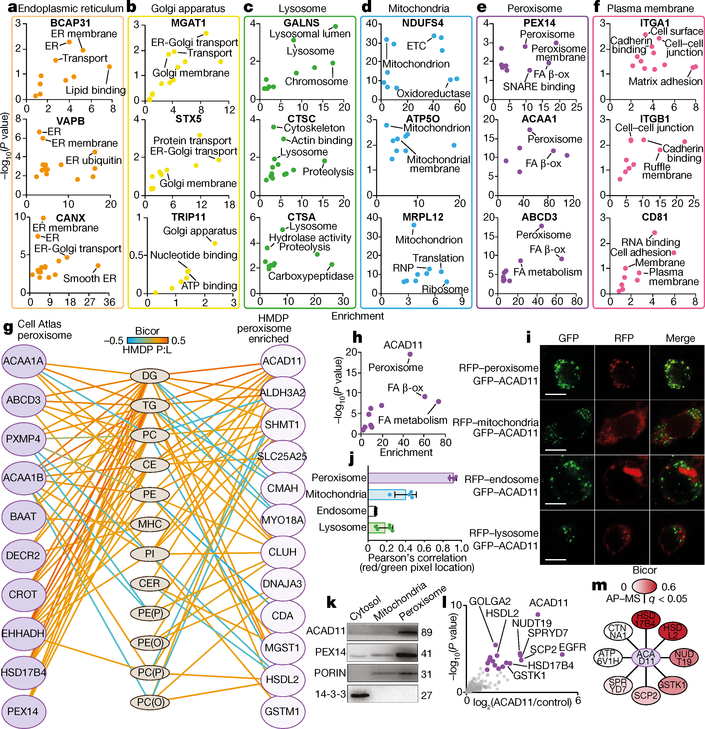
We engaged this network to determine subcellular localization and function of unknown proteins that correlated with hepatic and plasma lipid abundance. Localization was inferred using organelle-specific proteins designated from the Cell Atlas32 as ‘baits’, and performing pathway enrichment analysis on proteins that correlated with these baits. This analysis demonstrated marked fidelity in defining subcellular organelles including the endoplasmic reticulum, Golgi apparatus, lysosome, mitochondria, peroxisome and plasma membrane (Fig. 2a–f). We focused on unique proteins identified within the peroxisome compartment, owing to its known role in lipid metabolism33,34 and the many correlations observed between peroxisomal proteins and lipid abundance (Fig. 2g). For example, ACAD11 was correlated with several peroxisomal proteins and numerous lipid classes, suggesting a potential role in peroxisomal lipid metabolism (Fig. 2h). We confirmed a predominant co-localization of ACAD11 with peroxisomes via confocal microscopy (Fig. 2i, j), western blotting (Fig. 2k) and affinity purification–mass spectrometry (AP–MS) analysis. AP–MS analysis identified 17 ACAD11-interacting proteins, 9 of which also correlated with ACAD11 across the HMDP reference panel (Fig. 2l, m and Supplementary Table 6). The two proteins most significantly associated with ACAD11 were bona fide peroxisomal proteins, HSD17B4 and HSDL2. All three proteins correlated with several hepatic lipids, suggesting a previously unexplored role for these proteins in hepatic peroxisomal acylglycerol metabolism. Hence, these analyses demonstrate the ability of our co-regulated protein network to interrogate protein function and probe the localization and interaction of unique proteins that correlate with lipid abundance.
Fig. 2 |. Subcellular co-regulated networks associated with lipid metabolism.
a–f, Enrichment analysis using Fisher’s exact test with Benjamini–Hochberg correction of the co-regulated protein networks associated with organelle-specific proteins validated in the Cell Atlas32. g, Biweight midcorrelation analysis of peroxisome protein abundance with liver lipid abundance (red denotes positive; blue denotes negative) (n = 306 mice). Left, peroxisomal proteins annotated from the Cell Atlas; right, proteins highly correlated with the peroxisome in the HMDP network with no previous localization in the Cell Atlas. Edges denote only significant protein:lipid (P:L) correlations (n > 50 strains, q < 0.05). h, Enrichment analysis using Fisher’s exact test with Benjamini–Hochberg correction of the ACAD11 co-regulated proteome (n > 50 strains, q < 0.05) i, Representative confocal microscopy images (from ten images per well, in up to five biologically independent replicates) of green fluorescent protein (GFP)-tagged ACAD11 and red fluorescent protein (RFP)-tagged peroxisomal, mitochondrial, endosomal or lysosomal markers in HEK293 cells. Scale bars, 10 μm. j, Quantification (average of ten images per replicate) of confocal images plotting Pearson’s correlation r value of co-localized green and red pixels (ACAD11–GFP with RFP organelles). Data are mean ± s.e.m., n > 3. k, Western blots on cellular fractions of HEK293 cells for ACAD11, PEX14, PORIN and 14–3-3, representative of three independent experiments. l, Scatter plot showing enrichment of proteins identified by AP–MS of Flag-tagged ACAD11 in HEK293 cells. Purple dots denote significantly enriched (q < 0.05, n = 5 replicate wells). m, ACAD11 interaction network integrating proteins significantly enriched after AP–MS, and those that correlated (bicor) with ACAD11 in the HMDP network.
Genetic regulation of protein and lipid abundance
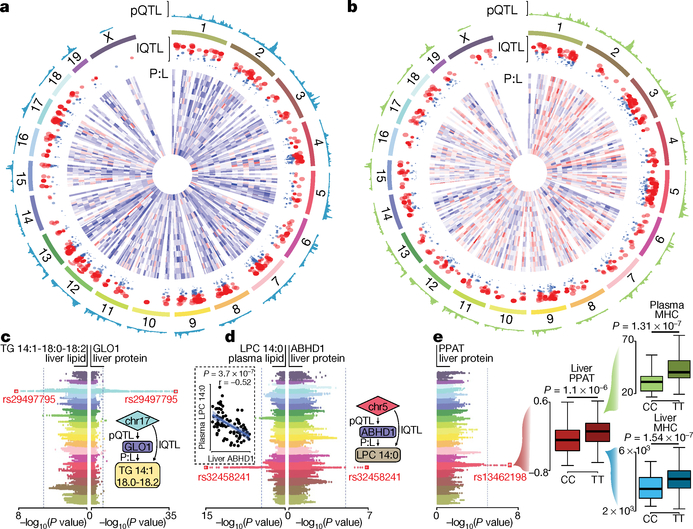
To identify genetic variants that influence proteome and lipidome abundance across the HMDP, we performed quantitative trait loci (QTL) mapping. These analyses identified significant cis-regulation of the proteome (cis-protein QTLs; pQTLs) with 97,819 unique single nucleotide polymorphisms (SNPs) corresponding to 976 unique proteins at a q-value of <0.1 (±10 Mb of the gene; local adjusted P < 1 × 10⁻⁴)11 (Supplementary Table 7). QTL mapping of lipidomic datasets identified lipid QTLs (lQTLs) for 227 liver and 252 plasma lipids (73% and 81% of all lipids quantified, respectively) corresponding to 3,981 and 6,765 unique SNPs, respectively (Supplementary Tables 8 and 9). Integrating the pQTL and lQTL datasets identified 1,984 common SNPs that were associated with the abundance of both a protein and a lipid in the liver. Finally, we overlaid these loci with protein:lipid correlation data for liver (Fig. 3a) and plasma (Fig. 3b). These combined datasets identified 281 SNPs in 17 loci that contained a pQTL, lQTL and a direct correlation between the mapped protein and lipid in the liver (Supplementary Table 10). The GLO1 locus had a highly significant cis-pQTL (Fig. 3c) and lQTLs for hepatic triacylglycerol species, whereas GLO1 protein positively correlated with nine individual triacylglycerol species in the liver (Supplementary Table 11). GLO1 was recently identified in genome-wide association studies to be strongly associated with coronary artery disease and non-alcoholic fatty liver disease35,36 and therefore our data implicate GLO1 as a causal regulator of acylglycerol metabolism with potential links to cardiometabolic disease.
Fig. 3 |. Systems genetic analysis of proteomic and lipidomic diversity in HMDP mice.
a, b, Circos plots summarizing global genomic regulation of hepatic protein and lipid abundance in liver (a) and plasma (b) of HMDP strains. Tracks from outside-in: (1) pQTL mapping in which height represents increasing −log10(P value) (n = 105 strains); (2) chromosomal coordinates according to mm10 genome; and (3) lQTLs in which all circles are significant (P < 1 × 10⁻⁴), with circle size corresponding to increasing −log10(P value) (n = 105 strains). Red circles meet Bonferroni genome-wide association study significance (P < 4.2 × 10⁻⁶). (4) Heat map showing protein:lipid (P:L) biweight midcorrelation (n = 306 mice) between each pQTL related protein and the indicated lQTL lipid species c, Back-to-back Manhattan plots highlighting a locus significantly (P < 4.2 × 10⁻⁶) associated with liver TG 14:1–18:0–18:2 abundance and liver GLO1 protein (n = 105 strains). Inset summarizes proposed genetic interaction. d, Back-to-back Manhattan plots highlighting a locus significantly associated with both plasma lysophosphatidylcholine (LPC) 14:0 abundance and liver ABHD1 protein levels. Inset (dashed line) shows Pearson correlation between liver ABHD1 and plasma LPC 14:0 (n = 306 mice), inset on right summarizes proposed genetic interaction. e, Manhattan plot highlighting a locus associated with abundance of liver PPAT protein (n = 105 strains), and box-and-whisker plots (black bars denote median; boxes denote upper and lower quartiles; whiskers denote extremes) demonstrating that allelic variation at the lead SNP (rs13462198) within the PPAT cis-pQTL is also associated with the abundance of monohexosylceramides in both the liver and plasma (n = 105 strains).
We also identified 3,342 common SNPs in 27 loci that co-mapped to both a hepatic protein and a plasma lipid, in which the protein and plasma lipid also correlated (Supplementary Table 12). For example, SNPs mapping to ABHD1 protein, co-mapped with plasma C14-containing lysophosphatidylcholines, and significant negative correlations were observed between liver ABHD1 and plasma lysophosphatidylcholines, which suggest that ABHD1 is involved in the regulation of LPCs in the plasma (Fig. 3d). Separately, a cis-pQTL for PPAT on chromosome 5 was associated with MHC abundance (Fig. 3e). Specifically, homozygous allelic variation (CC>TT) at rs13462198 in the PPAT locus associated with the abundance of liver PPAT protein and with the abundance of both liver and plasma MHC. These findings implicate PPAT as a key regulator of whole-body MHC abundance. Collectively, our systems genetics approach has identified many unique proteins that are likely to be causal in the regulation of hepatic and plasma lipid abundance.
Protein pathways that regulate lipid abundance
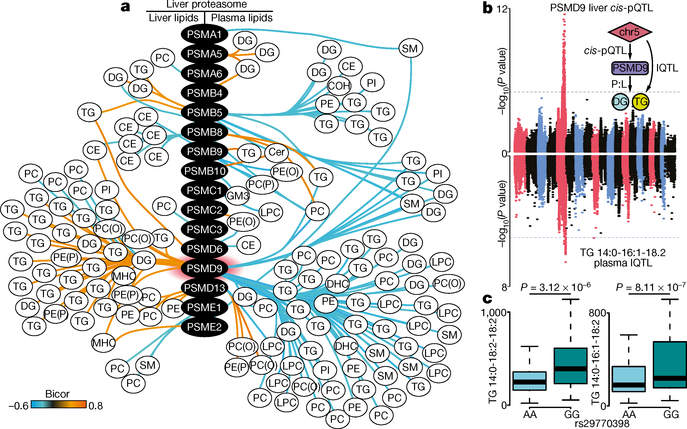
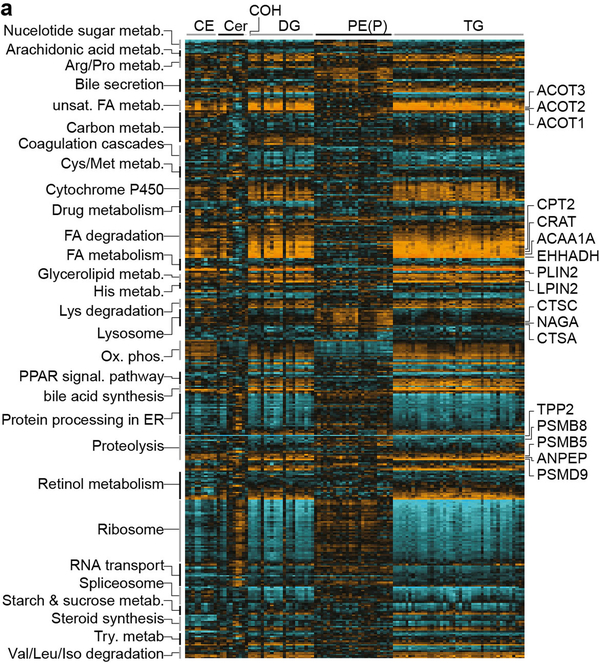
We next investigated global correlations between the lipidomics and proteomic datasets to identify a total of 14,172 and 22,692 individual protein:lipid correlations in the liver and plasma, respectively (q < 0.05 false discovery rate (FDR)) (Supplementary Tables 11 and 13). KEGG enrichment analysis provided an overview of the protein pathways associated with a subset of hepatic lipids (Extended Data Fig. 5). Proteins highly correlated with cholesterol esters, diacylglycerol and triacylglycerol included PLIN2, and fatty acid metabolism enzymes such as EHHADH, ACC1, ACC2, CRAT, CPT2, ACOT1–4 and LPIN2. Notably, proteolysis-associated proteins were strongly correlated with hepatic lipid abundance. Specific mapping of correlations between proteasomal-associated proteins and lipids in the liver and plasma demonstrated a prominent association between PSMD9 and lipid abundance (Fig. 4a). PSMD9 was positively correlated with 39 hepatic lipids and negatively correlated with 65 plasma lipid species. Furthermore, QTL mapping identified significant cis-pQTLs at the PSMD9 locus, which also co-mapped to several lQTLs for plasma triacylglycerols (TG 14:0–16:1–18:2, shown in Fig. 4b). These data suggest that genetic variation at the PSMD9 locus drives changes in PSMD9 protein abundance and triacylglycerol levels in the plasma. This is further supported by evidence that allelic variation (AA>GG) at the peak SNP within the PSMD9 pQTL (rs29770398) associates with a significant twofold differential in plasma triacylglycerol species (triacylglycerol 14:0–18:2–18:2 and 14:0–16:1–18:2) (Fig. 4c).
Fig. 4 |. Proteasomal proteins including PSMD9 are correlated with lipid abundance.
a, Biweight midcorrelation analysis of proteasome-associated proteins against significantly correlated (FDR-corrected, q < 0.05) liver (left) and plasma (right) lipid species (n > 50 strains) (orange denotes positive bicor; aqua denotes negative bicor). PE, phosphatidylethanolamine; SM, sphingomyelin. b, Back-to-back Manhattan plots demonstrating a significant (P < 1 × 10⁻⁴) cis-pQTL for PSMD9 protein abundance on chromosome 5 (top), co-mapping to a significant lQTL (P < 4.2 × 10⁻⁶) for plasma TG 14:0–16:1–18:2 abundance (bottom) (n = 105 strains). Inset summarizes that SNPs on chromosome 5 (chr5) drive variation in PSMD9 protein abundance and plasma triacyl/diacylglycerol abundance, corroborated by a correlation (P:L, biweight midcorrelation, q < 0.05) between hepatic PSMD9 protein and plasma diacyl/triacylglycerol abundance. c, Box-and-whisker plots (described in Fig. 3e) demonstrating that homozygous allelic variation (AA versus GG) at the SNP rs29770398 within the PSMD9 locus significantly associates (P < 3 × 10⁻⁶) with abundance of plasma triacylglycerols TG 14:0–18:2–18:2 and TG 14:0–16:1–18:2 (n = 105 strains).
PSMD9 regulates lipid metabolism
PSMD9 has previously been shown to associate with the proteasome37; however, no known function has been identified. Human genomewide association studies have demonstrated that PSMD9 is associated with risk of adiposity, type 2 diabetes and cardiovascular disease38–40. Furthermore, data from the UK Biobank S-PrediXcan (https://imlab.shinyapps.io/gene2pheno_ukb_neale/) demonstrate that hepatic PSMD9 correlates with numerous indices of adiposity, across approximately 500,000 individuals (Extended Data Table 1). These findings collectively provide strong evidence that PSMD9 may have an important role in lipid metabolism in rodents and humans.
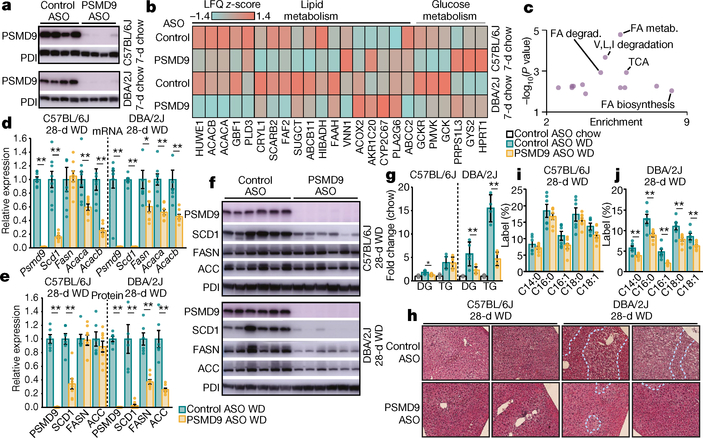
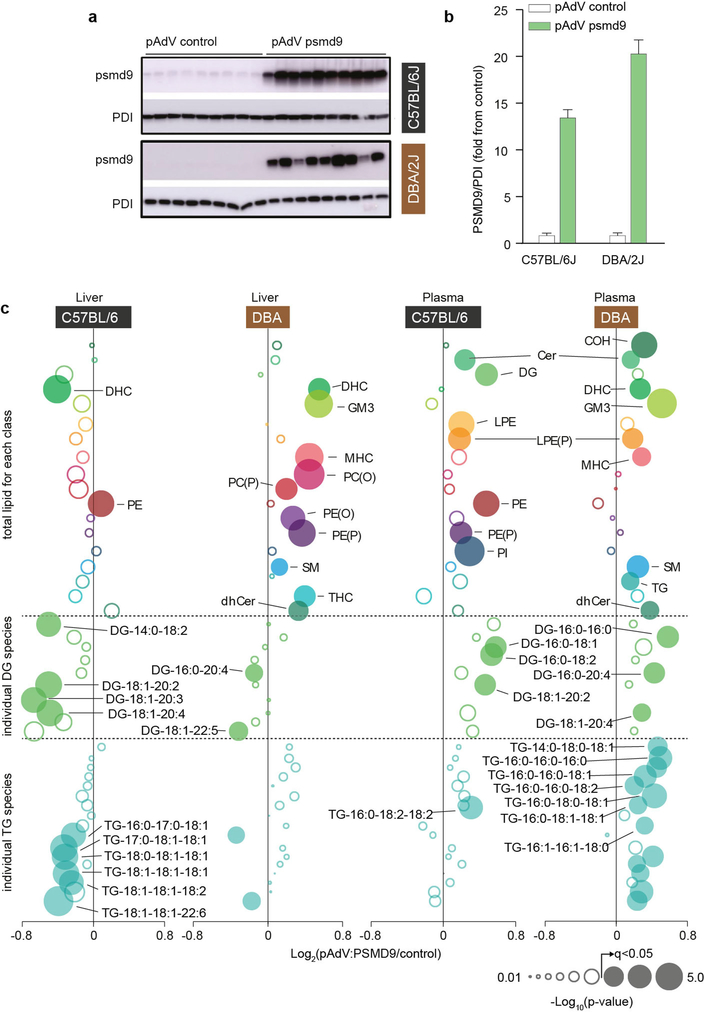
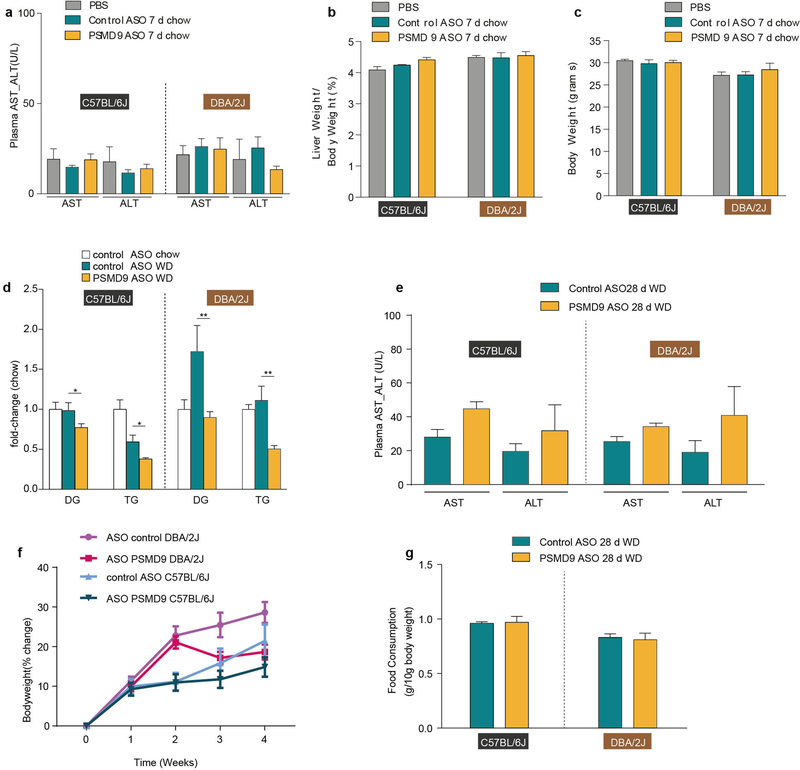
To investigate a direct role for PSMD9 in regulating lipid metabolism, we performed gain-of-function and loss-of-function studies in mice. Hepatic PSMD9 overexpression in mice using adenovirus resulted in significant alterations in lipid abundance including distinct increases in plasma acylglycerols (Extended Data Fig. 6a–c), which suggests that upregulating PSMD9 promotes lipid accrual. To investigate loss-of-function effects of PSMD9, we performed silencing studies using antisense oligonucleotides (ASOs) in two strains of mice (C57BL/6J and DBA/2J). PSMD9 protein abundance was significantly reduced in the livers of mice after one week of ASO administration (Fig. 5a), with no indication of liver toxicity (Extended Data Fig. 7a–c). Proteomic analysis revealed that 52 proteins were differentially regulated in the liver across both strains (Fig. 5b and Supplementary Table 14), many of which are known glucose and lipid regulatory proteins (Fig. 5c). However, only modest changes in hepatic lipid abundance were observed (Supplementary Table 15), probably owing to the acute silencing period and absence of a lipotoxic intervention.
Fig. 5 |. Modulating PSMD9 regulates hepatic and plasma lipid abundance in mice.
a, Western blots of PSMD9 and protein disulfide isomerase (PDI; loading control) in the livers of C57BL/6J and DBA/2J mice treated for 7 days (7-d) with control or PSMD9 ASOs (25 mg kg−1, n = 4 independent mice). b, Heat map of significantly (P < 0.05, analysis of variance (ANOVA)) regulated proteins from lipid and glucose metabolism pathways in the livers of C57BL/6J and DBA/2J mice treated with control or PSMD9 ASOs for 7 days (n = 4 mice per group). Scale represents average relative abundance (label-free quantification (LFQ) score). Orange denotes high abundance; aqua denotes low abundance. c, Pathway enrichment analysis of the 52 proteins significantly regulated by PSMD9 ASOs in both strains using Fisher’s exact test with Benjamini–Hochberg correction. FA, fatty acid. d, Relative mRNA expression in livers of both mouse strains fed a Western diet (WD) for 28 days and treated with control ASOs (green) or PSMD9 ASOs (yellow) (presented as fold change from control ASO = 1). Data are mean ± s.e.m., n = 8 mice per group. e, f, Quantification of proteins (presented as fold change from control ASO = 1, mean ± s.e.m., n = 6 control ASO; n = 8 PSMD9 ASO mice per group) (e) as determined by western blot (f) in livers of both mouse strains fed a Western diet for 28 days and treated with ASOs. g, Plots (fold change from chow-fed control ASO = 1) of the abundance of hepatic diacylglycerol and triacylglycerol in mice treated with control ASOs on a chow diet (white) or Western diet (green), or treated with PSMD9 ASOs (yellow) on a Western diet. Data are mean ± s.e.m., n = 4 chow, n = 6 all WD except n = 5 DBA/2J control ASO DG, DBA/2J PSMD9 ASO TG and n = 4 DBA/2J control ASO TG mice per group. h, Haematoxylin and eosin staining of liver sections from both strains of mice fed a Western diet and treated with control ASOs (top) or PSMD9 ASOs (bottom) for 28 days. Data are representative of five independent mice. Dotted lines segregate regions of microsteatosis and hepatocyte ballooning. Original magnification, ×200. i, j, Plot (mean ± s.e.m., n = 6 control ASO, n = 8 PSMD9 ASO, mice per group) for synthesis of individual fatty acid species in both strains after a Western diet for 28 days and treatment with control ASOs (green) or PSMD9 ASOs (yellow). Data presented as percentage of hepatic fatty acid pool enriched with deuterium label. *P < 0.05, **P < 0.01, compared to control ASO WD.
To investigate the effect of PSMD9 silencing in lipotoxic conditions, we performed studies in mice that were treated with ASOs and concurrently fed a Western diet (Research Diets D12079B). PSMD9 silencing in this setting was associated with decreased expression of genes and proteins involved in de novo lipogenesis including Acaca, Acacb and Scd1 (Fig. 5d–f); however, the protein abundances of FASN and ACC (encoded by Acaca and Acacb, respectively) were significantly decreased only in DBA/2J mice. Twenty-eight days of a Western diet promoted an accrual of hepatic acylglycerols in both mouse strains (Fig. 5g and Supplementary Table 16), which was largely prevented by silencing Psmd9 in DBA/2J mice, and to a lesser extent in C57BL/6J mice (Fig. 5g). Histological analysis corroborated these findings, demonstrating reduced steatosis and hepatocyte ballooning in DBA/2J but not C57BL/6J mice (Fig. 5h). Notably, acylglycerol levels were also decreased in the plasma suggesting that lipid abundance per se was reduced after PSMD9-ASO, as opposed to being redirected from the liver (Extended Data Fig. 7d).
Given the observed effects of PSMD9 silencing on lipogenesis pathways, we sought to measure de novo lipogenesis in vivo using deuterium-labelled water. PSMD9 silencing led to a significant reduction in the synthesis of fatty acids in the liver of DBA/2J but not C57BL/6J mice (Fig. 5i, j). PSMD9-ASO was not associated with significant changes in the plasma levels of aspartate transaminase or alanine aminotransferase, food consumption or body weight (Extended Data Fig. 7e–g). These data confirm that PSMD9 directly regulates hepatic and plasma lipid abundance in a strain-dependent manner, at least in part via reductions in hepatic de novo lipogenesis, thus warranting further investigations into the utility of silencing PSMD9 as a potential strategy to reduce hepatic lipotoxicity.
Conclusion
We have generated a systems genetics resource that incorporates quantitative lipidomics and proteomics to interrogate mammalian lipid metabolism in replicate animals from 107 strains of a mouse GRP. Our study takes advantage of the inherent genetic diversity across the GRP, which results in significant variations in the hepatic lipidome and proteome in a setting of relatively limited environmental influence. Integration of these datasets has allowed us to interrogate central and circulating lipid metabolism at a systems level, which has improved our understanding of the complex pathways that contribute to lipid dysregulation. We have used this resource to reveal new pathways that are important in lipid regulation, identified promising diagnostic and prognostic biomarkers, and uncovered potential sub-cellular localization and function of unique lipid regulatory proteins. Moreover, we identified PSMD9 as a regulator of lipid metabolism, with potential therapeutic implications. Finally, these datasets and methodologies may serve to both complement and validate existing and forthcoming discovery resources.
METHODS
Data reporting
No statistical methods were used to predetermine sample size. Samples for all mass spectrometry-based analysis were randomized before acquisition. All animals for in vivo experiments were chosen randomly to receive treatment. Investigators were not blinded to allocation during experiments, but were blinded in assessment of analysis and outcome.
HMDP mice
All mice were sourced from The Jackson Laboratory and were subsequently bred and housed at University of California, Los Angeles, to generate offspring used in this study as previously described41,42. Male mice were maintained on a chow diet (Ralston Purina Company, 5001) until 8–10 weeks of age before being fasted for 16 h in a bedding-free cage. Mice were anaesthetized, exsanguinated and livers were immediately removed and snap-frozen. All protocols for these studies were compliant with those approved by the Institutional Care and Use Committee at University of California, Los Angeles.
Proteomics: liver proteomic sample preparation
Frozen liver (10 mg) was homogenized in 6 M urea, 2 M thiourea, 50 mM triethylammonium bicarbonate (TEAB), pH 8.0, containing protease inhibitor cocktail (Roche, 11873580001) by tip-probe sonication and centrifuged at 16,000g for 10 min at 4 °C. Lysates were precipitated with 6 volumes of acetone overnight at −30 °C. Protein pellets were centrifuged at 10,000g, 10 min at 4 °C resuspended in 6 M urea, 2 M thiourea, 50 mM TEAB, pH 7.9, and quantified by Qubit fluorescence (Thermo Fisher, Q33212). Concentrations were normalized and 100 μg of protein reduced with 10 mM dithiothreitol (DTT) for 60 min at 25 °C followed by alkylation with 25 mM iodoacetamide for 30 min at 25 °C in the dark. The reaction was quenched to a final concentration of 20 mM DTT and digested with lysyl endopeptidase Lys-C (Wako Pure Chemical Industries, 125–05061) at a 1:50 enzyme-to-substrate ratio for 2 h at 25 °C. The mixture was diluted fivefold with 25 mM TEAB, and digested with trypsin (Promega, V5111) at a 1:50 enzyme-to-substrate ratio for 16 h at 30 °C. The peptide mixture was acidified to a final concentration of 2% formic acid, 0.1% trifluoroacetic acid (TFA) and centrifuged at 16,000g for 15 min. Peptides were desalted using hydrophilic lipophilic balance-solid phase extraction (HLB-SPE) 96-well plates (Waters, 186000128) followed by elution with 50% acetonitrile, 0.1% TFA, and dried by vacuum centrifugation. For proteomic analysis of the HMDP by tandem mass tag (TMT) multiplexing, peptides were resuspended in 30 μl of 250 mM TEAB, pH 8.5, quantified by Colorimetric Peptide Assay (Thermo Fisher, 23275) and normalized to 10 μg per 10 μl. Peptides were labelled with 10-plex TMTs according to the manufacturer’s instructions (Thermo Fisher, 90110, lot PI202555). Each 10-plex experiment contained 9 different strains with a 10th reference label (either 126 or 131 isobaric label) made up of the same peptide digest from pooled mix of C57BL/6J livers. A list of the sample labelling strategy and replicates is available in PRIDE proteomeXchange. Peptides were labelled in a final concentration of 50% acetonitrile for 90 min at room temperature followed by de-acylation with 0.25% hydroxylamine for 15 min at room temperature and quenching with 0.1% TFA. Peptides from each 10-plex experiment were pooled and desalted using HLB–SPE and dried by vacuum centrifugation. Approximately 12 μg of peptide was fractionated into 9 fractions on an in-house packed TSKgel amide-80 HILIC column as previously described43. For proteomic analysis of ASO treated livers by LFQ, purified peptides were resuspended in 2% acetonitrile, 0.1% TFA, quantified by Qubit and normalized to 1 μg per 3 μl.
Affinity purification proteomic sample preparation
HEK293 cells were transfected with either a control pcDNA3.1 DNA plasmid or N-terminal Flag-tagged ACAD11 in pcDNA3.1 DNA plasmids were lysed in 0.3% CHAPS, 150 mM NaCl, 5% glycerol in 50 mM Tris, pH 7.5,containing protease inhibitor cocktail (Roche, 11873580001) by passing through a 22- and 27-gauge needle at 4 °C. Cellular debris was removed by centrifugation at 20,000g, 10 min at 4 °C and quantified by BCA (Thermo Fisher, 23225). Two milligrams of protein was incubated with 40 μl of μMACS Anti-DYKDDDDK beads (Miltenyi Biotech, 130–101-591) for 45 min with rotation at 4 °C. The suspension was separated with a μMACS column and magnetic separator, and washed with lysis buffer containing only 0.01% CHAPS followed by lysis buffer containing no CHAPS. Proteins were eluted with 2 M urea in 50 mM Tris, pH 7.5, containing 1 mM DTT, 5 mM iodoacetamide and 125 ng of trypsin (Promega, V5111), and digested overnight at room temperature. Peptides were acidified to 1% TFA and desalted using styrene divinylbenzene-reversed-phase sulfonate (SDB-RPS) microcolumns and eluted with 80% acetonitrile in 2% ammonium hydroxide followed by vacuum concentration.
Proteomic liquid chromatography–tandem mass spectrometry
TMT-labelled peptides were analysed on a Dionex 3500RS nanoUHPLC coupled to an Orbitrap Fusion mass spectrometer in positive mode. For proteomic analysis of the HMDP livers by TMT multiplexing, peptides were separated using an in-house packed 75 μm × 40-cm pulled column (1.9-μm particle size, C18AQ; Dr Maisch) with a gradient of 2–30% acetonitrile containing 0.1% formic acid over 100 min at 250 nl min−1 at 55 °C. An MS1 scan was acquired from 350–1,400 m/z (120,000 resolution, 4 × 10⁵ automatic gain control (AGC), 50-ms injection time) followed by MS/MS data-dependent acquisition with collision-induced dissociation and detection in the ion trap (1 × 10⁴ AGC, 70-ms injection time, 30% normalized collision energy, 1.6 m/z quadrupole isolation width). Multi-notch isolation of the top 10 most intense MS/MS ions from 400–1,000 m/z excluding the precursor ion and neutral loss clusters <40 m/z were subjected to MS3 with higher energy collisional dissociation (HCD) and detection in the orbitrap (1 × 10⁵ AGC, 200-ms injection time, 55% normalized collision energy, 2 m/z ion trap isolation width, 100–500 m/z)17. For proteomic analysis of ASO-treated livers and affinity-enriched ACAD11 interactions by LFQ, peptides were separated using an in-house packed 75 μm × 50 cm pulled column (1.9-μm particle size, C18AQ, Dr Maisch) with a gradient of 2–30% acetonitrile containing 0.1% formic acid over 180 min at 300 nl min−1 at 55 °C. An MS1 scan was acquired from 300–1,500 m/z (60,000 resolution, 5 × 10⁵ AGC, 50-ms injection time) followed by MS/MS data-dependent acquisition with HCD and detection in the orbitrap (1 × 10⁵ AGC, 60-ms injection time, 30% normalized collision energy, 1.6 m/z quadrupole isolation width).
Proteomic data analysis
TMT-labelled data were processed with Proteome Discoverer (v.2.2) using Sequest44, Byonoic45 and Mascot. The precursor MS tolerance was set to 20 p.p.m. and the MS/MS tolerance was set to 0.8 Da with a maximum of two miss-cleavages. The peptides were searched with oxidation of methionine set as a variable modification, and TMT tags on the peptide N terminus and lysine residues and the carbamidomethylation of cysteine set as fixed modifications. All data were searched as a single batch and the peptide spectral matches of each database search filtered to 1% FDR using a target/decoy approach with Percolator46. The filtered peptide spectral matches from each database search were grouped and q-values were generated at the peptide level with the Qvality algorithm47. Finally, the grouped peptide data were further filtered to 1% protein FDR using Protein Validator. Quantification was performed with the reporter ion quantification node for TMT quantification in Proteome Discoverer. TMT precision was set to 20 p.p.m. and corrected for isotopic impurities. Only spectra with <50% co-isolation interference were used for quantification with an average signal-to-noise filter of >10. LFQ data were processed with MaxQuant (v.1.5.3.30) using Andromeda48 against the UniProt mouse or human databases.
Lipidomics
Sample preparation
Liver tissue was cryo-milled, suspended in PBS, sonicated and approximately 50 μg of protein in 10 μl of solution was transferred to a fresh tube for extraction. Ten microlitres of plasma was used for extraction. Lipids were extracted from samples and were processed and analysed by multiple reaction monitoring (MRM) liquid chromatography-tandem mass spectrometry (LC-MS/MS) as previously described21.
A detailed description of the method is as follows. Lipidomic analysis was performed by liquid chromatography–electrospray ionization–tandem mass spectrometry (LC–ESI–MS/MS) on an Agilent 1290 liquid chromatography system, using Mass Hunter software. Liquid chromatography was performed on a Zorbax Eclipse Plus 1.8 μm C18, 50 × 2.1 mm column (Agilent Technologies). Solvents A and B consisted of tetrahydrofuran:methanol:water in the ratios 30:20:50 and 75:20:5, respectively, both containing 10 mM ammonium formate. Columns were heated to 50 °C and the auto-sampler regulated to 25 °C. Lipid species (1 μl injection) were separated under gradient conditions at a flow rate of 400 μl min−1. The gradient was as follows; 0% solvent B to 40% solvent B over 2.0 min, 40% solvent B to 1000% solvent B over 6.5 min, 0.5 min at 100% solvent B, a return to 0% solvent B over 0.5 min then 0.5 min at 0% solvent B before the next injection (total run time of 10 min).
The mass spectrometer was operated in dynamic/scheduled multiple reaction monitoring (dMRM) mode. There were 310 unique lipid species measured together with 15 stable isotope or non-physiological lipid standards. The mass spectrometer voltages used for the acquisition of data were as follows: fragmentor voltage 380 V and cell accelerator voltage 5 V. The collision energy voltage was set individually for each lipid class and subclass. Acquisition windows were set to between 0.7 and 1.76 min depending on the chromatographic properties of the lipid. Furthermore, there were several sets of isobaric lipid species which shared the same nominal parent ion mass and also give rise to the same product ions. Specifically, for isobaric species of phosphatidylcholine, alkylphosphatidylcholine and PC(P) the parent and product ions (m/z 184) the same. As a result, a single MRM transition was used to measure the corresponding species within each subclass, using an increased MRM window time (22 combinations). In addition, there were eight occurrences of isobaric phosphatidylethanolamine and PE(P) lipid species (representing the neutral loss of 141 Da), and these were similarly combined into a single dMRM transition. Analysis of triacylglycerols was based on single ion monitoring. To perform this analysis in the dMRM mode, both Q1 and Q3 were set to the [M + NH4]+ values for each triacylglycerol species and the collision energy was reduced to 5 V to minimise collision induced dissociation.
Although most lipid classes and subclasses have similar response factors for lipid species within the class, some classes show greater variation in response factors between species and consequently, correction factors were applied for some lipid classes. For example, fragmentation of the ammoniated adducts of diacylglycerol and triacylglycerol leads to the loss of ammonia and a fatty acid. In this context, it is important to recognize that for species that contain more than one of the same fatty acid, the loss of that fatty acid will result in an enhanced signal, as it is the end product from two competing pathways. Consequently, where we used an MRM transition that corresponded to the loss of a fatty acid that was present more than once, we divided by the number of times that fatty acid was present. Although we recognize that the response factor for different species of triacylglycerol varied substantially, the lack of suitable standards precluded the determination of suitable response factors for each triacylglycerol species.
Cholesteryl ester
Response factors were determined with seven commercially available species and used to create a formula to extrapolate for all cholesterol ester chain lengths and double bonds. Saturated species were characterized by the following relationship: y = 0.1486x − 1.5917, in which y is the response factor relative to the cholesterol ester 18:0 d6 internal standard and x is the carbon chain length. For monounsaturated species, the response factor was multiplied by 1.84 and for polyunsaturated species by 6.0.
A single response factor was calculated for all phosphatidylinositol species to account for the use of the phosphatidylethanolamine 17:0/17:0 as the internal standard for this lipid class. A nine-point standard curve was created using commercially available phosphatidylinositol 32:0 and subsequently spiked into solvent containing a fixed concentration of phosphatidylethanolamine 17:0/17:0. The standard curve resulted in a linear response and indicated a response factor of 1.44 for phosphatidylinositol species relative to phosphatidylethanolamine standard. Other lipid species were not corrected.
Quality control samples
Two types of quality control sample were used in this study. Historical plasma samples from six healthy volunteers were pooled and split into multiple aliquots as previously described49. We refer to these samples as plasma quality control (PQC) samples. These samples were then subjected to extraction and LC–MS analysis alongside study samples to provide a measure of analytical variability across the cohort as a whole. In addition, we used identical lipid extracts, which were prepared by pooling the lipid extracts from multiple PQC samples using this mixture to prepare multiple aliquots which were referred to as technical quality control (TQC) samples. Analysis of these samples captures only the variation associated with the LC–MS performance. Within the analytical process every 25 plasma samples a PQC and TQC were included.
Data pre-processing
In this study, HMDP liver samples were run in two batches. An extraction batch consisted of approximately 200 samples each including PQC, TQC and blanks. A median-centring approach was used for correction of the batch effect. The median PQC concentration of each lipid for each batch was used as a reference point to align the samples with the entire cohort. The alignment was performed by calculating a correction factor to adjust the concentration of each PQC lipid in each batch to the median value for all batches.
Bioinformatics and data analysis
Biweight midcorrelation analyses were performed using R and q-values estimated using a ranked Benjamini–Hochberg multiple comparison test with significance quoted at q < 0.05. Proteomic and lipidomic comparisons following modulation of Psmd9 and ACAD11 AP–MS were compared to respective controls using either two-way t-tests or ANOVA, and P-value data are presented as permutation-based FDR-corrected with significance quoted at P < 0.05. To perform unsupervised hierarchical clustering of the HMDP proteomes and lipidomes, data were first median-centred and the similarity of each strain was assessed using Euclidean distance metric. Hierarchical clustering with complete agglomeration method was then applied to cluster strains with respect to their global profiles. To identify plasma lipid signatures to predict liver lipid, we computed pairwise ratios of plasma lipids. Given the large number of plasma lipid ratios and the much smaller mouse sample size (P > > n), we applied a two-step approach to identify from all plasma lipid ratios, the ones that are potentially predictive to the total amount of the six liver lipid classes (cholesterol ester, ceramide, diacylglycerol, triacylglycerol, free cholesterol and PE(P)). In the first step, we filtered plasma lipid ratios using their Pearson’s correlation with the total amount of the liver lipids by retaining the top-10% most correlated ratios for each of the six liver lipid classes. In the second step, we used a clustering-based representative feature selection approach24 to identify a set of diverse and representative plasma lipid ratios from all remaining lipids after step 1. This procedure led to a reduction of plasma lipid ratios from 29,403 to approximately 50 for each of the six liver lipid classes. Lastly, we used a Lasso regression approach with a repeated (10 times) fivefold cross-validation procedure to test the capability of the selected plasma lipid ratios to predict the total amount of each of the six liver lipid class. This prediction procedure leads to 50 prediction results that were referred to as ‘trials’. We classified the predictability of each of the 6 liver lipid into high, median and low, based on the significance of models fitted on plasma lipid ratios in the 50 trials. The results of these tests were classified into high (100%), median (50–99%) or low (<50%) predictability based on the number of trials that passed significance (P < 0.05) of the fitted model. Circos plot50 was used to visualize the three-way genetic interaction between SNPs, proteins and lipid species. KEGG and Gene Ontology analysis was performed using the Database for Annotation, Visualization and Integrated Discovery (DAVID v.6.8) hosted by the National Institute of Allergy and Infectious Diseases (NIAID), NIH51. In brief, target lists were generated from external analyses and then entered as a gene list in DAVID. Background adjustment was enabled against the Mus musculus reference gene set and functional annotation clustering was performed with the classification stringency set at medium and P-value data presented as Benjamini–Hochberg-corrected. Network analysis was performed in Cytoscape52 and integrated data from the HINT and BioGRID databases30,53, and protein complexes from the CORUM database54.
QTL mapping of proteins and lipids
Datasets of liver lipidomics, proteomics or plasma lipids were mapped for association of each SNP using a linear mixed model. Although a minimum threshold of 50 strains was used as a requirement for detection of each protein for correlation analysis, both the entire lipidome (liver and plasma) as well as nearly 2,500 proteins were detected in all 307 mice. We applied an efficient mixed-model association (fast-lmm) to identify SNPs associating with indicated traits as described below:
in which n is the number of individuals; μ is the mean; β is the allele effect of the SNP; x is the (n × 1) vector of observed genotypes of the SNP. This model takes population structure into account, as u is the random effects due to genetic relatedness with var.(u) = σ2uK, and e denotes the random noise with var.(e) = σ2eI. Here, K indicates the identity-by-state kinship matrix estimated using all SNPs; I represents the (n × n) identity matrix; and 1n is the (n × 1) vector of ones. σ2u and σ2e were estimated using restricted maximum likelihood and computed P values using the standard F-test to test the null hypothesis in which β = 0. Genome-wide significance threshold and genome-wide association mapping were determined as the family-wise error rate as the probability of observing one or more false positives across all SNPs for a given phenotype. To correct for false discovery, q-values were estimated from the distribution of P values using the linear mixed model from the R package ‘q value’ as previously described11. This model has been tested rigorously7, and the HMDP used to determine many validated QTLs for quantitative traits13,41,42,55,56, including liver lipid species56 and protein levels55,57. Significance was calculated at q-value < 0.1 (cis-pQTL = ±10 Mb of the gene, approximated local adjusted P < 1 × 10⁻⁴; lQTLs = approximated global adjusted P < 4.2 × 10⁻⁶).
Cell cultures and treatments
HEK293 cells obtained from ATCC were maintained in DMEM with 10% FBS and regularly tested for mycoplasma. For transfections, cells were plated onto cell-culture-treated plates or onto acid-stripped coverslips at 60% confluence in growth medium in the morning. Later that day or the next day, cells were transfected with 500 μg of the appropriate plasmids using FuGene6 (Promega) according to the manufacturer’s instructions. Then 24–48 h later, cells were collected for downstream processing (western blot, fractionation or proteomics) or fixed and mounted for confocal imaging.
Cloning and expression vectors
PCR amplification of genes of interest was performed from cDNA as previously described58 using Phusion DNA polymerase (Thermo Fisher). Human ACAD11 was cloned from Hep3B cell cDNA, and mouse Psmd9 was cloned from mouse liver cDNA. Amplified open-reading frames were cloned into expression vectors using Gateway Technology, restriction enzyme digest or Gibson assembly reactions (pDEST-47 GFP, C-term 3xFlag) or pAdEasy system (Agilent). Expression vectors were sequence verified and subsequently amplified and purified by midi-prep (Promega) before use in downstream protocols. Fluorescently tagged organelle constructs were purchased from AddGene (plasmid 1817: Lamp1-RFP, 54503: DsRed2-Peroxisomes-4 and 58014: mTa-gRFP-T-Endosomes-14).
Confocal imaging
Cells were plated and transfected as described above. When ready, cells were washed, fixed in 10% formalin for 30 min and then washed again before briefly being stored in PBS. Coverslips were mounted on the stage of a Nikon A1r-Plus SI NIR Modified inverted scanning confocal microscope, covered with PBS and imaged using a 60× water immersion lens. Images were captured using NIS-Elements software and post-capture images were processed and standardized using ImageJ software.
Immunoblot analysis
Cells or tissue samples were homogenized in RIPA lysis buffer containing freshly added protease (complete EDTA-free, Roche) and phosphatase (Sigma) inhibitors as previously described59. Resolved proteins were transferred to PVDF membranes and subsequently probed with the following antibodies: PSMD9 (Sigma), β-actin, PDI, FASN, ACC and SCD1 (Cell Signaling Technologies), ACAD11 (Invitrogen), PORIN (also known as VDAC1) (Mitosciences), PEX14 (Proscitech), pan 14–3-3 (Santa Cruz Biotechnology). Densitometric analysis was performed using GE Software or BioRad Quantity One software.
Quantitative RT-PCR
Tissues were homogenized in RNAzol reagent and RNA was isolated by addition of 1-bromo-3-chloropropane (BCP) or chloroform and precipitated in isopropanol60. RNA was pelleted and washed twice in 70% ethanol and then resuspended in molecular-grade water. cDNA synthesis was performed using 1 μg of RNA with M-MLV reverse transcriptase (Thermo Fisher). Quantitative PCR (qPCR) reactions were prepared using iTaq Fast SYBR Green Supermix (Biorad) or KAPA SYBR fast LC480 mix (Roche) with 10–20 ng of cDNA template and performed on an ABI Fast 7500 real time detection system or Roche LC480. Quantification of a given gene, expressed as relative mRNA level compared with control, was calculated using the ΔΔCt method or an efficiency corrected method (Roche) after normalization to a standard housekeeping gene (RPLP0 (also known as 36B4) or PPIA (also known as cyclophilin A). Primers sequences are available upon request.
Mice fed with a high-fat diet
Eight-week-old male C57BL/6J mice were fed a chow diet (n = 11) or high-fat diet (n = 10) (SF04–001, Speciality Feeds) for 12 weeks before plasma and liver collection in accordance with the AMREP Animal Ethics Committee at the Baker Heart & Diabetes Institute. Lipid content of livers was analysed by lipidomic analysis as described.
Adenovirus in mice
Mouse PSMD9 (mPSMD9) was cloned as described above and shuttled into adenoviral expression vectors. The generation of pAd-mPSMD9 and pAd-control was carried out as previously described61. Adenovirus particles were prepared using the AdEasy system (Agilent) and purified by CsCl gradient centrifugation. The virus was dialysed for 48 h and stored at −80 °C. Particles were quantified by serial dilution methods by detection of plaques in HEK293Ad (Agilent) cells. Male C57BL/6J and DBA/2J mice (Jackson Labs, 8 weeks old, n = 9–10) were injected with 109 plaque-forming units of adenovirus via tail-vein injection. Livers and plasma were collected 5–7 days after infection after fasting for 4–5 h.
ASOs in mice
ASOs were designed and synthesized by Ionis Pharmaceuticals. Chimeric 16-oligonucleotide phosphorothioate oligonucleotides targeted to mouse Psmd9 (5′-CTCTATGGGTGCCAGC-3′) or control (5′-GGCCAATACGCC GTCA-3′) sequences were synthesized and purified as previously described62. In the first study, ASOs were delivered by intraperitoneal injection twice weekly to chow-fed 8-week-old C57BL/6J or DBA/2J mice (Jackson Laboratories) at a dose of 25 mg kg−1 for 1 week (vehicle, n = 4 mice per group). Livers were analysed by western blot, proteomics and lipidomics. In the second study, male C57BL/6J and DBA/2J mice were treated with vehicle (PBS), control ASO or Psmd9 ASO at 25 mg kg−1 by intraperitoneal injection, twice weekly. Mice were treated for 28 days, and fed a Western diet for the same period (Research Diets, D12079B) (n = 8 mice per group). Mice were culled and tissues and plasma were obtained for lipidomic analysis as well as Western blotting and qPCR. For the third study, male C57BL/6J and DBA/2J mice were fed a Western diet for 4 weeks and treated with vehicle (PBS, n = 6 per group), control ASO (n = 6 per group) or Psmd9 ASO (n = 8 per group) at 25 mg kg−1 by intraperitoneal injection weekly. Body weight and composition (determined by NMR, Bruker) were measured weekly, and food intake (daily weighing of hoppers) was monitored in the final two weeks. For the final week of diet, mice were provided with 5% deuterium oxide (Sigma) in the drinking water before tissues were obtained. Plasma ALT and AST were analysed using a commercial kit according to the manufacturer’s instructions (TECO Diagnostics).
In vivo de novo lipogenesis studies
Livers were homogenized in ice-cold PBS using the OMNI Bead Ruptor and lipids extracted by mild acid methanolysis using concentrated HCl supplemented with trinonadecanoin (Nu-chek Prep, T-165) as internal standard for fatty acid methyl esters (FAMES) analysis. After extraction of resulting FAMES with 1 ml hexane, 20 μl of sample was analysed for FAMES by gas chromatography–mass spectrometry (GC–MS) using an Agilent 7890B/5977A with DB-WAX UI column (Agilent, 122–7032 UI). Complete GC–MS configurations and running programs are available upon request. Quantification of all ions was determined using custom python Tkinter software by comparison of sample data with serial dilutions of Nu-Check-Prep Fatty Acid Standard Mix (GLC 20a) that contain a mixture of various long-chain fatty acid species (methyl myristate, palmitate, palmitoleate, stearate, oleate, linoleate and linolenate). Integration of all ions (samples and standards) was performed on MassHunter Quantitative Analysis Program (Agilent Technologies). De novo lipogenesis analysis was evaluated by labelled isotopic enrichment of FAMES after correcting for the natural abundance of stable isotopes using the modern least-squares implementation of the skewed matrix correction method63.
Code availability
msAnalyzer source code is available at https://github.com/gcalmettes/labUtils.
Reporting summary
Further information on research design is available in the Nature Research Reporting Summary linked to this paper.
Data availability
All proteomics raw and processed data associated with the paper have been deposited in PRIDE proteomeXchange (http://www.proteomexchange.org/) using the following credentials: HMDP proteomics project accession = PXD010818 (reviewer username/password = reviewer09277@ebi.ac.uk/hyEjKh9x ). ACAD11 AP–MS project accession = PXD010788 (reviewer username/password = reviewer14659@ebi.ac.uk/fg65Cfuf). Proteomics of PSMD9 ASO project accession PXD010759 (reviewer username/password = reviewer88344@ebi.ac.uk/7bA TnY6j). All HMDP lipidomics raw acquisition files and associated documents are available at https://doi.org/10.6084/m9.figshare.7488854. Any remaining datasets are available in the Supplementary Information files or can be made available upon reasonable request to the corresponding author(s). All biological material will be made available upon reasonable request, with the exception of the ASOs, which are subject to a standing materials transfer agreement between the listed academic institutions and Ionis Therapeutics.
Extended Data
Extended Data Fig. 1 |. Assessment of proteomic and lipidomic data reproducibility.
a, b, Coefficient of variation (CV) analysis of the proteomics (a) and lipidomics (b) data. Box-and-whisker plots (described as in Fig. 3e). c–e, Unsupervised hierarchical clustering of the liver proteomics (c), liver lipidomics (d) and plasma lipidomics (e) data.
Extended Data Fig. 2 |. Total liver triacylglycerol levels in C57BL/6J mice.
Mice were fed either a normal chow diet (NCD) or a high-fat diet (HFD) for 12 weeks. P value determined by Student’s t-test. Data are mean ± s.e.m., n = 11 chow group; n = 10 HFD group.
Extended Data Fig. 3 |. Average strain abundance of designated lipid classes in liver and plasma.
a–e, Abundance is expressed as area under the curve per mg liver protein or per ml of plasma. Liver scale on left, plasma scale on right a, Triacylglycerol. b, Diacylglycerol. c, Ceramide. d, Cholesterol esters. e, PE(P).
Extended Data Fig. 4 |. Correlation network analysis of the HMDP liver proteome.
a, Protein:protein (P:P) correlations in the HMDP liver proteome, integrated with CORUM-annotated proteins and protein interactions previously identified by AP–MS. Numbers indicate CORUM accessions, orange lines are HMDP P:P correlations; purple lines are correlations observed in both HMDP and CORUM. b–e, P:P correlations of selected CORUM complexes including associations not previously identified by AP–MS (green lines). Biweight midcorrelation analyses performed using ranked Benjamin–Hochberg multiple comparison test. Purple lines are known CORUM interactions, orange lines are HMDP P:P and CORUM interactions, green lines are previously unidentified interactions from HMDP P:P data. A thicker line represents a higher bicor value (q < 0.05, n > 50 strains).
Extended Data Fig. 5 |. Biweight midcorrelation of 108 liver lipid species against 378 liver proteins mapped onto annotated KEGG pathways.
Highlighted are various correlations (orange is positive, aqua is negative) between individual lipid species and proteins in pathways associated with unsaturated fatty acid metabolism, fatty acid degradation and metabolism, lysosomal degradation, and proteolysis. Only proteins containing more than one significant correlation to a lipid and annotated to the KEGG database are shown (biweight midcorrelation using ranked Benjamin–Hochberg multiple comparison test, q < 0.05, n > 50).
Extended Data Fig. 6 |. Overexpression of PSMD9 in C57BL/6J and DBA/2J mice.
Adenoviral overexpression of PSMD9 in C57BL/6J and DBA/2J mice (n = 9, 7 days after tail-vein injection of 109 plaque-forming units). a, b, Western blot (a) and densitometry (b) of PSMD9 and PDI (loading control) in the livers of mice treated with either control adenovirus (pAdV) or PSMD9 adenovirus. Data are mean ± s.e.m. c, Liver and plasma lipidomics of adenovirus-treated mice. Top panel (above first dotted line) shows relative fold change of total lipid classes. Middle and bottom panels show relative fold changes of individual diacylglycerol and triacylglycerol lipid species, respectively. P values determined by t-test with permutation-based FDR correction. Filled bubbles are significant (q < 0.05) changes, larger bubbles indicate greater significance.
Extended Data Fig. 7 |. ASO knockdown of PSMD9 in C57BL/6J and DBA/2J mice.
a-c, Assessment of hepatotoxicity as measured by plasma levels (U/L) of aspartate transaminase (AST) and alanine transaminase (ALT) (a), percentage of liver weight to body weight (b) and total body weight (c) of mice on a normal chow diet and treated with PBS, control ASO or PSMD9 ASO for 7 days (n = 4 per group, twice-weekly injection at 25 mg kg−1). d, Lipidomic analysis of total diacylglycerols and triacylglycerols in the plasma of mice on a chow diet (n = 4 C57BL/6J, n = 3 DBA/2J mice per group) or a Western diet (n = 6 mice per group, except n = 5 DBA/2J control ASO mice per group) and treated with either control or PSMD9 ASOs (twice-weekly ASO injection at 25 mg kg−1). e–g, Assessment of hepatotoxicity as measured by plasma AST and ALT levels (e), percentage change in body weight from baseline (f), and food consumption normalized to body weight (g) from in vivo de novo lipogenesis experimental animals (n = 6 control ASO, n = 8 PSMD9 ASO, 28 days on diet and weekly injection of ASO injection at 25 mg kg−1). *P < 0.05, **P < 0.01 control ASO versus PSMD9 ASO, t-test. Data are mean ± s.e.m.
Extended Data Table 1 |.
Correlations between PSMD9 gene expression and indices of adiposity
| Rank | Gene | z-score | q-value | Phenotype | Tissue |
|---|---|---|---|---|---|
| 1 | PSMD9 | 6.85 | 7.40E-12 | Trunk fat mass | Liver |
| 2 | PSMD9 | 6.83 | 8.30E-12 | Whole body fat mass | Liver |
| 3 | PSMD9 | 6.79 | 1.10E-11 | Leg fat mass right | Liver |
| 4 | PSMD9 | 6.76 | 1.40E-11 | Whole body fat mass | Whole Blood |
| 5 | PSMD9 | 6.74 | 1.50E-11 | Trunk Fat Mass | Whole Blood |
| 6 | PSMD9 | 6.58 | 4.70E-11 | Hip circumference | Whole Blood |
| 7 | PSMD9 | 6.54 | 6.20E-11 | Leg fat mass left | Liver |
| 8 | PSMD9 | 6.37 | 1.90E-10 | Weight | Whole Blood |
| 9 | PSMD9 | 6.33 | 2.50E-10 | Body fat percentage | Liver |
| 10 | PSMD9 | 6.26 | 3.80E-10 | Trunk fat percentage | Liver |
| 11 | PSMD9 | 6.24 | 4.50E-10 | Trunk predicted mass | Skeletal Muscle |
| 12 | PSMD9 | 6.2 | 5.80E-10 | Trunk fat free mass | Skeletal Muscle |
| 13 | PSMD9 | 6.19 | 6.20E-10 | Whole body water mass | Skeletal Muscle |
| 14 | PSMD9 | 6.15 | 7.60E-10 | Arm fat mass right | Liver |
| 15 | PSMD9 | 6.14 | 8.40E-10 | Whole body fat free mass | Skeletal Muscle |
| 16 | PSMD9 | 6.13 | 8.90E-10 | Leg fat mass right | Whole Blood |
| 17 | PSMD9 | 6.09 | 1.10E-10 | Arm fat free mass left | Skeletal Muscle |
| 18 | PSMD9 | 6.05 | 1.40E-10 | Weight | Liver |
| 19 | PSMD9 | 6.02 | 1.70E-09 | Leg fat mass left | Whole Blood |
| 20 | PSMD9 | 6.01 | 1.90E-09 | Arm fat mass left | Liver |
Top 20 correlations (elastic net 0.5 algorithm) between PSMD9 expression quantified across 48 tissues (n = 200) and 2,400 phenotypes measured in patients in the UK Biobank (n = 500,000). Nine of the top twenty correlations are observed between hepatic PSMD9 expression and measures of adiposity.
Supplementary Material
Acknowledgements
This work was supported in part by the following: ANZ Victorian Medical Research Trust, Baker Heine Trust, Victorian State Government’s OIS Program and National Heart Foundation of Australia (A.C.C., B.G.D. and E.J.Z.); National Health and Medical Research Council of Australia (NHMRC) grants and fellowships (D.E.J. and B.L.P.); NIH grants HL122677, DK112119, DK102559 (T.Q.d.A.V.), HL028481 (A.J.L., T.Q.d.A.V.), HL118161 and HL136543 (E.J.T.); American Heart Association grant SDG18440015 (T.Q.d.A.V.). Baker Bright Sparks Scholarship and Australian Post-graduate Award (M.F.K.). We thank B. Crossett, S. Cordwell and The Sydney University Mass Spectrometry Facility. We are also grateful for the help and guidance of I. Carmichael and S. Bond and our many internal and external collaborators.
Reviewer information Nature thanks Christa Buechler, Steven Munger and the other anonymous reviewer(s) for their contribution to the peer review of this work.
Footnotes
Competing interests R. Lee holds shares in Ionis Pharmaceuticals. B.G.D., A.C.C., T.Q.d.A.V. and D.E.J. are inventors on patent PCT/AU2019/050033 pertaining to aspects of the PSMD9 work. All other authors declare no competing interests.
Additional information
Extended data is available for this paper at https://doi.org/10.1038/s41586-019-0984-y.
Supplementary information is available for this paper at https://doi.org/10.1038/s41586-019-0984-y.
Online content
Any methods, additional references, Nature Research reporting summaries, source data, statements of data availability and associated accession codes are available at https://doi.org/10.1038/s41586-019-0984-y.
Publisher's note: Springer Nature remains neutral with regard to jurisdictional claims in published maps and institutional affiliations.
References
- 1.Younossi ZM et al. Global epidemiology of nonalcoholic fatty liver disease-Meta-analytic assessment of prevalence, incidence, and outcomes. Hepatology 64, 73–84 (2016). [DOI] [PubMed] [Google Scholar]
- 2.Sookoian S & Pirola CJ The genetic epidemiology of nonalcoholic fatty liver disease: toward a personalized medicine. Clin. Liver Dis 16, 467–485 (2012). [DOI] [PubMed] [Google Scholar]
- 3.Sookoian S & Pirola CJ Genetic predisposition in nonalcoholic fatty liver disease. Clin. Mol. Hepatol 23, 1–12 (2017). [DOI] [PMC free article] [PubMed] [Google Scholar]
- 4.Mackay TF et al. The Drosophila melanogaster Genetic Reference Panel. Nature 482, 173–178 (2012). [DOI] [PMC free article] [PubMed] [Google Scholar]
- 5.Peirce JL, Lu L, Gu J, Silver LM & Williams RW A new set of BXD recombinant inbred lines from advanced intercross populations in mice. BMC Genet. 5, 7 (2004). [DOI] [PMC free article] [PubMed] [Google Scholar]
- 6.Churchill GA et al. The Collaborative Cross, a community resource for the genetic analysis of complex traits. Nat. Genet 36, 1133–1137 (2004). [DOI] [PubMed] [Google Scholar]
- 7.Bennett BJ et al. A high-resolution association mapping panel for the dissection of complex traits in mice. Genome Res. 20, 281–290 (2010). [DOI] [PMC free article] [PubMed] [Google Scholar]
- 8.Churchill GA, Gatti DM, Munger SC & Svenson KL The Diversity Outbred mouse population. Mamm. Genome 23, 713–718 (2012). [DOI] [PMC free article] [PubMed] [Google Scholar]
- 9.Wu Y et al. Multilayered genetic and omics dissection of mitochondrial activity in a mouse reference population. Cell 158, 1415–1430 (2014). [DOI] [PMC free article] [PubMed] [Google Scholar]
- 10.Williams EG et al. Systems proteomics of liver mitochondria function. Science 352, aad0189 (2016). [DOI] [PMC free article] [PubMed] [Google Scholar]
- 11.Chick JM et al. Defining the consequences of genetic variation on a proteome-wide scale. Nature 534, 500–505 (2016). [DOI] [PMC free article] [PubMed] [Google Scholar]
- 12.Buscher K et al. Natural variation of macrophage activation as disease-relevant phenotype predictive of inflammation and cancer survival. Nat. Commun 8, 16041 (2017). [DOI] [PMC free article] [PubMed] [Google Scholar]
- 13.Wang JJ et al. Genetic dissection of cardiac remodeling in an isoproterenol-induced heart failure mouse model. PLoS Genet. 12, e1006038 (2016). [DOI] [PMC free article] [PubMed] [Google Scholar]
- 14.Hui ST et al. The genetic architecture of diet-induced hepatic fibrosis in mice. Hepatology 68, 2182–2196 (2018). [DOI] [PMC free article] [PubMed] [Google Scholar]
- 15.Jha P et al. Systems analyses reveal physiological roles and genetic regulators of liver lipid species. Cell Syst. 6, 722–733 (2018). [DOI] [PMC free article] [PubMed] [Google Scholar]
- 16.Jha P et al. Genetic regulation of plasma lipid species and their association with metabolic phenotypes. Cell Syst. 6, 709–721 (2018). [DOI] [PMC free article] [PubMed] [Google Scholar]
- 17.McAlister GC et al. MultiNotch MS3 enables accurate, sensitive, and multiplexed detection of differential expression across cancer cell line proteomes. Anal. Chem 86, 7150–7158 (2014). [DOI] [PMC free article] [PubMed] [Google Scholar]
- 18.Alshehry ZH et al. An efficient single phase method for the extraction of plasma Lipids. Metabolites 5, 389–403 (2015). [DOI] [PMC free article] [PubMed] [Google Scholar]
- 19.Meikle PJ & Summers SA Sphingolipids and phospholipids in insulin resistance and related metabolic disorders. Nat. Rev. Endocrinol 13, 79–91 (2017). [DOI] [PubMed] [Google Scholar]
- 20.Samuel VT & Shulman GI Nonalcoholic fatty liver disease as a nexus of metabolic and hepatic diseases. Cell Metab. 27, 22–41 (2018). [DOI] [PMC free article] [PubMed] [Google Scholar]
- 21.Alshehry ZH et al. Plasma lipidomic profiles improve on traditional risk factors for the prediction of cardiovascular events in type 2 diabetes mellitus. Circulation 134, 1637–1650 (2016). [DOI] [PubMed] [Google Scholar]
- 22.Tonks KT et al. Skeletal muscle and plasma lipidomic signatures of insulin resistance and overweight/obesity in humans. Obesity 24, 908–916 (2016). [DOI] [PMC free article] [PubMed] [Google Scholar]
- 23.Mundra P A. et al. Large-scale plasma lipidomic profiling identifies lipids that predict cardiovascular events in secondary prevention. JCI Insight 3, 121326 (2018). [DOI] [PMC free article] [PubMed] [Google Scholar]
- 24.Yang P, Zhang Z, Zhou BB & Zomaya AY A clustering based hybrid system for biomarker selection and sample classification of mass spectrometry data. Neurocomputing 73, 2317–2331 (2010). [Google Scholar]
- 25.Peng KY et al. Mitochondrial dysfunction-related lipid changes occur in nonalcoholic fatty liver disease progression. J. Lipid Res 59, 1977–1986 (2018). [DOI] [PMC free article] [PubMed] [Google Scholar]
- 26.Ryan CJ, Kennedy S, Bajrami I, Matallanas D & Lord CJ A compendium of co-regulated protein complexes in breast cancer reveals collateral loss events. Cell Syst. 5, 399–409.e395 (2017). [DOI] [PMC free article] [PubMed] [Google Scholar]
- 27.Ruepp A et al. CORUM: the comprehensive resource of mammalian protein complexes—2009. Nucleic Acids Res. 38, D497–D501 (2010). [DOI] [PMC free article] [PubMed] [Google Scholar]
- 28.Huttlin EL et al. Architecture of the human interactome defines protein communities and disease networks. Nature 545, 505–509 (2017). [DOI] [PMC free article] [PubMed] [Google Scholar]
- 29.Hein MY et al. A human interactome in three quantitative dimensions organized by stoichiometries and abundances. Cell 163, 712–723 (2015). [DOI] [PubMed] [Google Scholar]
- 30.Das J & Yu H HINT: High-quality protein interactomes and their applications in understanding human disease. BMC Syst. Biol 6, 92 (2012). [DOI] [PMC free article] [PubMed] [Google Scholar]
- 31.Chatr-Aryamontri A et al. The BioGRID interaction database: 2017 update. Nucleic Acids Res. 45 (D1), D369–D379 (2017). [DOI] [PMC free article] [PubMed] [Google Scholar]
- 32.Thul P J. et al. A subcellular map of the human proteome. Science 356, eaal3321 (2017). [DOI] [PubMed] [Google Scholar]
- 33.Waterham HR, Ferdinandusse S & Wanders RJ Human disorders of peroxisome metabolism and biogenesis. Biochim. Biophys. Acta 1863, 922–933 (2016). [DOI] [PubMed] [Google Scholar]
- 34.Van Veldhoven P P Biochemistry and genetics of inherited disorders of peroxisomal fatty acid metabolism. J. Lipid Res 51, 2863–2895 (2010). [DOI] [PMC free article] [PubMed] [Google Scholar]
- 35.Spanos C et al. Proteomic identification and characterization of hepatic glyoxalase 1 dysregulation in non-alcoholic fatty liver disease. Proteome Sci. 16, 4 (2018). [DOI] [PMC free article] [PubMed] [Google Scholar]
- 36.Makinen VP et al. Integrative genomics reveals novel molecular pathways and gene networks for coronary artery disease. PLoS Genet. 10, e1004502 (2014). [DOI] [PMC free article] [PubMed] [Google Scholar]
- 37.Watanabe TK et al. cDNA cloning and characterization of a human proteasomal modulator subunit, p27 (PSMD9). Genomics 50, 241–250 (1998). [DOI] [PubMed] [Google Scholar]
- 38.Gragnoli C PSMD9 gene in the NIDDM2 locus is linked to type 2 diabetes in Italians. J. Cell. Physiol 222, 265–267 (2010). [DOI] [PubMed] [Google Scholar]
- 39.Gragnoli C Overweight condition and waist circumference and a candidate gene within the 12q24 locus. Cardiovasc. Diabetol 12, 2 (2013). [DOI] [PMC free article] [PubMed] [Google Scholar]
- 40.Gragnoli C & Cronsell J PSMD9 gene variants within NIDDM2 may rarely contribute to type 2 diabetes. J. Cell. Physiol 212, 568–571 (2007). [DOI] [PubMed] [Google Scholar]
- 41.Parks BW et al. Genetic control of obesity and gut microbiota composition in response to high-fat, high-sucrose diet in mice. Cell Metab. 17, 141–152 (2013). [DOI] [PMC free article] [PubMed] [Google Scholar]
- 42.Parks BW et al. Genetic architecture of insulin resistance in the mouse. Cell Metab. 21, 334–347 (2015). [DOI] [PMC free article] [PubMed] [Google Scholar]
- 43.Palmisano G et al. Selective enrichment of sialic acid-containing glycopeptides using titanium dioxide chromatography with analysis by HILIC and mass spectrometry. Nat. Protocols 5, 1974–1982 (2010). [DOI] [PubMed] [Google Scholar]
- 44.Eng JK, McCormack AL & Yates JR An approach to correlate tandem mass spectral data of peptides with amino acid sequences in a protein database. J. Am. Soc. Mass Spectrom 5, 976–989 (1994). [DOI] [PubMed] [Google Scholar]
- 45.Bern M, Kil YJ & Becker C Byonic: advanced peptide and protein identification software. Curr. Protoc. Bioinformatics 40, 13.20.1–13.20.14 (2012). [DOI] [PMC free article] [PubMed] [Google Scholar]
- 46.Kail L, Canterbury JD, Weston J, Noble WS & MacCoss MJ Semi-supervised learning for peptide identification from shotgun proteomics datasets. Nat. Methods 4, 923–925 (2007). [DOI] [PubMed] [Google Scholar]
- 47.Kall L, Storey JD & Noble WS QVALITY: non-parametric estimation of q-values and posterior error probabilities. Bioinformatics 25, 964–966 (2009). [DOI] [PMC free article] [PubMed] [Google Scholar]
- 48.Cox J & Mann M MaxQuant enables high peptide identification rates, individualized p.p.b.-range mass accuracies and proteome-wide protein quantification. Nat. Biotechnol 26, 1367–1372 (2008). [DOI] [PubMed] [Google Scholar]
- 49.Huynh K et al. High-throughput plasma lipidomics: detailed mapping of the associations with cardiometabolic risk factors. Cell Chem. Biol. 26, 71–84.e4 (2018). [DOI] [PubMed] [Google Scholar]
- 50.Krzywinski M et al. Circos: an information aesthetic for comparative genomics. Genome Res. 19, 1639–1645 (2009). [DOI] [PMC free article] [PubMed] [Google Scholar]
- 51.Huang W, Sherman BT & Lempicki RA Systematic and integrative analysis of large gene lists using DAVID bioinformatics resources. Nat. Protocols 4, 44–57 (2009). [DOI] [PubMed] [Google Scholar]
- 52.Shannon P et al. Cytoscape: a software environment for integrated models of biomolecular interaction networks. Genome Res. 13, 2498–2504 (2003). [DOI] [PMC free article] [PubMed] [Google Scholar]
- 53.Breitkreutz BJ, Stark C & Tyers M The GRID: the General Repository for Interaction Datasets. Genome Biol. 4, R23 (2003). [DOI] [PMC free article] [PubMed] [Google Scholar]
- 54.Ruepp A et al. CORUM: the comprehensive resource of mammalian protein complexes. Nucleic Acids Res. 36, D646–D650 (2008). [DOI] [PMC free article] [PubMed] [Google Scholar]
- 55.Ghazalpour A et al. Comparative analysis of proteome and transcriptome variation in mouse. PLoS Genet. 7, e1001393 (2011). [DOI] [PMC free article] [PubMed] [Google Scholar]
- 56.Norheim F et al. Genetic and hormonal control of hepatic steatosis in female and male mice. J. Lipid Res 58, 178–187 (2017). [DOI] [PMC free article] [PubMed] [Google Scholar]
- 57.Pamir N et al. Proteomic analysis of HDL from inbred mouse strains implicates APOE associated with HDL in reduced cholesterol efflux capacity via the ABCA1 pathway. J. Lipid Res 57, 246–257 (2016). [DOI] [PMC free article] [PubMed] [Google Scholar]
- 58.Drew BG et al. HSP72 is a mitochondrial stress sensor critical for Parkin action, oxidative metabolism, and insulin sensitivity in skeletal muscle. Diabetes 63, 1488–1505 (2014). [DOI] [PMC free article] [PubMed] [Google Scholar]
- 59.Ribas V et al. Skeletal muscle action of estrogen receptor α is critical for the maintenance of mitochondrial function and metabolic homeostasis in females. Sci. Transl. Med 8, 334ra54 (2016). [DOI] [PMC free article] [PubMed] [Google Scholar]
- 60.Drew BG et al. Estrogen receptor (ER)α-regulated lipocalin 2 expression in adipose tissue links obesity with breast cancer progression. J. Biol. Chem 290, 5566–5581 (2015). [DOI] [PMC free article] [PubMed] [Google Scholar]
- 61.de Aguiar Vallim TQ et al. MAFG is a transcriptional repressor of bile acid synthesis and metabolism. Cell Metab. 21, 298–311 (2015). [DOI] [PMC free article] [PubMed] [Google Scholar]
- 62.Seth PP et al. Synthesis and biophysical evaluation of 2′,4′-constrained 2’O-methoxyethyl and 2′,4′-constrained 2’O-ethyl nucleic acid analogues. J. Org Chem 75, 1569–1581 (2010). [DOI] [PubMed] [Google Scholar]
- 63.Millard P, Letisse F, Sokol S & Portais JC IsoCor: correcting MS data in isotope labeling experiments. Bioinformatics 28, 1294–1296 (2012). [DOI] [PubMed] [Google Scholar]
Associated Data
This section collects any data citations, data availability statements, or supplementary materials included in this article.
Supplementary Materials
Data Availability Statement
All proteomics raw and processed data associated with the paper have been deposited in PRIDE proteomeXchange (http://www.proteomexchange.org/) using the following credentials: HMDP proteomics project accession = PXD010818 (reviewer username/password = reviewer09277@ebi.ac.uk/hyEjKh9x ). ACAD11 AP–MS project accession = PXD010788 (reviewer username/password = reviewer14659@ebi.ac.uk/fg65Cfuf). Proteomics of PSMD9 ASO project accession PXD010759 (reviewer username/password = reviewer88344@ebi.ac.uk/7bA TnY6j). All HMDP lipidomics raw acquisition files and associated documents are available at https://doi.org/10.6084/m9.figshare.7488854. Any remaining datasets are available in the Supplementary Information files or can be made available upon reasonable request to the corresponding author(s). All biological material will be made available upon reasonable request, with the exception of the ASOs, which are subject to a standing materials transfer agreement between the listed academic institutions and Ionis Therapeutics.


