

Establishing noninvasive biomarkers for response to immune checkpoint blockade is important. This study explored the use of circulating tumor DNA tumor mutational burden (ctDNA TMB) in non‐small cell lung cancer (NSCLC). This article evaluates this novel biomarker and reports on the landscape and clinical utility of ctDNA TMB in NSCLC.
Keywords: Circulating tumor DNA (ctDNA), Tumor mutational burden (TMB), NSCLC, PD‐1, PD‐L1
Abstract
Background.
Tissue tumor mutational burden (TMB) has emerged as a potential biomarker predicting response to anti‐programmed cell death‐1 protein receptor (PD‐1)/programmed cell death‐1 protein ligand (PD‐L1) therapy, but few studies have explored using circulating tumor DNA (ctDNA) TMB in non‐small cell lung cancer (NSCLC).
Materials and Methods.
A total of 136 patients with NSCLC with ctDNA testing were retrospectively evaluated from a single institution, along with a validation cohort from a second institution. ctDNA TMB was derived using the number of detected mutations over the DNA sequencing length.
Results.
Higher ctDNA TMB was significantly correlated with smoking history (p < .05, chi‐squared test). Among patients treated with immune checkpoint inhibitors (n = 20), higher ctDNA TMB was significantly correlated with shorter progressive free survival (PFS) and overall survival (OS; 45 vs. 355 days; hazard ratio [HR], 5.6; 95% confidence interval [CI], 1.3–24.6; p < .01, and OS 106 days vs. not reached; HR, 6.0; 95% CI, 1.3–27.1; p < .01, respectively). In a small independent validation cohort (n = 12), there was a nonsignificant numerical difference for higher ctDNA TMB predicting shorter OS but not PFS. ctDNA TMB was not correlated with RECIST tumor burden estimation in the subset of patients treated with immune checkpoint blockade.
Conclusion.
The findings indicate that higher ctDNA TMB, at the current commercial sequencing length, reflects worse clinical outcomes.
Implications for Practice.
Biomarkers to identify patients who will respond to immune checkpoint blockade are critical. Tissue tumor mutational burden (TMB) has emerged as a viable biomarker to predict response to anti‐PD‐1/PD‐L1 therapy, but few studies have explored the meaning and potential clinical significance of noninvasive, blood‐based TMB. Here, we investigated circulating tumor DNA (ctDNA) TMB and present data demonstrating that current ctDNA TMB may reflect tumor burden and that ctDNA panels with a greater number of mutations may be necessary to more accurately reflect tissue TMB.
Introduction
Immune checkpoint blockade has demonstrated considerable promise for a variety of tumor types, including non‐small cell lung cancer (NSCLC), melanoma, renal cell carcinoma, bladder carcinoma, and tumors with microsatellite instability (MSI). Therapies targeting the programmed cell death‐1 protein receptor (PD‐1)/programmed cell death‐1 protein ligand (PD‐L1) checkpoints have produced impressive responsive rates in the range of 20%–40% in the metastatic setting [1], [2]. However, clinical benefit has not been observed for many patients. For this reason, identifying optimal biomarkers for response to anti‐PD‐1/PD‐L1 therapies in NSCLC is critical in order to select patients who will respond to checkpoint blockade while limiting therapy that would be ineffective or produce adverse reactions.
Circulating tumor DNA can be actively released into circulation or shed after tumor cells outgrow their blood supply, become hypoxic, and undergo apoptosis or necrosis [3]. The goals of circulating tumor DNA (ctDNA) monitoring are to capture genetic heterogeneity, identify targetable mutations, and monitor tumor evolution in real time [4]. Studies in multiple tumor types have demonstrated high concordance for hotspot mutations between paired tissue and ctDNA biopsies [5], [6], [7], [8], [9]. Concordance over more extensive DNA sequencing regions has been shown to be high across all mutations (∼91%–94%) but lower (∼11%–22%) when genomic alterations were detected in either tissue or blood [10], [11], [12].
Identifying prognostic and predictive biomarkers for the efficient application of immune checkpoint blockade in NSCLC remains a challenge because of the complexity of the tumor microenvironment. Existing biomarkers, including PD‐L1 immunohistochemistry, tumor lymphocyte infiltration, and gene expression assays, all have limitations with respect to predictive value, sensitivity, and/or widespread clinical feasibility [13], [14]. Given the responses seen in mutagenic histologies associated with smoking (NSCLC) and ultraviolet radiation (melanoma), tissue tumor mutational burden (TMB) has emerged as a potential marker of response to immune checkpoint blockade [15], [16].
Tissue TMB by next‐generation sequencing (NGS) has been associated with genomic instability and potential neoantigen binding sites for cytotoxic T cells. Neoantigens arise as a result of tumor‐specific mutations, which are absent from the normal human genome [17], [18]. Although challenges exist for neoantigen prediction, TMB may serve as an indirect, probabilistic measure of immunogenicity. Previous research has shown that higher nonsynonymous mutation burden using tissue whole‐exome sequencing was associated with objective response and progression‐free survival (PFS) in patients with NSCLC treated with pembrolizumab, patients with melanoma treated with PD‐1 and cytotoxic T lymphocyte‐associated antigen‐4 blockade, and atezolizumab in urothelial carcinoma [19], [20], [21], [22], [23]. The predictive accuracy of mutational burden has also been reported using comprehensive genomic profiling (CGP) in NSCLC [24], [25].
The importance of establishing noninvasive biomarkers for response to immune checkpoint blockade is critical. Here, we correlated ctDNA TMB with clinical variables, DNA repair mutations, mutant allele frequency (MAF), and clinical response to anti‐PD‐1/PD‐L1 therapy. The goals of this study were to evaluate this novel biomarker and report on the landscape and clinical utility of ctDNA TMB in NSCLC.
Materials and Methods
Patient Selection and Study Design
The Institutional Review Board (IRB) of Northwestern University Feinberg School of Medicine approved the study. Informed consent from patients was waived per the IRB for this retrospective review of molecular analyses. Studies were performed in concordance with the Health Insurance Portability and Accountability Act and the Declaration of Helsinki. The cohort consisted of 136 consecutive patients treated at the Robert H. Lurie Comprehensive Cancer Center of Northwestern University, with NSCLC identified retrospectively with commercial ctDNA NGS testing by Guardant360 (Guardant Health; Redwood City, CA) between 2015 and 2016.
In addition, overall response rate (ORR), PFS, and overall survival (OS) were determined for 20 patients who were treated with anti‐PD‐1/PD‐L1 therapies who had ctDNA before first‐line therapy or within 90 days of therapy initiation. Furthermore, a validation cohort was obtained from the University of Miami that consisted of 22 patients with ctDNA treated with immune checkpoint blockade, of which 12 patients had ctDNA collection within the 90‐day time frame. Baseline tumor burden prior to initiation of checkpoint blockade was estimated using RECIST version 1.1. Clinical response rates were determined using RECIST version 1.1 and immune‐related (ir) RECIST [26], [27].
Next‐Generation Sequencing
All patients had NGS testing performed by Guardant360. Samples that were received from February 5, 2015, to October 5, 2015, were tested on a 68‐gene panel, whereas samples received from October 6, 2015, through October 16, 2016, were tested on a 70‐gene panel. Both tests sequenced approximately 138,000 base pairs of DNA. Two 10‐mL blood samples were collected in Streck tubes (La Vista, NE). A single 10‐mL sample was processed for plasma isolation with ctDNA extraction using a Qiagen circulating nucleic acid kit. DNA then underwent oligonucleotide barcoding for digital sequencing library preparation. Sequencing was performed using the Illumina HiSeq 2500 (San Diego, CA) with approximately 15,000 times average coverage depth, followed by reconstruction of the cell‐free DNA (cfDNA) using the digitized signals and proprietary bioinformatics [28]. Clinical sensitivity was approximately 85% and specificity was >99% [28], [29].
ctDNA Tumor Mutational Burden Definition
ctDNA TMB was defined as the number of detected mutations over the region of sequenced ctDNA. ctDNA TMB was calculated for patients using coding base substitutions and indel alterations both including and excluding potentially functional variants. Rearrangements, fusions, and copy number variants were excluded. The Guardant360 assay is not currently clinically validated to determine TMB, and the analyses presented here were for research purposes only. TMB was calculated in mutations per megabase in three different ways: variants of unknown significance (VUS) and synonymous mutations (method 1); nonsynonymous potentially functional variants and VUS (method 2); and using all detected mutations including nonsynonymous potentially functional variants, VUS, and synonymous mutations (method 3) (Fig. 1A). Genomic alterations were further classified into direct and indirect DNA repair mutations (supplemental online Table 7) [30].
Figure 1.

Circulating tumor DNA TMB landscape. (A): Schematic demonstrating the three methods of calculating TMB: excluding nonsynonymous potentially functional variants (method 1), excluding synonymous variants (method 2), and including using all detected mutations (method 3). (B): Demonstrates the landscape of TMB scores in the population based on including all detected mutations (method 1).
Abbreviations: MBp, megabase pairs; TMB, tumor mutational burden; VUS, variants of unknown significance.
Statistical Analysis
Two‐sample t tests and chi‐squared tests were used to test the association of TMB with clinical or DNA repair mutation variables. Univariate and multivariate regression were performed to assess the significance of predictors on survival status. PFS and OS were assessed by Kaplan‐Meier estimation based on immunotherapy start date, with patients censored on January 18, 2017, at progression or last follow‐up for PFS, and death or last follow‐up for OS. Log‐rank tests and Cox proportional hazards regression were performed to compare survival distributions based on TMB low (below the median) and TMB high (above the median). Median TMB score varied based on each TMB definition. The association between ctDNA TMB and MAF was measured via linear correlation coefficients. All analyses were performed using R version 3.3.1 and installed packages.
Results
Patient Characteristics
Table 1 shows the characteristics of the 136 patients included in the study. The characteristics for the subset of patients (n = 20) treated with immune checkpoint blockade are included in Supplemental online Table 1.
Table 1. Clinical characteristics of 136 patients with non‐small cell lung cancer with circulating tumor DNA testing.
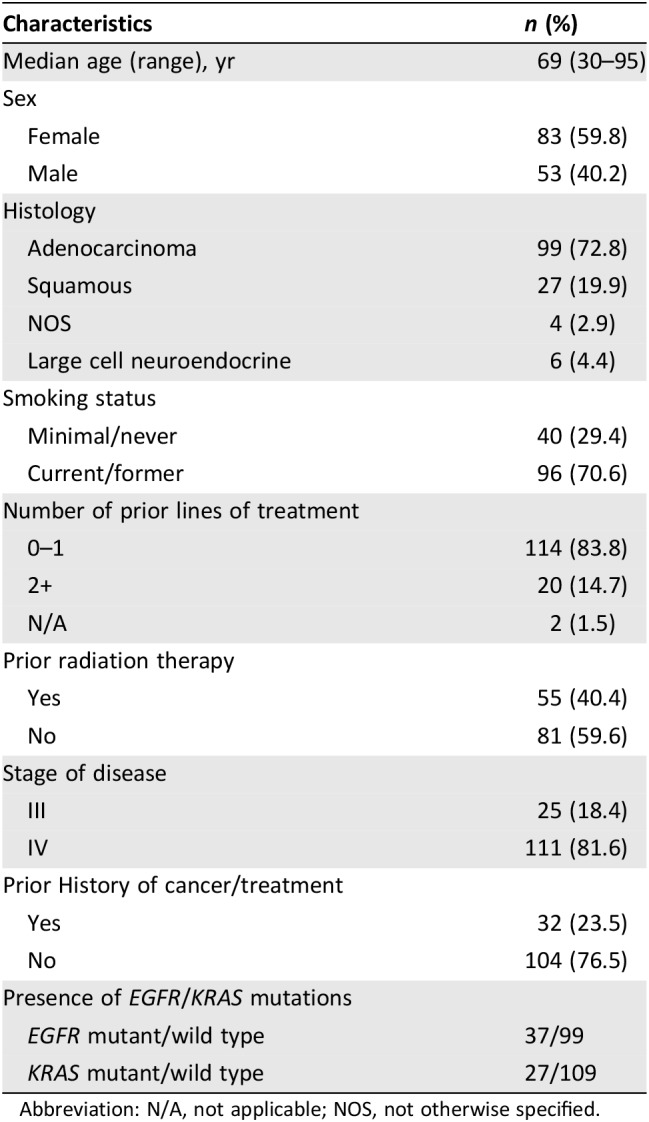
Abbreviation: N/A, not applicable; NOS, not otherwise specified.
ctDNA TMB
Samples with ctDNA TMB of 0 varied based on each definition [method 1 (n = 39, 28.7%), method 2 (n = 26, 19.1%), and method 3 (n = 18, 13.2%)]. Reported analyses included method 1 (VUS and synonymous mutations), unless otherwise specified. When excluding samples with no detected mutations, median TMB in mutations per megabase pairs (MBp) was 14.5, 7.2, and 21.7 for methods 1, 2, and 3, respectively. The landscape of ctDNA TMB scores in our sample is shown in Figure 1B.
Association of TMB with Patient Characteristics
The sample was stratified based on TMB below and above the median, both including and excluding 0 ctDNA TMB scores (Table 2 and supplemental online Tables 2–4). For method 1, ctDNA TMB was significantly associated with age (p < .005, two‐sample t test) and smoking history (p < .05, chi‐squared test) for the entire sample (n = 136; Table 2). Sex, tumor histology, stage of disease at sample collection, prior lines of treatment, prior radiation therapy, and mutations in either EGFR or KRAS did not correlate with TMB score.
Table 2. TMB association with clinical variables and DNA repair mutations.
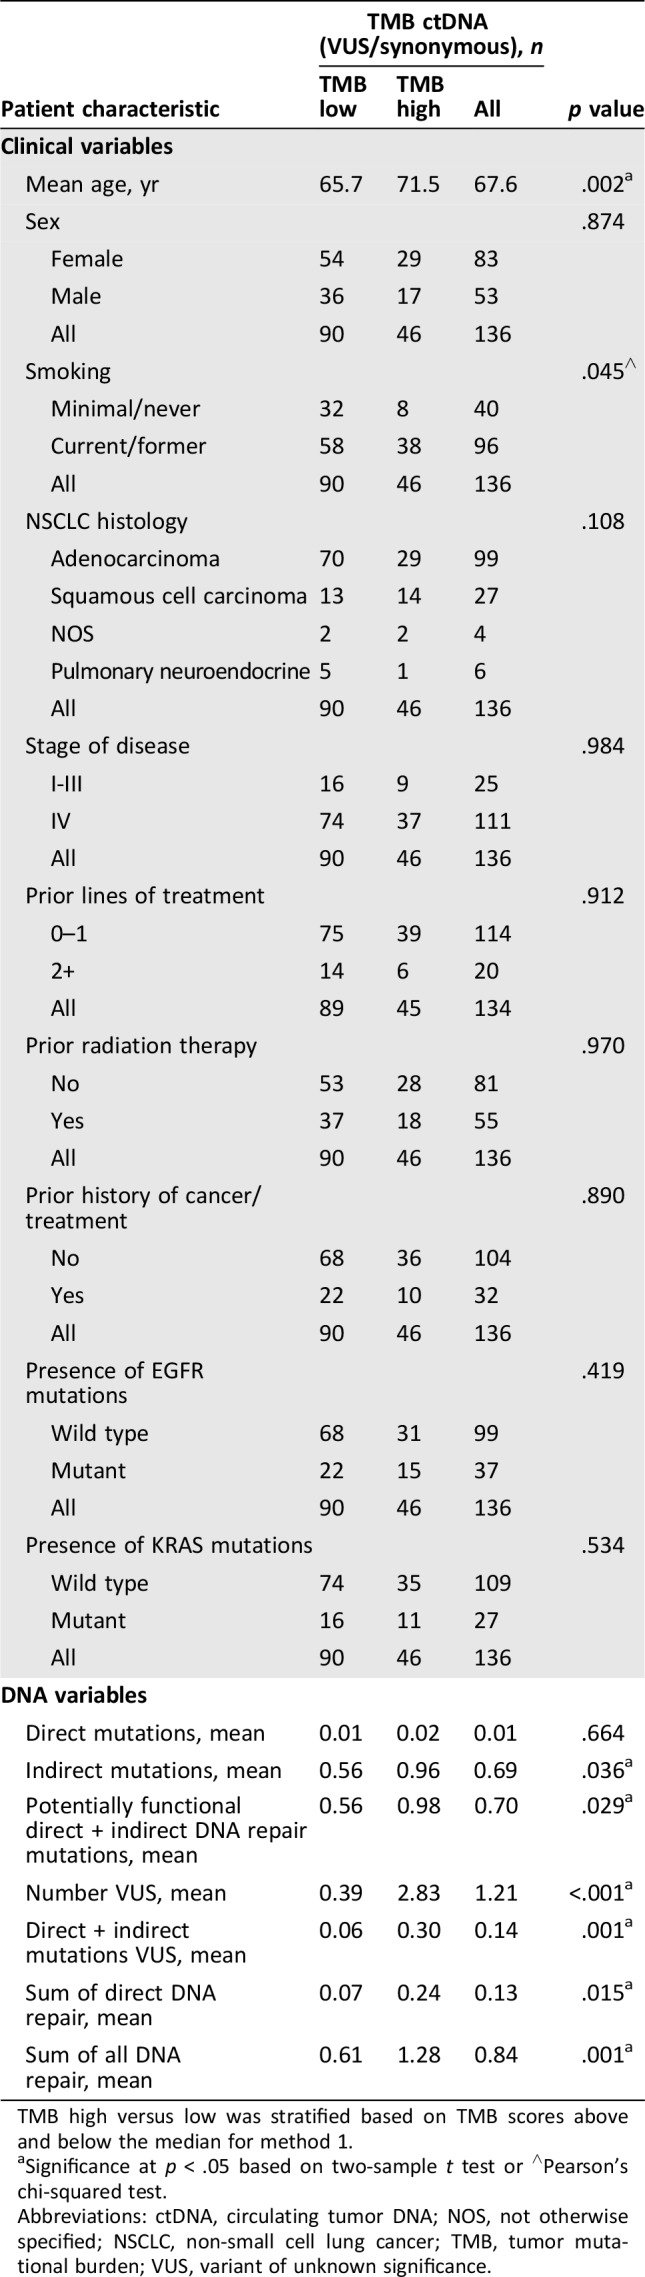
TMB high versus low was stratified based on TMB scores above and below the median for method 1.
Significance at p < .05 based on two‐sample t test or ∧Pearson's chi‐squared test.
Abbreviations: ctDNA, circulating tumor DNA; NOS, not otherwise specified; NSCLC, non‐small cell lung cancer; TMB, tumor mutational burden; VUS, variant of unknown significance.
Association of TMB with DNA Repair Mutations
Direct DNA repair mutations were rare in the cohort, with only two potentially functional variants (ATM and BRCA1) and 16 VUS, including mutations in ATM, BRCA1, BRCA2, and MLH1. For method 1 including 0 ctDNA TMB, ctDNA TMB was significantly correlated with potentially functional direct and indirect DNA repair mutations (p < .05, two‐sample t test) and the sum of all DNA repair mutations (p < .005; Table 2). The majority of DNA repair mutations were part of the homologous recombination and Fanconi anemia pathways with two DNA mismatch repair mutations detected. To ensure that a greater number of total mutations, as opposed to DNA repair mutations, did not confound this result, we performed additional analyses. Specifically, we eliminated both direct and indirect DNA repair mutations as counting toward the total TMB score. We then compared TMB scores from samples with a DNA repair mutation, but excluding the variants from the result, with samples without DNA repair mutations. Mean ctDNA TMB was 21.7 versus 7.4 for patients without direct DNA repair mutations (p = .018, two‐sample t test). Similarly, the result was the same when excluding the direct and indirect alterations with mean ctDNA TMB of 13.7 versus 7.4 without DNA repair mutations (p = .005, two‐sample t test).
Survival Analysis for Patients Treated with Immune Checkpoint Blockade
ctDNA TMB high was associated with significantly shorter PFS (45 vs. 355 days; hazard ratio [HR], 5.6; 95% confidence interval [CI], 1.3–24.6; p < .01; Fig. 2A). Similarly, higher TMB was associated with significantly shorter OS (106 days vs. not reached; HR, 6.0; 95% CI, 1.3–27.1; p < .01; Fig. 2B). Findings were also significant using method 2 for TMB calculation (supplemental online Table 5). When eliminating two samples with ctDNA collected after initiation of checkpoint blockade, TMB high was also associated with significantly shorter PFS and OS. Using RECIST 1.1, there was 1 partial response (PR), 10 stable disease (SD), and 9 progressive disease (PD). Using irRECIST, there were 13 ir‐SD and 7 ir‐PD. In the validation cohort, there was no significant association between ctDNA TMB and PFS (65 vs. 64 days; HR, 1.1; 95% CI, 0.31–4.2; p > .05). Based on TMB scores above and below the median, higher ctDNA TMB was associated with numerically, but not statistically shorter, OS (236 vs. 511 days; HR, 2.8; 95% CI, 0.56–14.4; p = .17; Fig. 2C, 2D). When including only patients with ctDNA collected prior to initiation of immune checkpoint blockade (n = 27), ctDNA TMB was similarly associated with shorter PFS and OS (supplemental online Fig. 1).
Figure 2.

Survival curves including progression‐free survival (PFS) and overall survival (OS) based on circulating tumor DNA (ctDNA) tumor mutational burden (TMB) for patients treated with immune checkpoint blockade. ctDNA TMB was associated with significantly shorter PFS (45 vs. 355 days; HR, 5.6; 95% CI, 1.3–24.6; p < .01) and OS (106 days vs. not reached; HR, 6.0; 95% CI, 1.3–27.1; p < .01) based on TMB high (red curves) vs. low (blue curves) (A, B). In the validation cohort, ctDNA TMB was not associated with PFS (65 vs. 64 days; HR, 1.1; 95% CI, 0.31–4.2; p > .05) with a numerically shorter, but nonsignificant, OS difference (236 vs. 511 days; HR, 2.8; 95% CI, 0.56–14.4; p = .17) (C, D). Proportional hazards regression model and stratified log ranks tests were performed. Kaplan‐Meier estimation compared survival distributions based on TMB low versus TMB high.
Abbreviations: CI, confidence interval; HR, hazard ratio.
Association Between MAF and Survival Outcomes
MAF, a measure of the highest frequency clone, was further correlated with PFS and OS for patients treated with immune checkpoint blockade (n = 20) to better understand why patients with high ctDNA TMB had worse OS. Patients with high MAF (above the median) had significantly worse PFS (51 vs. 355 days; HR, 6.2; 95% CI, 1.6–24.1; p < .01) and OS (135 days vs. not reached; HR, 6.1; 95% CI, 1.6–23.7; p < .01; Fig. 3A, 3B). In the validation cohort, higher MAF was associated with significantly shorter OS (236 vs. 595 days; HR, 7.7; 95% CI, 1.2–49.1; p < .05), but not PFS (44 vs. 114 days; HR, 2.3; 95% CI, 0.58–8.8; p = .21; Fig. 3C, 3D). In univariate regression, MAF high versus low based on median across the cohort was significant (HR, 3.8; p = .001; Table 3). Multivariate regression retained significance when including TMB high versus low and MAF high versus low for all samples.
Figure 3.

Survival curves including progression‐free survival (PFS) and overall survival (OS) based on mutant allele frequency (MAF) for patients treated with immune checkpoint blockade. MAF was significantly correlated with shorter PFS (51 vs. 355 days; HR, 6.2; 95% CI, 1.6–24.1; p < .01) and OS (135 days vs. not reached; HR, 6.1; 95% CI, 1.6–23.7; p < .01) (A, B) based on MAF high (red curves) vs. low (blue curves). In the validation cohort, MAF was not associated with PFS (44 vs 114 days; HR, 2.3; 95% CI, 0.58–8.8; p = .21), but did predict shorter OS (236 vs. 595 days; HR, 7.7; 95% CI, 1.2–49.1 p < .05) (C, D). Proportional hazards regression model and stratified log ranks tests were performed. Kaplan‐Meier estimation compared survival distributions based on TMB low versus TMB high.
Abbreviations: CI, confidence interval; HR, hazard ratio.
Table 3. Univariate and multivariate regression analyses.

Circulating tumor DNA TMB and MAF scores were included based on low (below the median) and high (above the median) and as continuous variables. Samples without detected mutations were excluded from this analysis unless specified.
Indicates significance based on p < 0.05.
Abbreviations: CI, confidence interval; ECOG, Eastern Cooperative Oncology Group; HR, hazard ratio; MAF, mutant allele frequency; TMB, tumor mutational burden.
Interaction Among TMB, MAF, and Tumor Burden
Correlation between ctDNA TMB and MAF was low but significant (r = .20, p < .06; supplemental online Fig. 2). When examining the subset of patients treated with immune checkpoint blockade (n = 20), a stronger significant correlation existed (r = .65, p < .005; supplemental online Table 6 and supplemental online Fig. 3). Based on tumor burden estimations using baseline RECIST 1.1 for n = 20, there was a significant correlation between RECIST score and MAF (r = .58, p = .007). However, RECIST score was not significantly correlated with ctDNA TMB (r = .09, p = .19).
Discussion
Biomarkers to predict response to anti‐PD‐1/PD‐L1 therapy are critical in order to identify patients who will benefit from immune checkpoint blockade. Current biomarkers including tissue TMB, degree of PD‐L1 positivity, and lymphocyte infiltration in the tumor microenvironment require access to tissue. Given the technical challenges of obtaining adequate tissue and complication rates associated with serial biopsies in NSCLC, exploring noninvasive biomarkers is critical [31].
In terms of clinical predictors of ctDNA TMB, sex, tissue histology, tumor stage at sample collection, and prior lines of treatment were not significantly associated with TMB. Smoking history was significantly associated with higher ctDNA TMB. Although not statistically significant across all TMB determinations, we hypothesize that this was limited by sequencing length and number of mutations in ctDNA TMB when excluding various subsets of genomic alterations. In tissue, smoking has also been associated with tissue TMB in prior studies [15], [32]. However, we did not find a predominance of C>A substitutions, which previous studies have reported more frequently in patients with NSCLC with a smoking history, and therefore the association between ctDNA TMB and smoking should be viewed as preliminary [15]. Previous research has demonstrated that detection of ctDNA was positively associated with stage of disease [33]. In contrast, we did not find a relation between ctDNA TMB and stage of disease, which may have been limited by the predominance of patients with stage IV disease in the sample (81.6%).
In contrast to prior studies examining tissue TMB, higher ctDNA TMB was correlated with significantly shorter PFS and OS in our testing sample. Our study demonstrated significance across all samples, as well as the subset when only including ctDNA collection prior to immune checkpoint blockade initiation. In our small validation cohort, higher ctDNA TMB had a nonsignificant trend toward shorter OS but not PFS. Using tissue NGS, several studies have demonstrated that higher TMB was associated with prolonged survival for patients treated with immune checkpoint blockade across multiple tumor types [19], [21], [22]. The mechanistic hypothesis is that more mutations may predict a greater number of neoantigens and an inflamed tumor microenvironment with influx of peripheral cytotoxic T lymphocytes. However, the biology of ctDNA TMB can be quite different, as ctDNA is only detectable when tumors shed ctDNA into the blood. Previous studies have indicated that quantity of ctDNA may indicate more advanced disease and higher overall tumor burden [33], [34]. In addition, higher ctDNA mutational load has been associated with shorter time to progression for conventional treatment in metastatic breast cancer [35]. Therefore, ctDNA TMB may reflect greater tumor burden, in itself, as opposed to neoantigen sites for cytotoxic effector T cells. We have previously found a low correlation between tissue TMB and ctDNA TMB in paired patient samples, understanding the limitations of comparing across sequencing techniques, which may suggest that these biomarkers are differential predictors [36]. A prior study reported that hypermutated ctDNA was associated with response to immune checkpoint blockade in a cohort of multiple tumor types that included 19 of 69 patients with NSCLC [37]. This cohort was different in that tumor type was imbalanced between the low and high mutation groups, with the low mutation group including 18 patients with NSCLC and the hypermutated cohort including 1 patient with NSCLC. Further research is necessary to better understand whether ctDNA TMB correlates with neoantigen burden in tissue and an inflamed tumor microenvironment.
Prior research has associated high MAF (>5%) with shorter OS across a variety of advanced solid tumors, including brain, lung, breast, and gastrointestinal, independent of intervening treatment [5]. Other studies have also demonstrated the prognostic value of ctDNA MAF and that early changes in ctDNA levels can predict response to chemotherapy [33], [38], [39], [40], [41], [42]. Furthermore, early evidence suggests that MAF may serve as a dynamic biomarker, with early responders to durvalumab demonstrating a decrease in MAF after initiation of therapy [43]. These studies have hypothesized that ctDNA MAF may reflect tumor burden and have a potential role for real‐time monitoring for patients treated with targeted therapies or immune checkpoint blockade [44], [45]. In addition, a recent study demonstrated that an imbalance between circulating exhausted‐phenotype CD8+ T cells in blood and tumor burden in melanoma was an important predictor of response to immune checkpoint blockade [46]. The study indicated that lack of clinical benefit was associated with an inadequate immune response due to high tumor burden. Further research has shown an association between ctDNA MAF and volumetric measurements of tumor burden [34]. These studies suggest a mechanistic explanation for our findings demonstrating ctDNA TMB and MAF as prognostic markers for shorter OS.
Our data and prior studies indicate that tumor burden was associated with greater tumor heterogeneity [47]. In patients with higher tumor burden, it is likely that more ctDNA is shed into the blood, and therefore a greater quantity of ctDNA is detected. ctDNA mutation load may be more reflective of intratumoral heterogeneity to better reflect the entire landscape of TMB, which is an inherent limitation of tissue biopsies. Multiple prior studies have demonstrated mutational subclonality as a biomarker associated with poor survival [48], [49]. We hypothesize that a greater degree of heterogeneity in ctDNA TMB (e.g., higher TMB) reflects larger tumor volume as reflected quantitatively by MAF, indicating poor prognosis for patients treated with immune checkpoint blockade. Furthermore, tumors with similar MAF may have different TMB as a reflection of tumor heterogeneity, which has important implications in clinical practice and treatment planning. Our findings are in contrast to recently reported prospective data from B‐F1RST in patients with NSCLC treated with atezolizumab [50]. In this study, higher ORR was associated with higher blood TMB score. Important differences in this trial included that 394 genes (∼1.1Mb) were sequenced in the ctDNA panel and that base substitutions at allele frequencies less than 0.5% were not included. In addition, a recent paper in metastatic gastric cancer demonstrated that higher ctDNA TMB predicted better response in a small cohort of predominantly microsatellite instability‐high patients, which are extremely rare in patients with NSCLC and not observed in our cohort [51].
To our knowledge, this is one of the first studies to examine ctDNA TMB as a biomarker in patients with NSCLC using a commercially available assay. There were several limitations of our study. First, the sequencing length of the ctDNA used in our study was relatively short and therefore may not be reflective of the somatic mutation rate of the tissue cancer genome when estimating ctDNA TMB. In particular, prior work has demonstrated that using tissue TMB, variance in TMB measurement increases significantly at lengths of DNA sequencing less than 0.5 Mb [52]. Second, our findings only reflect ctDNA TMB for a single commercially available platform, and therefore the technical specifications of the assay to detect genomic alterations in blood may not be reflective of other ctDNA platforms. Third, the sample size for our survival analyses examining ctDNA TMB as a predictor for response to checkpoint blockade was small. Fourth, we combined several anti‐PD‐1/PD‐L1 therapies in our analyses, and further studies should explore each anti‐PD‐1/PD‐L1 antibody separately in a larger cohort.
In conclusion, our findings demonstrated the feasibility of determining ctDNA TMB in patients with NSCLC. Interestingly, in contrast to tissue, our analyses indicated that higher ctDNA TMB was associated with shorter PFS and OS for patients treated with immune checkpoint blockade, which was likely mediated by higher tumor burden. An alternative hypothesis is that ctDNA has limitations with respect to a smaller footprint of DNA sequenced compared with tissue CGP. Prospective studies are necessary to explore longer ctDNA sequencing lengths with a greater number of mutations to assess concordance with tissue TMB. This study indicates the potential to use both ctDNA TMB and blood‐based MAF as noninvasive prognostic biomarkers to reflect both blood hypermutation and tumor heterogeneity as markers for response to immune checkpoint blockade in NSCLC.
See http://www.TheOncologist.com for supplemental material available online.
Contributed equally.
Contributor Information
Young Kwang Chae, Email: young.chae@northwestern.edu.
Andrew A. Davis, Email: andrew-davis@northwestern.edu.
Author Contributions
Conception/design: Young Kwang Chae, Andrew A. Davis, Francis J. Giles
Provision of study material or patients: Young Kwang Chae, Andrew A. Davis, Sarita Agte, Alan Pan, Nicholas I. Simon, Wade T. Iams, Marcelo R. Cruz, Keerthi Tamragouri, Kyunghoon Rhee, Nisha Mohindra, Victoria Villaflor, Wungki Park, Gilberto Lopes, Francis J. Giles
Data analysis and interpretation: Young Kwang Chae, Andrew A. Davis, Alan Pan, Kyunghoon Rhee, Francis J. Giles
Manuscript writing: Young Kwang Chae, Andrew A. Davis
Final approval of manuscript: Young Kwang Chae, Andrew A. Davis, Sarita Agte, Alan Pan, Nicholas I. Simon, Wade T. Iams, Marcelo R. Cruz, Keerthi Tamragouri, Kyunghoon Rhee, Nisha Mohindra, Victoria Villaflor, Wungki Park, Gilberto Lopes, Francis J. Giles
Disclosures
Young Kwang Chae: AstraZeneca, Foundation Medicine, Genentech, Counsyl, Takeda, Guardant Health, Biodesix, Immuneoncia (C/A), Bristol‐Myers Squibb, Abbvie (RF). The other authors indicated no financial relationships.
(C/A) Consulting/advisory relationship; (RF) Research funding; (E) Employment; (ET) Expert testimony; (H) Honoraria received; (OI) Ownership interests; (IP) Intellectual property rights/inventor/patent holder; (SAB) Scientific advisory board
References
- 1.Brahmer JR, Tykodi SS, Chow LQ et al. Safety and activity of anti‐PD‐L1 antibody in patients with advanced cancer. N Engl J Med 2012;366:2455–2465. [DOI] [PMC free article] [PubMed] [Google Scholar]
- 2.Topalian SL, Hodi FS, Brahmer JR et al. Safety, activity, and immune correlates of anti‐PD‐1 antibody in cancer. N Engl J Med 2012;366:2443–2454. [DOI] [PMC free article] [PubMed] [Google Scholar]
- 3.Jahr S, Hentze H, Englisch S et al. DNA fragments in the blood plasma of cancer patients: Quantitations and evidence for their origin from apoptotic and necrotic cells. Cancer Res 2001;61:1659–1665. [PubMed] [Google Scholar]
- 4.Murtaza M, Dawson SJ, Tsui DW et al. Non‐invasive analysis of acquired resistance to cancer therapy by sequencing of plasma DNA. Nature 2013;497:108–112. [DOI] [PubMed] [Google Scholar]
- 5.Schwaederle M, Husain H, Fanta PT, et al. Use of liquid biopsies in clinical oncology: Pilot experience in 168 patients. Clin Cancer Res 2016;22:5497–5505. [DOI] [PubMed] [Google Scholar]
- 6.Zill OA, Greene C, Sebisanovic D et al. Cell‐free DNA next‐generation sequencing in pancreatobiliary carcinomas. Cancer Discov 2015;5:1040–1048. [DOI] [PMC free article] [PubMed] [Google Scholar]
- 7.Mok T, Wu YL, Lee JS et al. Detection and dynamic changes of EGFR mutations from circulating tumor DNA as a predictor of survival outcomes in NSCLC patients treated with first‐line intercalated erlotinib and chemotherapy. Clin Cancer Res 2015;21:3196–3203. [DOI] [PubMed] [Google Scholar]
- 8.Kim ST, Lee WS, Lanman RB et al. Prospective blinded study of somatic mutation detection in cell‐free DNA utilizing a targeted 54‐gene next generation sequencing panel in metastatic solid tumor patients. Oncotarget 2015;6:40360–40369. [DOI] [PMC free article] [PubMed] [Google Scholar]
- 9.Thompson JC, Yee SS, Troxel AB et al. Detection of therapeutically targetable driver and resistance mutations in lung cancer patients by next‐generation sequencing of cell‐free circulating tumor DNA. Clin Cancer Res 2016;22:5772–5782. [DOI] [PMC free article] [PubMed] [Google Scholar]
- 10.Chae YK, Davis AA, Carneiro BA et al. Concordance between genomic alterations assessed by next‐generation sequencing in tumor tissue or circulating cell‐free DNA. Oncotarget 2016;7:65364–65373. [DOI] [PMC free article] [PubMed] [Google Scholar]
- 11.Kuderer NM, Burton KA, Blau S et al. Comparison of 2 commercially available next‐generation sequencing platforms in oncology. JAMA Oncol 2016;3:996–998. [DOI] [PMC free article] [PubMed] [Google Scholar]
- 12.Chae YK, Davis AA, Jain S et al. Concordance of genomic alterations by next‐generation sequencing in tumor tissue versus circulating tumor DNA in breast cancer. Mol Cancer Ther 2017;16:1412–1420. [DOI] [PubMed] [Google Scholar]
- 13.Chae YK, Pan A, Davis AA et al. Biomarkers for PD‐1/PD‐L1 blockade therapy in non‐small‐cell lung cancer: Is PD‐L1 expression a good marker for patient selection? Clin Lung Cancer 2016;17:350–361. [DOI] [PubMed] [Google Scholar]
- 14.Yuan J, Hegde PS, Clynes R et al. Novel technologies and emerging biomarkers for personalized cancer immunotherapy. J Immunother Cancer 2016;4:3. [DOI] [PMC free article] [PubMed] [Google Scholar]
- 15.Govindan R, Ding L, Griffith M et al. Genomic landscape of non‐small cell lung cancer in smokers and never‐smokers. Cell 2012;150:1121–1134. [DOI] [PMC free article] [PubMed] [Google Scholar]
- 16.Berger MF, Hodis E, Heffernan TP et al. Melanoma genome sequencing reveals frequent PREX2 mutations. Nature 2012;485:502–506. [DOI] [PMC free article] [PubMed] [Google Scholar]
- 17.Schumacher TN and Schreiber RD. Neoantigens in cancer immunotherapy. Science 2015;348:69–74. [DOI] [PubMed] [Google Scholar]
- 18.Brown SD, Warren RL, Gibb EA et al. Neo‐antigens predicted by tumor genome meta‐analysis correlate with increased patient survival. Genome Res 2014;24:743–750. [DOI] [PMC free article] [PubMed] [Google Scholar]
- 19.Rizvi NA, Hellmann MD, Snyder A et al. Cancer immunology. Mutational landscape determines sensitivity to PD‐1 blockade in non‐small cell lung cancer. Science 2015;348:124–128. [DOI] [PMC free article] [PubMed] [Google Scholar]
- 20.Johnson DB, Frampton GM, Rioth MJ et al. Targeted next generation sequencing identifies markers of response to PD‐1 blockade. Cancer Immunol Res 2016;4:959–967. [DOI] [PMC free article] [PubMed] [Google Scholar]
- 21.Snyder A, Makarov V, Merghoub T et al. Genetic basis for clinical response to CTLA‐4 blockade in melanoma. N Engl J Med 2014;371:2189–2199. [DOI] [PMC free article] [PubMed] [Google Scholar]
- 22.Rosenberg JE, Hoffman‐Censits J, Powles T et al. Atezolizumab in patients with locally advanced and metastatic urothelial carcinoma who have progressed following treatment with platinum‐based chemotherapy: A single‐arm, multicentre, phase 2 trial. Lancet 2016;387:1909–1920. [DOI] [PMC free article] [PubMed] [Google Scholar]
- 23.Van Allen EM, Miao D, Schilling B et al. Genomic correlates of response to CTLA‐4 blockade in metastatic melanoma. Science 2015;350:207–211. [DOI] [PMC free article] [PubMed] [Google Scholar]
- 24.Campesato LF, Barroso‐Sousa R, Jimenez L et al. Comprehensive cancer‐gene panels can be used to estimate mutational load and predict clinical benefit to PD‐1 blockade in clinical practice. Oncotarget 2015;6:34221–34227. [DOI] [PMC free article] [PubMed] [Google Scholar]
- 25.Davis AA, Chae YK, Agte S et al. Association of tumor mutational burden (TMB) with DNA repair mutations and response to anti‐PD‐1/PD‐L1 therapy in non‐small cell lung cancer (NSCLC). Poster presented at: Annual Meeting of the American Association of Cancer Research, Washington, DC, 1–5 April 2017.
- 26.Eisenhauer EA, Therasse P, Bogaerts J et al. New response evaluation criteria in solid tumours: Revised RECIST guideline (version 1.1). Eur J Cancer 2009;45:228–247. [DOI] [PubMed] [Google Scholar]
- 27.Wolchok JD, Hoos A, O'Day S et al. Guidelines for the evaluation of immune therapy activity in solid tumors: Immune‐related response criteria. Clin Cancer Res 2009;15:7412–7420. [DOI] [PubMed] [Google Scholar]
- 28.Odegaard JI, Vincent JJ, Mortimer S et al. Validation of a plasma‐based comprehensive cancer genotyping assay utilizing orthogonal tissue‐ and plasma‐based methodologies. Clin Cancer Res 2018;24:3539–3549. [DOI] [PubMed] [Google Scholar]
- 29.Lanman RB, Mortimer SA, Zill OA et al. Analytical and clinical validation of a digital sequencing panel for quantitative, highly accurate evaluation of cell‐free circulating tumor DNA. PLoS One 2015;10:e0140712. [DOI] [PMC free article] [PubMed] [Google Scholar]
- 30.Chae YK, Anker JF, Carneiro BA et al. Genomic landscape of DNA repair genes in cancer. Oncotarget 2016;7:23312–23321. [DOI] [PMC free article] [PubMed] [Google Scholar]
- 31.Overman MJ, Modak J, Kopetz S et al. Use of research biopsies in clinical trials: Are risks and benefits adequately discussed? J Clin Oncol 2013;31:17–22. [DOI] [PMC free article] [PubMed] [Google Scholar]
- 32.Alexandrov LB, Nik‐Zainal S, Wedge DC et al. Signatures of mutational processes in human cancer. Nature 2013;500:415–421. [DOI] [PMC free article] [PubMed] [Google Scholar]
- 33.Bettegowda C, Sausen M, Leary RJ et al. Detection of circulating tumor DNA in early‐ and late‐stage human malignancies. Sci Transl Med 2014;6:224ra224. [DOI] [PMC free article] [PubMed] [Google Scholar]
- 34.Parkinson CA, Gale D, Piskorz AM et al. Exploratory analysis of TP53 mutations in circulating tumour DNA as biomarkers of treatment response for patients with relapsed high‐grade serous ovarian carcinoma: A retrospective study. PLoS Med 2016;13:e1002198. [DOI] [PMC free article] [PubMed] [Google Scholar]
- 35.Maxwell KN, Soucier‐Ernst D, Tahirovic E et al. Comparative clinical utility of tumor genomic testing and cell‐free DNA in metastatic breast cancer. Breast Cancer Res Treat 2017;164:627–638. [DOI] [PMC free article] [PubMed] [Google Scholar]
- 36.Davis AA, Chae YK, Agte S et al. Comparison of tumor mutational burden (TMB) across tumor tissue and circulating tumor DNA (ctDNA). J Clin Oncol 2017;35(suppl 15):e23028. [Google Scholar]
- 37.Khagi Y, Goodman AM, Daniels GA et al. Hypermutated circulating tumor DNA: Correlation with response to checkpoint inhibitor‐based immunotherapy. Clin Cancer Res 2017;23:5729–5736. [DOI] [PMC free article] [PubMed] [Google Scholar]
- 38.Diehl F, Schmidt K, Choti MA et al. Circulating mutant DNA to assess tumor dynamics. Nat Med 2008;14:985–990. [DOI] [PMC free article] [PubMed] [Google Scholar]
- 39.Spindler KL, Pallisgaard N, Vogelius I et al. Quantitative cell‐free DNA, KRAS, and BRAF mutations in plasma from patients with metastatic colorectal cancer during treatment with cetuximab and irinotecan. Clin Cancer Res 2012;18:1177–1185. [DOI] [PubMed] [Google Scholar]
- 40.Zhu YJ, Zhang HB, Liu YH et al. Estimation of cell‐free circulating EGFR mutation concentration predicts outcomes in nsclc patients treated with EGFR‐TKIs. Oncotarget 2017;8:13195–13205. [DOI] [PMC free article] [PubMed] [Google Scholar]
- 41.Pietrasz D, Pécuchet N, Garlan F et al. Plasma circulating tumor DNA in pancreatic cancer patients is a prognostic marker. Clin Cancer Res 2017;23:116–123. [DOI] [PubMed] [Google Scholar]
- 42.Tie J, Kinde I, Wang Y et al. Circulating tumor DNA as an early marker of therapeutic response in patients with metastatic colorectal cancer. Ann Oncol 2015;26:1715–1722. [DOI] [PMC free article] [PubMed] [Google Scholar]
- 43.Kuziora A. Circulating tumor DNA (ctDNA) variant allele frequencies are reduced in responders to durvalumab and low baseline variant allele frequencies are associated with improved overall survival in NSCLC patients. Abstract presented in: Proceedings of the 107th Annual Meeting of the American Association for Cancer Research, Washington, DC, 1–5 April 2017; 582.
- 44.Lipson EJ, Velculescu VE, Pritchard TS et al. Circulating tumor DNA analysis as a real‐time method for monitoring tumor burden in melanoma patients undergoing treatment with immune checkpoint blockade. J Immunother Cancer 2014;2:42. [DOI] [PMC free article] [PubMed] [Google Scholar]
- 45.Gray ES, Rizos H, Reid AL et al. Circulating tumor DNA to monitor treatment response and detect acquired resistance in patients with metastatic melanoma. Oncotarget 2015;6:42008–42018. [DOI] [PMC free article] [PubMed] [Google Scholar]
- 46.Huang AC, Postow MA, Orlowski RJ et al. T‐cell invigoration to tumour burden ratio associated with anti‐PD‐1 response. Nature 2017;545:60–65. [DOI] [PMC free article] [PubMed] [Google Scholar]
- 47.Burrell RA, McGranahan N, Bartek J et al. The causes and consequences of genetic heterogeneity in cancer evolution. Nature 2013;501:338–345. [DOI] [PubMed] [Google Scholar]
- 48.Jamal‐Hanjani M, Wilson GA, McGranahan N et al. Tracking the evolution of non‐small‐cell lung cancer. N Engl J Med 2017;376:2109–2121. [DOI] [PubMed] [Google Scholar]
- 49.Gerlinger M, Rowan AJ, Horswell S et al. Intratumor heterogeneity and branched evolution revealed by multiregion sequencing. N Engl J Med 2012;366:883–892. [DOI] [PMC free article] [PubMed] [Google Scholar]
- 50.Gandara DR, Paul SM, Kowanetz M et al. Blood‐based tumor mutational burden as a predictor of clinical benefit in non‐small‐cell lung cancer patients treated with atezolizumab. Nat Med 2018;24:1441–1448. [DOI] [PubMed] [Google Scholar]
- 51.Kim ST, Cristescu R, Bass AJ et al. Comprehensive molecular characterization of clinical responses to PD‐1 inhibition in metastatic gastric cancer. Nat Med 2018;24:1449–1458. [DOI] [PubMed] [Google Scholar]
- 52.Chalmers ZR, Connelly CF, Fabrizio D et al. Analysis of 100,000 human cancer genomes reveals the landscape of tumor mutational burden. Genome Med 2017;9:34. [DOI] [PMC free article] [PubMed] [Google Scholar]