

Human visual cortex contains distributed representations of emotion categories identified by a convolutional neural network model.
Abstract
Theorists have suggested that emotions are canonical responses to situations ancestrally linked to survival. If so, then emotions may be afforded by features of the sensory environment. However, few computational models describe how combinations of stimulus features evoke different emotions. Here, we develop a convolutional neural network that accurately decodes images into 11 distinct emotion categories. We validate the model using more than 25,000 images and movies and show that image content is sufficient to predict the category and valence of human emotion ratings. In two functional magnetic resonance imaging studies, we demonstrate that patterns of human visual cortex activity encode emotion category–related model output and can decode multiple categories of emotional experience. These results suggest that rich, category-specific visual features can be reliably mapped to distinct emotions, and they are coded in distributed representations within the human visual system.
INTRODUCTION
Emotions are thought to be canonical responses to situations ancestrally linked to survival (1) or the well-being of an organism (2). Sensory processing plays a prominent role in nearly every theoretical explanation of emotion [e.g., (3, 4, 5)], yet neuroscientific views have historically suggested that emotion is driven by specialized brain regions, e.g., in the limbic system (6) and related subcortical circuits (7), or in some theories, in neural circuits specialized for emotion categories such as fear (8) and sadness (9). According to these long-standing views, activity in sensory cortex (e.g., visual areas V1 to V4) is thought to be antecedent to emotion but not central to emotional appraisals, feelings, or responses. However, recent theoretical developments (10) and empirical observations suggest that sensory and emotional representations may be much more intertwined than previously thought. Activity in visual cortex is enhanced by emotional stimuli (11), and single neurons learn to represent the affective significance of stimuli. For example, neurons in V1 (12), V4 (13), and inferotemporal cortex (14) selectively respond to rewarding stimuli. In addition, multivariate patterns of human brain activity that predict emotion-related outcomes often use information encoded in visual cortex (15, 16).
There are at least two ways of interpreting this evidence. On the one hand, emotion-related activity in sensory areas could reflect a general enhancement of visual processing for relevant, novel, or attended percepts (17). Stronger sensory responses to emotionally relevant percepts can also be evolutionarily conserved [relevant in ancestral environments (18)] or learned during development (12). In this case, affective stimuli evoke stronger sensory responses, but the information about emotion content (fear versus anger, sadness versus joy) is thought to be represented elsewhere. On the other hand, perceptual representations in sensory (e.g., visual) cortex could reflect the content of emotional situations in a rich way (19); specific configurations of perceptual features, ranging from low-level features (e.g., color or spatial frequency) to high-level features (e.g., the presence of faces or objects), could afford specific types, or categories, of emotional responses, including fear, anger, desire, and joy. In this case, neural codes in sensory cortices might represent information directly relevant for the nature of emotional feelings.
The latter view is broadly compatible with appraisal theories (20) and more recent theories of emotions as constructed from multiple perceptual, mnemonic, and conceptual ingredients (5). In appraisal theories, emotion schemas (21) are canonical patterns of organism-environment interactions that afford particular emotions. High-level visual representations are thought to be an integral part of schemas because they can act as situation cues that afford particular emotional responses. For example, scenes of carnage evoke rapid responses related to disgust or horror, and later (integrating conceptual beliefs about the actors and other elements) compassion, anger, or other emotions. Scenes with attractive, scantily clad people evoke schemas related to sex; scenes with delicious food evoke schemas related to consumption; and so on. In these cases, the sensory elements of the scene do not fully determine the emotional response—other aspects are involved, including one’s personal life experiences, goals, and interoceptive states (21)—but the sensory elements are sufficient to convey the schema or situation that the organism must respond to. Initial appraisals of emotion schemas (often called “system 1” appraisals) can be made rapidly (22), and in some cases, unconsciously, and unconscious emotion may drive preferences and shape learning (23). Emotion schemas are also content rich in the sense that they sharply constrain the repertoire of emotional responses afforded by a given schema. For example, horror scenes might afford fear, anger, or compassion, but other kinds of emotional responses (sadness, nurturing, and playfulness) would be ancestrally inappropriate. Thus, while some affective primitives (representations related to survival and well-being) are related to biologically older subcortical brain systems (6, 7) and involve relatively little cognitive processing, canonical, category-specific emotion schemas exist and may be embedded in part in human sensory cortical systems.
The hypothesis that emotion schemas are embedded in sensory systems makes several predictions that have not, to our knowledge, been tested. First, models constructed from image features alone should be able to (i) predict normative ratings of emotion category made by humans and (ii) differentiate multiple emotion categories. Second, representations in these models should map onto distinct patterns of brain activity in sensory (i.e., visual) cortices. Third, sensory areas, and particularly visual cortex, should be sufficient to decode multiple emotion categories. Further, because emotion schemas can be viewed as solutions to a constraint satisfaction problem (mapping certain sensory inputs to different kinds of emotions), these sensory representations are likely distributed in nature (24). Here, we test each of these hypotheses.
To test predictions 1 and 2, we developed a convolutional neural network (CNN), whose output is a probabilistic representation of the emotion category of a picture or video, and used it to classify images into 20 different emotion categories using a large stimulus set of 2232 emotional video clips (25). Using a computational approach to characterize how raw visual inputs are transformed into multiple emotion categories, we have an explicit model of visual emotion schemas that can be systematically validated and mapped onto known features of the visual system. Because this model strips away higher-order processes such as effortful cognitive appraisal, it has unique application potential. For example, clinically, this model could help assess the effectiveness of emotion interventions at a more fundamental computational level, which would relieve our reliance on more complex and subjective outcomes such as self-reported experience.
We validated this model, which we call EmoNet, in three different contexts, by predicting (i) normative emotion categories of video clips not used for training; (ii) normative emotional intensity ratings for International Affective Picture System (IAPS), an established set of emotional images (26); and (iii) the genre of cinematic movie trailers, which are designed to manipulate emotion by presenting different visual cues (27). The model is named EmoNet, as it is based on a seminal deep neural net model of object recognition called AlexNet (28) and has been adapted to identify emotional situations rather than objects. EmoNet’s goal is to provide a plausible account of how visual information is linked to distinct types of emotional responses (here characterized as human judgments of emotion categories). We refer to these linkages between patterns across sensory inputs and emotions as visual emotion schemas. This view is based on ideas from parallel distributed processing theory, wherein schemas are solutions to constraint satisfaction problems that neural networks learn to solve (29). A hallmark of schemas is that they require relational processing and integration across multiple elements (e.g., the color, forms, objects, and agents in a scene), which is likely crucial for the visual representation of emotion categories. To test whether EmoNet can uniquely identify multiple emotion categories, we developed and applied a statistical framework for estimating the number of discriminable emotion categories. To test prediction 2, we used machine learning approaches to find patterns of brain activity in the occipital lobe [measured via functional magnetic resonance imaging (fMRI), n = 18] linked to emotion category–related output from EmoNet. To test prediction 3, in a separate fMRI study (n = 32), we verified that patterns of occipital lobe activity can decode the category of emotional responses elicited by videos and music (across five categories). Our results are consistent with previous research, showing that different patterns of visual cortical activity are associated with different emotion categories (15–16) but go beyond them to (i) rigorously test whether sensory representations are sufficient for accurate decoding and (ii) provide a computational account of how sensory inputs are transformed into distributed emotion-related codes.
RESULTS
Classifying visual images into multiple emotion categories
EmoNet (Fig. 1) was based on the popular AlexNet object recognition model, which mirrors information processing in the human ventral visual stream (30), and changed its objective from recognizing object classes to identifying the normative emotion category of more than 137,482 images extracted from videos (25) with normative emotion categories based on ratings from 853 participants. This was accomplished by retraining weights in its final fully connected layer (see Materials and Methods for details). We tested EmoNet on 24,634 images from 400 videos not included in the training set. EmoNet accurately decoded normative human ratings of emotion categories, providing support for prediction 1. The human-consensus category was among the top 5 predictions made by the model (top 5 accuracy in 20-way classification) for 62.6% of images (chance, 27.95%; P < 0.0001, permutation test); the top 1 accuracy in a 20-way classification was 23.09% (chance, 5.00%; P < 0.0001, permutation test); the average area under the receiver operating characteristic curve (AUC) across the 20 categories was 0.745 (Cohen’s d = 0.945), indicating that emotions could be discriminated from one another with large effect sizes. Model comparisons indicated that EmoNet performed better than shallower models based on the same architecture (with fewer convolutional layers, all P < 0.0001, McNemar test) and better than a deeper model that included the eight layers from AlexNet and an additional fully connected layer optimized to predict emotion categories (P < 0.0001; see model 4 in fig. S1).
Fig. 1. Predicting emotional responses to images with a deep CNN.
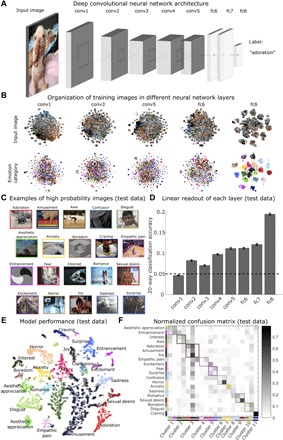
(A) Model architecture follows that of AlexNet (five convolutional layers followed by three fully connected layers); only the last fully connected layer has been retrained to predict emotion categories. (B) Activation of artificial neurons in three convolutional layers (1, 3, and 5) and two fully connected layers (6 and 8) of the network. Scatterplots depict t-distributed stochastic neighbor embedding (t-SNE) plots of activation for a random selection of 1000 units in each layer. The first four layers come from a model developed to perform object recognition (25), and the last layer was retrained to predict emotion categories from an extensive database of video clips. (C) Examples of randomly selected images assigned to each class in holdout test data (images from videos that were not used for training the model). Pictures were not chosen to match target classes. Some examples show contextually driven prediction, e.g., an image of a sporting event is classified as empathic pain, although no physical injury is apparent. (D) Linear classification of activation in each layer of EmoNet shows increasing emotion-relation information in later layers, particularly in the retrained layer fc8. Error bars indicate SEM based on binomial distribution. (E) t-SNE plot shows model predictions in test data. Colors indicate the predicted class, and circled points indicate that the ground truth label was in the top 5 predicted categories. Although t-SNE does not preserve global distances, the plot does convey local clustering of emotions such as amusement and adoration. (F) Normalized confusion matrix shows the proportion of test data that are classified into the 20 categories. Rows correspond to the correct category of test data, and columns correspond to predicted categories. Gray colormap indicates the proportion of predictions in the test dataset, where each row sums to a value of 1. Correct predictions fall on the diagonal of the matrix, whereas erroneous predictions comprise off-diagonal elements. Categories the model is biased toward predicting, such as amusement, are indicated by dark columns. Data-driven clustering of errors shows 11 groupings of emotions that are all distinguishable from one another (see Materials and Methods and fig. S3). Images were captured from videos in the database developed by Cowen and Keltner (25).
Crucially, EmoNet accurately discriminated multiple emotion categories in a relatively fine-grained way, although model performance varied across categories. “Craving” [AUC, 0.987; 95% confidence interval (CI), 0.980 to 0.990; d = 3.13; P < 0.0001], “sexual desire” (AUC, 0.965; 95% CI, 0.960 to 0.968; d = 2.56; P < 0.0001), “entrancement” (AUC, 0.902; 95% CI, 0.884 to 0.909; d = 1.83; P < 0.0001), and “horror” (AUC, 0.876; 95% CI, 0.872 to 0.883; d = 1.63; P < 0.0001) were the most accurately predicted categories. On the other end of the performance spectrum, “confusion” (AUC, 0.636; 95% CI, 0.621 to 0.641; d = 0.490; P < 0.0001), “awe” (AUC, 0.615; 95% CI, 0.592 to 0.629; d = 0.415; P < 0.0001), and “surprise” (AUC, 0.541; 95% CI, 0.531 to 0.560; d = 0.147; P = 0.0002) exhibited the lowest levels of performance, despite exceeding chance levels. Some emotions were highly confusable in the test data, such as “amusement,” “adoration,” and “joy,” suggesting that they have similar visual features despite being distinct from other emotions (fig. S3). Thus, visual information is sufficient for predicting some emotion schemas, particularly those that have a strong relationship with certain high-level visual categories, such as craving or sexual desire, whereas other sources of information are necessary to discriminate emotions that are conceptually abstract or depend on temporal dynamics (e.g., confusion or surprise).
The visual information EmoNet used to discriminate among emotion schemas could be related to a variety of features, ranging from low-level features (e.g., color or spatial power spectra) to high-level features (e.g., the presence of objects or faces). To investigate how these features are linked to different emotion schemas that EmoNet learned, we examined associations between these properties and 20-dimensional (20D) patterns of activation in EmoNet’s final emotion category layer for the training dataset. This analysis revealed that different color intensities, spatial power spectra, and object classes were associated with different emotion schema in the training data (with correlations as high as r = 0.8; fig. S2). However, when applied to images from the holdout test data, these bivariate associations largely failed to discriminate among emotion schemas (except for object classes, which exhibited a top 1 accuracy of 11.4%). Thus, EmoNet characterizes different categories by combining multiple visual features that vary in their abstractness, consistent with the idea that emotion schemas are represented in a distributed code.
To further assess the number of distinct emotion categories represented by EmoNet, we developed two additional tests of (i) dimensionality and (ii) emotion category discriminability. First, we tested the possibility that EmoNet is tracking a lower-dimensional space, such as one organized by valence and arousal, rather than a rich, category-specific representation. Principal components analysis (PCA) on model predictions in the holdout dataset indicated that many components were required to explain model predictions; 17 components were required to explain 95% of the model variance, with most components being mapped to only a single emotion [i.e., exhibiting simple structure (31); see fig. S3]. To test category discriminability, we developed a test of how many emotion categories were uniquely discriminable from each other category in EmoNet’s output (Fig. 1E; see Supplementary Text for details of the method). The results indicated that EmoNet differentiated 11 (95% CI, 10 to 14) distinct emotion categories from one another, supporting the sensory embedding hypothesis.
Modeling valence and arousal as combinations of emotion-related features
To further test EmoNet’s generalizability, we tested it on three additional image and movie databases. A first test applied EmoNet to images in the IAPS, a widely studied set of images used to examine the influence of positive and negative affect on behavior, cognitive performance, autonomic responses, and brain activity (32). The IAPS dataset provides an interesting test because human norms for emotion intensity ratings are available and because IAPS images often elicit mixed emotions that include responses in multiple categories (33). Much of the variance in these emotion ratings is explained by a 2D model of valence (pleasant to unpleasant) and arousal (calm to activated), and emotion categories are reliably mapped into different portions of the valence-arousal space (34), often in a circumplex pattern (5). These characteristics of the IAPS allowed us to determine whether the schemas learned by EmoNet reliably inform normative human ratings of valence and arousal and whether EmotNet organizes emotions in a low-dimensional or circumplex structure similar to human ratings. These tests serve the dual functions of validating emotion schemas against human ratings of affective feelings and providing a description of the visual features that may contribute to human feelings.
We constructed predictive models using partial least squares (PLS) regression of human valence and arousal on features from the last fully connected layer of EmoNet, which has 20 units, one for each emotion category. We analyzed the accuracy in predicting valence and arousal ratings of out-of-sample test images using 10-fold cross-validation (35), stratifying folds based on normative ratings. We also analyzed the model weights (βPLS) mapping emotion categories to arousal and valence to construct a valence and arousal space from the activity of emotion category units in EmoNet. The models strongly predicted valence and arousal ratings for new (out-of-sample) images. The model predicted valence ratings with r = 0.88 [P < 0.0001, permutation test; root mean square error (RMSE), 0.9849] and arousal ratings with r = 0.85 (P < 0.0001; RMSE, 0.5843). A follow-up generalization test using these models to predict normative ratings on a second independent image database (36)—with no model retraining—showed similar levels of performance for both valence (r = 0.83; RMSE, 1.605) and arousal (r = 0.84; RMSE, 1.696). Thus, EmoNet explained more than 60% of the variance in average human ratings of pleasantness and arousal when viewing IAPS images. This level of prediction indicates that the category-related visual features EmoNet detects are capable of explaining differences in self-reported valence and arousal in stimuli that elicit mixed emotions.
In addition, the categorical emotion responses in EmoNet’s representation of each image were arranged in valence-arousal space in a manner similar to the human circumplex model (Fig. 2B), although with some differences from human raters. Units coding for adoration ( = 0.5002; 95% CI, 0.2722 to 1.0982), “aesthetic appreciation” ( = 0.4508; 95% CI, 0.1174 to 0.6747), and surprise ( = 0.4781; 95% CI, 0.3027 to 1.1476) were most strongly associated with positive valence across categories. Units coding for “disgust” ( = −0.7377; 95% CI, −1.0365 to −0.6119), entrancement ( = −0.1048; 95% CI, −0.5883 to −0.0010), and horror ( = −0.3311; 95% CI, −0.7591 to −0.0584) were the most negatively valenced. The highest loadings on arousal were in units coding for awe ( = 0.0285; 95% CI, 0.0009 to 0.0511) and horror ( = 0.0322; 95% CI, 0.0088 to 0.0543), and the lowest-arousal categories were amusement ( = −0.3189; 95% CI, −0.5567 to −0.1308), “interest” ( = −0.2310; 95% CI, −0.4499 to −0.0385), and “boredom” ( = −0.1605; 95% CI, −0.4380 to −0.0423). The marked similarities with the human affective circumplex demonstrate that model representations of emotion categories reliably map onto dimensions of valence and arousal. However, these findings do not indicate that the valence-arousal space is sufficient to encode the full model output; we estimate that doing so requires 17 dimensions, and the loadings in Fig. 2B do not exhibit a classic circumplex pattern. The discrepancies (e.g., surprise is generally considered high-arousal and neutral valence, and awe is typically positively valenced) highlight that the model was designed to track visual features that might serve as components of emotion but do not capture human feelings in all respects. For example, while people may typically rate awe as a positive experience, “awe-inspiring” scenes often depict high-arousal activities (e.g., extreme skiing or base jumping).
Fig. 2. Emotion-related image features predict normative ratings of valence and arousal.
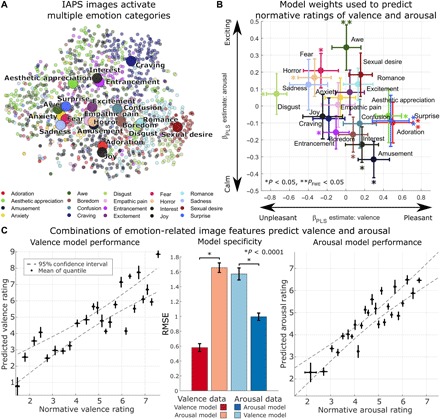
(A) Depiction of the full IAPS, with picture locations determined by t-SNE of activation of the last fully connected layer of EmoNet. The color of each point indicates the emotion category with the greatest score for each image. Large circles indicate mean location for each category. Combinations of loadings on different emotion categories are used to make predictions about normative ratings of valence and arousal. (B) Parameter estimates indicate relationships identified using PLS regression to link the 20 emotion categories to the dimensions of valence (x axis) and arousal (y axis). Bootstrap means and SE are shown by circles and error bars. For predictions of valence, positive parameter estimates indicate increasing pleasantness, and negative parameter estimates indicate increasing unpleasantness; for predictions of arousal, positive parameter estimates indicate a relationship with increasing arousal and negative estimates indicate a relationship with decreasing arousal. *P < 0.05, **PFWE < 0.05. (C) Cross-validated model performance. Left and right: Normative ratings of valence and arousal, plotted against model predictions. Individual points reflect the average rating for each of 25 quantiles of the full IAPS set. Error bars indicate the SD of normative ratings (x axis; n = 47) and the SD of repeated 10-fold cross-validation estimates (y axis; n = 10). Middle: Bar plots show overall RMSE (lower values indicate better performance) for models tested on valence data (left bars, red hues) and arousal data (right bars, blue hues). Error bars indicate the SD of repeated 10-fold cross-validation. *P < 0.0001, corrected resampled t test. The full CNN model and weights for predicting valence and arousal are available at https://github.com/canlab for public use.
Classifying the genre of movie trailers based on their emotional content
A second test examined whether emotion categories could meaningfully be applied to dynamic stimuli such as videos. We tested EmoNet’s performance in classifying the genre of 28 randomly sampled movie trailers from romantic comedy (n = 9), action (n = 9), and horror (n = 10) genres (see Materials and Methods for sampling and selection criteria). EmoNet made emotion predictions for each movie frame (for example, see the time series in Fig. 3). PLS regression was used to predict movie genres from the average activation over time in EmoNet’s final emotion category layer, using one-versus-all classification (37) with 10-fold cross-validation to estimate classification accuracy in independent movie trailers.
Fig. 3. Identifying the genre of movie trailers using emotional image features.
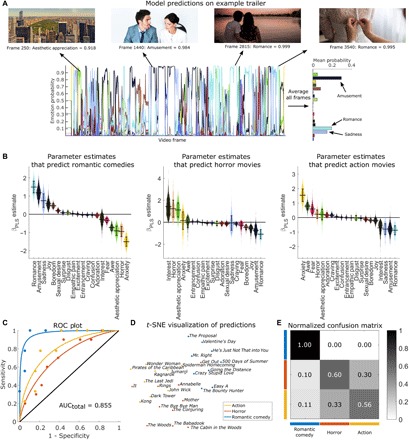
(A) Emotion prediction for a single movie trailer. Time courses indicate model outputs on every fifth frame of the trailer for the 20 emotion categories, with example frames shown above. Conceptually related images from the public domain (CC0) are displayed instead of actual trailer content. A summary of the emotional content of the trailer is shown on the right, which is computed by averaging predictions across all analyzed frames. (B) PLS parameter estimates indicate which emotions lead to predictions of different movie genres. Violin plots depict the bootstrap distributions (1000 iterations) for parameter estimates differentiating each genre from all others. Error bars indicate bootstrap SE. (C) Receiver operator characteristic (ROC) plots depict 10-fold cross-validation performance for classification. The solid black line indicates chance performance. (D) t-SNE plot based on the average activation of all 20 emotions. (E) Confusion matrix depicting misclassification of different genres; rows indicate the ground truth label, and columns indicate predictions. The grayscale color bar shows the proportion of trailers assigned to each class. Analysis was performed on a trailer for The Proposal, ©2009 Disney.
The results indicated that EmoNet’s frame-by-frame predictions tracked meaningful variation in emotional scenes across time (Fig. 3A) and that mean emotion category probabilities accurately classified the trailers (Fig. 3, B and C, and movies S1 to S3), with a three-way classification accuracy of 71.43% (P < 0.0001, permutation test; chance, 35.7%). The average AUC for the three genres was 0.855 (Cohen’s d = 1.497; Fig. 3C). Classification errors were made predominantly between action and horror movies (26.32%), whereas romantic comedies were not misclassified, indicating that they had the most distinct features.
Movie genres are systematically associated with different emotion schemas: Romantic comedies were predicted by increased activation of units coding for “romance” ( = 1.499; 95% CI, 1.001 to 2.257), amusement ( = 1.167; 95% CI, 0.639 to 2.004), and “sadness” ( = 0.743; 95% CI, 0.062 to 1.482); horror trailers were predicted by activation of interest ( = 1.389; 95% CI, 0.305 to 3.413), horror ( = 1.206; 95% CI, 0.301 to 3.536), and aesthetic appreciation ( = 1.117; 95% CI, 0.259 to 2.814); and action trailers were predicted by activation of “anxiety” ( = 1.526; 95% CI, 0.529 to 2.341), awe ( = 0.769; 95% CI, 0.299 to 1.162), and “fear” ( = 0.575; 95% CI, 0.094 to 1.109). As with IAPS images, EmoNet tracked canonical visual scenes that can lead to several kinds of emotional experience based on context. For instance, some horror movies in this sample included scenic shots of woodlands, which were classified as aesthetic appreciation, leading to high weights for aesthetic appreciation on horror films. While these mappings illustrate how EmoNet output alone should not be overinterpreted in terms of human feelings, they also illustrate how emotion concepts can constrain the repertoire of feelings in context. A beautiful forest or children playing can be ominous when paired with other threatening context cues (e.g., scary music), but the emotion schema is incompatible with a range of other emotions (sadness, anger, interest, sexual desire, disgust, etc.).
Decoding model representations of emotions from patterns of human brain activity
If emotion schemas are afforded by visual scenes, then it should be possible to decode emotion category–related representations in EmoNet from activity in the human visual system. To test this hypothesis, we measured brain activity using fMRI while participants (n = 18) viewed a series of 112 affective images that varied in affective content (see Materials and Methods for details). Treating EmoNet as a model of the brain (38), we used PLS to regress patterns in EmoNet’s emotion category layer onto patterns of fMRI responses to the same images. We investigated the predictive performance, discriminability, and spatial localization of these mappings to shed light on how and where emotion-related visual scenes are encoded in the brain.
Because EmoNet was trained on visual images, we first explored how emotion schemas might emerge from activity in the human visual system, within a mask comprising the entire occipital lobe [7214 voxels (39)]. Patterns of occipital activity predicted variation in EmoNet’s emotion category units across images, with different fMRI patterns associated with different emotion categories (Fig. 4; for individual maps, see fig. S4). Multiple correlations between brain-based predictions and activation in EmoNet emotion category units were tested in out-of-sample individuals using leave-one-subject-out (40) cross-validation. These correlations were positive and significant for each of the 20 EmoNet emotion categories [mean r = 0.2819 ± 0.0163 (SE) across individuals; mean effect size d = 3.00; 76.93% of the noise ceiling; P < 0.0001, permutation test; see Materials and Methods]. The highest average level of performance included entrancement [r = 0.4537 ± 0.0300 (SE); d = 3.559; 77.03% of the noise ceiling; P < 0.0001], sexual desire [r = 0.4508 ± 0.0308 (SE); d = 3.453; 79.01% of the noise ceiling; P < 0.0001], and romance [r = 0.3861 ± 0.0203 (SE); d = 4.476; 72.34% of the noise ceiling; P < 0.0001], whereas horror [r = 0.1890 ± 0.0127 (SE); d = 3.520; 60.17% of the noise ceiling; P < 0.0001], fear [r = 0.1800 ± 0.0216 (SE); d = 1.963; 59.44% of the noise ceiling; P < 0.0001], and “excitement” [r = 0.1637 ± 0.0128 (SE); d = 3.004; 65.28% of the noise ceiling; P < 0.0001] exhibited the lowest levels of performance.
Fig. 4. Visualization of the 20 occipital lobe models, trained to predict EmoNet categories from brain responses to emotional images.
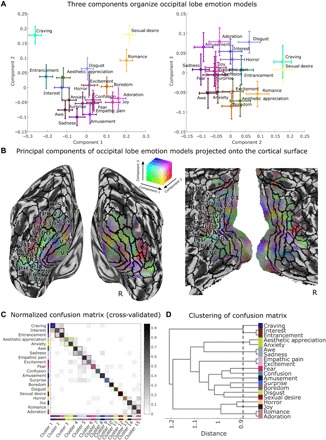
Visualization based on PCA reveals three important emotion-related features of the visual system. (A) Scatterplots depict the location of 20 emotion categories in PCA space, with colors indicating loadings onto the first three principal components (PCs) identified from 7214 voxels that retain approximately 95% of the spatial variance across categories. The color of each point is based on the component scores for each emotion (in an additive red-green-blue color space; PC1 = red, PC2 = green, PC3 = blue). Error bars reflect bootstrap SE. (B) Visualization of group average coefficients that show mappings between voxels and principal components. Colors are from the same space as depicted in (A). Solid black lines indicate boundaries of cortical regions based on a multimodal parcellation of the cortex (41). Surface mapping and rendering were performed using the CAT12 toolbox (42). (C) Normalized confusion matrix shows the proportion of data that are classified into 20 emotion categories. Rows correspond to the correct category of cross-validated data, and columns correspond to predicted categories. Gray colormap indicates the proportion of predictions in the dataset, where each row sums to a value of 1. Correct predictions fall on the diagonal of the matrix; erroneous predictions comprise off-diagonal elements. Data-driven clustering of errors shows 15 groupings of emotions that are all distinguishable from one another. (D) Visualization of distances between emotion groupings. Dashed line indicates minimum cutoff that produces 15 discriminable categories. Dendrogram was produced using Ward’s linkage on distances based on the number of confusions displayed in (C). See Supplementary Text for a description and validation of the method.
To further test the number of discriminable emotion categories encoded in visual cortex, we constructed a confusion matrix for relationships between the visual cortical multivariate pattern responses and EmoNet emotion category units. For each study participant, we correlated the output from each of the 20 fMRI models (a vector with 112 values, one for each IAPS image) with vectors of activation across EmoNet’s 20 emotion category units (producing a 20 × 20 correlation matrix), using leave-one-subject-out cross-validation to provide an unbiased test. For each model, the EmoNet unit with the highest correlation was taken as the best-guess emotion category based on brain activity, and the resulting confusion matrix was averaged across participants. The confusion matrix is shown in Fig. 4C, with correct predictions in 20-way classification (sensitivity) shown on the diagonal and false alarms (1 – specificity) on the off-diagonal. The average sensitivity across participants was 66.67 ± 11.4% (SEM), and specificity was 97.37 ± 0.88%; thus, visual cortical activity was mapped onto EmoNet’s categories with a positive predictive value of 65.45 ± 10.4% (chance is approximately 5%). In addition, as above, we estimated the number of uniquely discriminable categories by clustering the 20 categories and searching the clustering dendrogram to determine the maximum number of clusters (minimum link distance) at which each cluster was significantly discriminable from each other one, with bootstrap resampling to estimate confidence intervals. The results showed at least 15 discriminable categories (95% CI, 15 to 17), with a pattern of confusions that was sometimes intuitive based on psychology (e.g., “empathic pain” was indistinguishable from excitement, and romance was grouped with adoration and interest with entrancement) but, in other cases, was counterintuitive (sadness grouped with awe). This underscores that visual cortex does not perfectly reproduce human emotional experience but, nonetheless, contains a rich, multidimensional representation of high-level, emotion-related features, in support of prediction 2.
In additional model comparisons, we tested whether occipital cortex was necessary and sufficient for accurate prediction of EmoNet’s emotion category representation. We compared models trained using brain activity from individual areas [i.e., V1 to V4 (43) and inferotemporal cortex (44)], the entire occipital lobe (39), and the whole brain. We trained models to predict variation across images in each EmoNet emotion category unit and averaged performance across emotion categories. The whole–occipital lobe model [r = 0.2819 ± 0.0163 (SE)] and the whole-brain model [r = 0.2664 ± 0.0150 (SE)] predicted EmoNet emotion categories more strongly than models based on individual visual areas (r = 0.0703 to 0.1635; all P < 0.0001). The occipital lobe model showed marginally better performance than the whole-brain model (Δr = 0.0155; 95% CI, 0.0008 to 0.0303; P = 0.0404, paired t test), despite having nearly 100,000 fewer features available for prediction (for model comparisons across regions, see fig. S5). A post hoc, confirmatory test revealed that excluding occipital lobe activation from the whole-brain model significantly reduced performance (Δr = −0.0240; 95% CI, −0.0328 to −0.0152; P < 0.0001, paired t test), indicating that activity in the occipital lobe meaningfully contributed to predictions in the whole-brain model. Furthermore, using occipital lobe activation to decode EmoNet emotion categories (activation in layer fc8) was more accurate than decoding earlier layers (conv1 to conv5, fc6, and fc7; see fig. S6). These results provide strong support for distributed representation of visual emotion schemas within the occipital lobe and partially redundant coding of this information in other brain systems. Although multiple brain systems convey emotion-related information (potentially related to action tendencies, somatovisceral responses, modulation of cognitive processes, and subjective feelings), activity outside the visual system does not appear to uniquely reflect the representations learned by EmoNet and may be better aligned with nonvisual aspects of emotion. More generally, the distributed coding of emotion categories parallels other recent findings on population coding of related affective processes (15–16); for review, see (45).
Classifying patterns of visual cortex activity into multiple distinct emotion categories
To provide additional evidence that visual cortical representations are emotion category–specific, we tested whether visual cortical activity was sufficient to decode the category of emotional videos in an independent dataset [n = 32; see (15)]. In this dataset, human individuals viewed cinematic film clips that elicited contentment, sadness, amusement, surprise, fear, and anger. We selected videos that elicited responses in one emotion category above all others for each video, complementing the previous study, whose stimuli elicited more blended emotional responses. We tested predictive accuracy in seven-way classification of emotion category based on subject-average patterns of occipital lobe activity for each condition, with eight-fold cross-validation across participants to test prediction performance in out-of-sample individuals. We then performed discriminable cluster identification (Figs. 1 and 4; see Supplementary Text for details) to estimate how many distinct emotion categories out of this set are represented in visual cortex.
This analysis revealed that of the seven states being classified (six emotions and neutral videos), at least five distinct emotion clusters (95% CI, 5 to 7) could be reliably discriminated from one another based on occipital lobe activity (five-way classification accuracy, 40.54%; chance, 20%; see Fig. 5), supporting prediction 3. Full seven-way classification was 29.95% (chance, 14.3%; P = 0.002). Contentment, amusement, and neutral videos were reliably differentiated from all other emotions. States of fear and surprise were not discriminable from one another (they were confused 21.09% of the time), yet they were reliably differentiated from all other emotions. Sadness and anger were also confusable (15.5%) but were discriminable from all other emotional states. Thus, although some emotional states were similar to one another regarding occipital lobe activation, we found strong evidence for categorical coding of multiple emotions during movie inductions of specific emotions.
Fig. 5. Multiclass classification of occipital lobe activity reveals five discriminable emotion clusters.
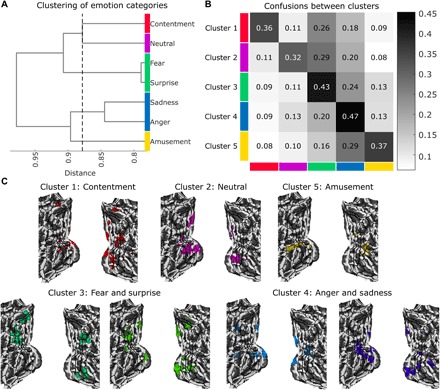
(A) Dendrogram illustrates hierarchical clustering of emotion categories that maximizes discriminability. The x axis indicates the inner squared distance between emotion categories. The dashed line shows the optimal clustering solution; cluster membership is indicated by color. (B) Confusion matrix for the five-cluster solution depicts the proportion of trials that are classified as belonging to each cluster (shown by the column) as a function of ground truth membership in a cluster (indicated by the row). The overall five-way accuracy is 40.54%, where chance is 20%. (C) Model weights indicate where increasing brain activity is associated with the prediction of each emotion category. Maps are thresholded at a voxel-wise threshold of P < 0.05 for display.
DISCUSSION
Our work demonstrates the intimate relationship between visual perception and emotion. Although emotions are often about specific objects, events, or situations (1), few computational accounts of emotion specify how sensory information is transformed into emotion-relevant signals. Driven by the hypothesis that emotion schemas are embedded in the human visual system, we developed a computational model (EmoNet) to classify images into 20 different emotion categories. Consistent with our prediction that image features alone are sufficient for predicting normative ratings of emotion categories determined by humans, EmoNet accurately classified images into at least 11 different emotion categories in holdout test data. Supporting our second prediction that EmoNet representations learned from visual images should map primarily onto the activity of sensory systems (as opposed to subcortical structures or limbic brain regions), distributed patterns of human occipital lobe activity were the best predictors of emotion category units in EmoNet. Last, our third prediction was supported by the observation that patterns of occipital lobe activity were sufficient for decoding at least 15 emotion categories evoked by images and at least five of seven emotional states elicited by cinematic movies. These findings shed light both on how visual processing constrains emotional responses and on how emotions are represented in the brain.
A large body of research has assumed that low-level visual information is mainly irrelevant to emotional processing; it should be either controlled for or explained away, although studies have shown that neurons in early visual areas are sensitive to affective information such as reward (12). Our model provides a means to disentangle the visual properties of stimuli that are emotion relevant from those that are not and isolate stimulus-related features [e.g., red color serving as an indicator of higher energy content in fruit (46)] from more abstract constructs (e.g., the broader concept of craving, which does not necessarily require a visual representation). Along these lines, we found some evidence that aspects of the visual field, including angle, eccentricity, and field size, are modestly associated with different emotion schema, converging with evidence that emotions can act to broaden or focus visual perception (47). However, we found that simple visual features (or linear combinations of them) are poor discriminators of emotion categories, suggesting that EmoNet is using complex, nonlinear combinations of visual features to label images. This suggests that distributed representations that include multiple different visual features (varying in abstractness) code for different schemas. Thus, although the information EmoNet uses is certainly visual in nature, it is not reducible to a simple set of features easily labeled by humans. On the basis of our findings, it seems unlikely that a complete account of emotion will be devoid of sensory qualities that are naturally associated with emotional outcomes or those that are reliably learned through experience.
We found that human ratings of pleasantness and excitement evoked by images can be accurately modeled as a combination of emotion-specific features (e.g., a mixture of features related to disgust, horror, sadness, and fear is highly predictive of unpleasant arousing experiences). Individuals may draw from this visual information when asked to rate images. The presence of emotion-specific visual features could activate learned associations with more general feelings of valence and arousal and help guide self-report. It is possible that feelings of valence and arousal arise from integration across feature detectors or predictive coding about the causes of interoceptive events (48). Rather than being irreducible (49), these feelings may be constructed from emotionally relevant sensory information, such as the emotion-specific features we have identified here, and previous expectations of their affective significance. This observation raises the possibility that core dimensions of affective experience, such as arousal and valence, may emerge from a combination of category-specific features rather than the other way around, as is often assumed in constructivist models of emotion.
In addition to our observation that emotion-specific visual features can predict normative ratings of valence and arousal, we found that they were effective at classifying the genre of cinematic movie trailers. Moreover, the emotions that informed prediction were generally consistent with those typically associated with each genre (e.g., romantic comedies were predicted by activation of romance and amusement). This validation differed from our other two image-based assessments of EmoNet (i.e., testing on holdout videos from the database used for training and testing on IAPS images) because it examined stimuli that are not conventionally used in the laboratory but are robust elicitors of emotional experience in daily life. Beyond hinting at real-world applications of our model, integrating results across these three validation tests serves to triangulate our findings, as different methods (with different assumptions and biases) were used to produce more robust, reproducible results.
The fact that emotion category units of EmoNet were best characterized by activity spanning visual cortex (i.e., the occipital lobe) sheds light on the nature of emotion representation in the brain. There are multiple types of well-known functional specialization in the occipital lobe, with different areas selectively responding to varying spatial frequency, orientation, color, and motion, among numerous other examples (50). More recent work combining CNN models and brain measurement (30) has demonstrated that early visual areas represent features in early layers of AlexNet in an explicit manner, whereby information is directly accessible to a downstream neuron or processing unit via linear readout (51).
Although an extensive body of work has demonstrated that these mappings between visual features and the occipital lobe exist, our findings indicate that neither early layers of AlexNet nor individual visual features successfully discriminate among multiple emotion categories. These observations suggest that an alternative account is necessary to explain how emotion schemas are mapped onto the visual system. Our work provides new insight into the visual system and the nature of emotion by showing that the occipital cortex explicitly encodes representations of multiple emotion schema and that rather than being encoded in individual visual areas, emotion-related features are distributed across them. This distributed representation encodes complex emotion-related features that are not reducible to individual visual features. These features likely emerge through a series of nonlinear transformations, through which the visual system filters retinal input to represent different types of emotional situations, analogous to how object representations emerge in the ventral stream.
Activation of emotion schemas in visual cortex offers a rapid, possibly automatic way of triggering downstream emotional responses in the absence of deliberative or top-down conceptual processes. By harnessing the parallel and distributed architecture of the visual system, these representations could be refined through experience. Information from downstream systems via feedback projections from ventromedial prefrontal cortex or the amygdala (10) could update visual emotion schemas through learning. Sensory information from nonretinal sources, including auditory stimuli and mental imagery, can activate object-specific representations in early visual areas (52) and could similarly activate emotion-specific codes in the visual system. Thus, emotion-related activity in visual cortex is most likely not a purely bottom-up response to visual inputs or a top-down interpretation of them but is at the interface of sensory representations of the environment and previous knowledge about potential outcomes. Future work integrating computational models with recurrent feedback and brain responses to emotional images will be necessary to understand the convergence of these bottom-up and top-down signals. Our computational framework provides a way to resolve outstanding theoretical debates in affective science. It could be used, for example, to test whether mappings between visual features and emotions are conserved across species or change throughout development in humans. On the basis of evolutionary accounts that suggest that certain basic emotions are solutions to survival challenges, mechanisms for detecting emotionally relevant events should be conserved across species. Notably, some of the most accurately predicted schemas include sexual desire and craving, which are motivational states that transcend cultures and are linked to clear evolutionary goals (i.e., to reproduce and to acquire certain nutrients). Work in the domain of object recognition has shown that representations of objects are highly similar between humans and macaques (53); an extension of the present work is to test whether the emotion representations we identified here are as well.
Our work has several limitations that can be addressed in future work. Although our goal was to focus on visual processing of emotional features, visual stimulation is not the only way in which emotions can be elicited. Information from other senses (olfactory, auditory, somatic, interoceptive, etc.), memories of past events, manipulation of motor activation, and mental imagery have all been used to evoke emotional experiences in the laboratory. EmoNet can be expanded, potentially by adding more abstract or supramodal representation of emotions and interactions among different types of sensory information. Further, although EmoNet was trained to evaluate the emotional significance of images, it was not developed to predict emotional behavior. Future work is necessary to understand whether emotion schemas constrain behavior and to determine whether they generalize to real-world scenarios [e.g., whether viewing an image of a spider activates the same schema as physically encountering one (54)]. It may also be possible to refine the model by constructing adversarial examples (55) of different schemas, i.e., images that are designed to fool EmoNet, and to evaluate their impact on human experience and behavior. Last, as our model comparisons show, EmoNet is only one model in a large space of neural networks that can explain emotion processing; comparing different models designed to achieve a common goal (e.g., detecting emotional situations from words, speech, or music or producing a specific behavioral response) may reveal the principles at the core of different emotional phenomena.
Using a combination of computational and neuroscientific tools, we have demonstrated that emotion schemas are embedded in the human visual system. By precisely specifying what makes images emotional, our modeling framework offers a new approach to understanding how visual inputs can rapidly evoke complex emotional responses. We anticipate that developing biologically inspired computational models will be a crucial next step for resolving debates about the nature of emotions [e.g., (56)] and providing practical tools for scientific research and in applied settings.
MATERIALS AND METHODS
Computational model development
We used a large database of emotional video clips (25) for developing EmoNet. This database includes 2185 videos that are well characterized by 27 distinct emotion categories. A total of 137,482 frames were extracted from the videos and divided into training and testing samples using a 90-10 split. Emotion categories that had fewer than 1000 frames for training were excluded from the model, reducing the emotions included in the model to adoration, aesthetic appreciation, amusement, anxiety, awe, boredom, confusion, craving, disgust, empathic pain, entrancement, excitement, fear, horror, interest, joy, romance, sadness, sexual desire, and surprise. These categories were selected because they were extensively validated as distinct by human raters and based on the suitability of available stimuli for modeling; other emotion categories are likely important (e.g., anger was excluded from the set) and should be studied in future research. The pretrained CNN model AlexNet (28) was downloaded for use in MATLAB. We fixed all but the last fully connected layer of AlexNet, and we retrained the model after replacing the 1000 target object categories with the 20 emotion categories listed above. Training was performed using stochastic gradient descent with momentum, an initial learning rate of 0.0001, and a minibatch size of 16.
Computational model validation
Three separate tests were performed to assess model performance: (i) validation on the holdout dataset, (ii) predicting normative ratings of valence and arousal for the IAPS [a standardized set of affective images used in psychological research (26)], and (iii) predicting the genre of cinematic movie trailers. For the holdout dataset, we computed standard signal detection metrics (i.e., AUC, sensitivity, and specificity) and evaluated overall model performance and that for each category. We performed inference on model performance by generating null distributions through random permutation of test set labels. In addition, EmoNet’s performance was compared to that of AlexNet to determine how much retraining the last fully connected layer improved performance. For this purpose, we randomly sampled AlexNet predictions for 20 object categories to compute relevant signal detection metrics 10,000 times in addition to finding the 20 unique object categories that best predicted the 20 emotions.
To verify the emergence of emotion-related information in EmoNet, we estimated the extent to which activation in each layer of EmoNet could be used to discriminate among the 20 target emotion categories. This was accomplished via PLS regression, with activation of units in each layer used as inputs to regression models and the 20 emotion categories as outputs. Separate regression models were estimated using training data for each layer, and the holdout images were used for model evaluation.
We additionally performed a series of model comparisons to evaluate which properties of EmoNet contributed to its performance in the holdout dataset. Modified versions of EmoNet were created by either shortening AlexNet before transfer learning. This was accomplished by reducing the number of convolutional layers or by removing fully connected layers. In addition, EmoNet was compared to a more complex model that included the fully trained AlexNet model but added an additional fully connected layer (with one unit per emotion category) instead of only retraining the last layer. Differences in the performance of models were evaluated using Friedman’s analysis of variance (ANOVA), and pairwise comparisons against EmoNet were made using McNemar tests via MATLAB’s testcholdout function.
Given evidence of above-chance performance, we conducted a series of post hoc tests to evaluate the relationship between different visual features and the representations learned by EmoNet. To this end, we computed the red, green, and blue color histograms; estimated the 2D power spectral density; computed the number of faces using the Viola-Jones algorithm; and applied AlexNet to identify the objects in each image. To qualitatively describe associations between these features and model output in the training sample, a series of correlations were performed. Each of these feature sets provided a number of predictors (ranging from 1 to ~150,000) that were used to classify images into 20 emotion categories using PLS discriminant analysis.
We assessed the generalizability of EmoNet on IAPS images using activations in the last fully connected layer to predict normative ratings of valence and arousal. This analysis was performed using PLS regression (with bootstrap procedures to estimate the variance of parameter estimates) and 10 iterations of 10-fold cross-validation to determine the correlation between model predictions and “ground truth” normative ratings. We averaged normative ratings and EmoNet predictions for each of 25 quantiles. The construct validity of model parameters (e.g., whether greater activations of amusement, as opposed to fear, were associated with higher valence norms) and cross-validated estimates of RMSE served as outcomes of interest.
In the final validation test, we used activations in the last fully connected layer to classify the genre of movie trailers (n = 28, sampling from romantic comedy, horror, and action movies; see the Supplementary Materials). Trailers were selected on the basis of genres listed on www.imdb.com/feature/genre and their availability at www.hd-trailers.net. Classification into different genres was performed using PLS regression (with bootstrap procedures to estimate the variance of parameter estimates) and 10-fold cross-validation to estimate the accuracy of classification into different genres. The construct validity of model parameters (e.g., whether greater activations of amusement predicted romantic comedies) and cross-validated estimates of classification accuracy served as outcomes of interest.
fMRI experiment I: Modeling brain responses to emotional images
Participants
We recruited 18 healthy, right-handed individuals (10 females, Mage = 25) from the Boulder area. As there were, to our knowledge, no previous studies relating activation in convolutional neural nets to human fMRI responses to emotional images, this sample size was not determined a priori. The experimental design focused on maximizing task-related signal within participants by showing them 112 affective images. Confirmatory post hoc analysis of effect size and the variance of parameter estimates corroborated that this sample size was sufficient for reliably detecting effects and minimizing the variance of parameter estimates (e.g., predicting EmoNet outcomes from occipital lobe activity using a random sample of only nine participants produced an average effect size of d = 3.08 and 95% CI of 2.08 to 4.36; see fig. S7). Participants did not meet the Diagnostic and Statistical Manual of Mental Disorders (DSM V) criteria for any psychological disorder and were screened to ensure safety in the MR environment. All participants provided informed consent before the experiment in accordance with the University of Colorado Boulder Institutional Review Board.
Experimental paradigm
In this experiment, brain activity was measured using fMRI, while participants viewed a series of emotional images. Stimuli were selected from the IAPS and the Geneva Affective PicturE Database (GAPED) using published normative arousal ratings to have either positive or negative valence and high arousal (26, 33, 57, 58). A total of 112 images were used for this experiment.
Image presentation lasted 4 s, with a jittered intertrial interval of 3 to 8 s [average internal interval (ITI), 4 s]. The scanning session was divided into two runs lasting 7.5 min, where the images were presented in a randomized order. Stimulus presentation was controlled using code written in MATLAB using the Psychophysics toolbox. Eye position was assessed during scanning using an EyeLink 1000 system (SR Research, Ottawa, Ontario, Canada) with a sampling rate of 1 kHz. Bivariate associations between the variance of eye position (i.e., the SD of lateral and vertical position) and EmoNet predictions were computed to confirm that eye movements were not highly correlated with model output.
MRI data acquisition
Gradient-echo echo-planar imaging (EPI) blood-oxygen-level-dependent (BOLD)–fMRI was performed on a 3-T Siemens MRI scanner (Siemens Healthcare). Functional images were acquired using multiband EPI sequence: echo time (TE), 30 ms; repetition time (TR), 765 ms; flip angle, 44°; number of slices, 80; slice orientation, coronal; phase encoding = h > f; voxel size, 1.6 mm × 1.6 mm × 2.0 mm; gap between slices, 0 mm; field of view, 191 mm × 191 mm; multiband acceleration factor, 8; echo spacing, 0.72 ms; bandwidth, 1724 Hz per pixel; partial Fourier in the phase encode direction, 7/8.
Structural images were acquired using a single-shot T1 MPRAGE sequence: TE, 2.01 ms; TR, 2.4 s; flip angle, 8°; number of slices, 224; slice orientation, sagittal; voxel size, 0.8 mm isotropic; gap between slices, 0 mm; field of view, 256 mm × 256 mm; GeneRalized Autocalibrating Partial Parallel Acquisition (GRAPPA) acceleration factor, 2; echo spacing, 7.4 ms; bandwidth, 240 Hz per pixel.
MRI preprocessing
Multiband brain imaging data were preprocessed following procedures used in the Human Connectome Project (59). This approach includes distortion correction, spatial realignment based on translation (in the transverse, sagittal, and coronal planes) and rotation (roll, pitch, and yaw), spatial normalization to MNI152 space using T1 data, and smoothing using a 6-mm full width at half maximum (FWHM) Gaussian kernel.
MRI analysis
Preprocessed fMRI data were analyzed using general linear models (GLMs) with Statistical Parametric Mapping (SPM8) software (Wellcome Trust Centre for Neuroimaging, UK). Separate models were estimated for each participant that included the following: (i) a regressor for every image presented to participants, modeled as a 4-s boxcar convolved with the canonical hemodynamic response function (HRF) of SPM; (ii) 24 motion covariates from spatial realignment (i.e., translation in x, y, and z dimensions; roll, pitch, and yaw; and their first- and second-order temporal derivatives); (iii) nuisance regressors specifying outlier time points, or “spikes,” that had large deviations in whole-brain BOLD signal; and (iv) constant terms to model the mean of each imaging session.
To identify mappings between patterns of brain activity and features of EmoNet, PLS regression models were fit on data from the entire sample (n = 18) using the full set of single-trial parameter estimates (112 trials for each participant) as input and activation in the last fully connected layer of EmoNet as the output (20 different variables, one per emotion category). We also conducted additional analyses using the same approach to predict high-dimensional patterns of activation from earlier layers of EmoNet (layers conv1 to conv5, fc6, and fc7). Model generalization (indicated by the correlation between observed and predicted outcomes and mean squared error) was estimated using leave-one-subject-out cross-validation. Inference on model performance was performed using permutation testing, where model features (i.e., activation in layer fc8) were randomly shuffled on each of 10,000 iterations. Performance relative to the noise ceiling was estimated by computing the ratio of cross-validated estimates to those using resubstitution (which should yield perfect performance in a noiseless setting; see Supplementary Text).
Inference on parameter estimates from PLS was performed via bootstrap resampling with 1000 replicates, using the means and SE of the bootstrap distribution to compute P values based on a normal distribution. Bootstrap distributions were visually inspected to verify that they were approximately normal. Thresholding of maps was performed using false discovery rate (FDR) correction with a threshold of q < 0.05. To visualize all 20 models in a low-dimensional space, principal component decomposition was performed on PLS regression coefficients on every bootstrap iteration to produce a set of orthogonal components and associated coefficients comprising a unique pattern of occipital lobe voxels. Procedures for inference and thresholding were identical to those used for parameter estimates, if only they were applied to coefficients from the PCA. Brain maps in the main figures are unthresholded for display. All results reported in the main text (and supplementary figures) survive FDR correction for multiple comparisons.
fMRI experiment II: Classifying brain responses to emotional film clips
fMRI data used for validating the model have been published previously; here, we briefly summarized the procedure. Full details can be found in the study of Kragel and LaBar (15).
Participants
We used the full sample (n = 32) from an archival dataset characterizing brain responses to emotional films and music clips. For this analysis, which focuses on visual processing, we used only brain responses to film stimuli (available at www.neurovault.org). These data comprise single-trial estimates of brain activity for stimuli used to evoke experiences that were rated as being emotionally neutral in addition to states of contentment, amusement, surprise, fear, anger, and sadness.
Experimental paradigm
Participants completed an emotion induction task where they were presented with an emotional stimulus and subsequently provided on-line self-reports of emotional experience. Each trial started with the presentation of either a film or music clip (mean duration, 2.2 min), immediately followed by a 23-item affect self-report scale lasting 1.9 min, followed by a 1.5-min washout clip to minimize carryover effects.
MRI data acquisition
Scanning was performed on a 3-T General Electric MR 750 system with gradients of 50 mT/m and an eight-channel head coil for parallel imaging (General Electric, Waukesha, WI, USA). High-resolution images were acquired using a 3D fast SPGR BRAVO pulse sequence: TR, 7.58 ms; TE, 2.936 ms; image matrix, 2562; α = 12°; voxel size, 1 mm × 1 mm × 1 mm; 206 contiguous slices. These structural images were aligned in the near-axial plane defined by the anterior and posterior commissures. Whole-brain functional images were acquired using a spiral-in pulse sequence with sensitivity encoding along the axial plane (TR, 2000 ms; TE, 30 ms; image matrix, 64 × 128; α = 70°; voxel size, 3.8 mm × 3.8 mm × 3.8 mm; 34 contiguous slices).
MRI preprocessing
fMRI data were preprocessed using SPM8 (www.fil.ion.ucl.ac.uk/spm). Images were first realigned to the first image of the series using a six-parameter, rigid-body transformation. The realigned images were then coregistered to each participant’s T1-weighted structural image and normalized to MNI152 space using high-dimensional warping implemented in the VBM8 toolbox. No additional smoothing was applied to the normalized images.
MRI analysis
A univariate GLM was used to create images for the prediction analysis. The model included separate boxcar regressors indicating the onset times for each stimulus, which allowed us to isolate responses to each emotion category. Separate regressors for the rating periods were included in the model but were not of interest. All regressors were convolved with the canonical HRF used in SPM and an additional six covariate regressors modeled for movement effects.
Pattern classification of occipital lobe responses to the film clips was performed using PLS discriminant analysis [following methods in (15)]. The data comprised 444 trials total (2 videos × 7 emotion categories × 32 participants, with four trials excluded because of technical issues during scanning). Measures of classification performance were estimated using eight-fold participant-independent cross-validation, where participants were randomly divided into eight groups; classification models were iteratively trained on data from all but one group, and model performance was assessed on data from the holdout group. This procedure was repeated until all data had been used for training and testing (eight-fold totals). Inference on model performance was made using permutation tests, where the above cross-validation procedure was repeated 1000 times with randomly permuted class labels to produce a null distribution for inference. The number of emotion categories that could be accurately discriminated from one another was estimated using discriminable cluster identification (see Supplementary Text for details). Inference on model weights (i.e., PLS parameter estimates) at each voxel was made via bootstrap resampling with a normal approximated interval.
Definition of regions of interest
A region-of-interest (ROI) approach was used to restrict features for model development and to localize where information about emotions is encoded. We selected several anatomically defined ROIs based on our focus on the visual system. These regions include multiple cytoarchitecturally defined visual areas [i.e., V1, V2, V3v, V3d, V3a, and V4 (43)], the entire occipital lobe (39), and inferotemporal cortex (44). These masks were created using the SPM Anatomy toolbox (60) and the Automated Anatomical Labeling atlas (44).
Supplementary Material
Acknowledgments
Funding: This work was supported by NIH National Institute of Mental Health R01 MH116026 and R21 MH098149 in addition to NIH National Institute on Drug Abuse T32 DA017637-14. Author contributions: Conceptualization: P.A.K. and T.D.W.; investigation: P.A.K. and M.C.R.: methodology; P.A.K., M.C.R., K.S.L., and T.D.W.: software; P.A.K. and T.D.W.: writing—original draft: P.A.K., M.C.R., K.S.L., and T.D.W.; writing—review and editing: P.A.K., M.C.R., K.S.L., and T.D.W.; visualization: P.A.K.; supervision: T.D.W. Competing interests: The authors declare that they have no competing interests. Data and materials availability: All data needed to evaluate the conclusions in the paper are present in the paper and/or the Supplementary Materials. fMRI data are available at https://neurovault.org. The analysis code is available at https://github.com/canlab. Additional data related to this paper may be requested from the authors.
SUPPLEMENTARY MATERIALS
Supplementary material for this article is available at http://advances.sciencemag.org/cgi/content/full/5/7/eaaw4358/DC1
Supplementary Text
Fig. S1. Comparison of different CNN architectures.
Fig. S2. Visual features associated with different emotion schemas.
Fig. S3. Dimensionality of CNN predictions in the holdout dataset estimated with PCA and clustering of classification errors in 20-way classification.
Fig. S4. Surface renders depict where decreases (blue) or increases (red) in fMRI activation are predictive of activation in emotion category units of EmoNet.
Fig. S5. Information about emotion schema is distributed across human visual cortex.
Fig. S6. Decoding EmoNet activation using fMRI responses from different visual areas and a model comprising the entire occipital lobe.
Fig. S7. Results of simulations using repeated random subsampling to assess sample size and power for fMRI experiment I.
Fig. S8. Classification of images containing dogs from ImageNet (68).
Fig. S9. Simulated experiments used to evaluate the bias of the discriminable cluster identification method.
Movie S1. Model predictions for action trailers.
Movie S2. Model predictions for horror trailers.
Movie S3. Model predictions for romantic comedy trailers.
REFERENCES AND NOTES
- 1.J. Tooby, L. Cosmides, The evolutionary psychology of the emotions and their relationship to internal regulatory variables, in Handbook of Emotions, M. Lewis, J. M. Haviland-Jones, L. F. Barrett, Eds. (The Guilford Press, 2008), pp. 114–137. [Google Scholar]
- 2.R. S. Lazarus, Emotions and adaptation: Conceptual and empirical relations, in Nebraska Symposium on Motivation (University of Nebraska Press, 1968), pp. 175–266. [Google Scholar]
- 3.K. R. Scherer, On the nature and function of emotion: A component process approach, in Approaches to Emotion, K. R. Scherer, P. Ekman, Eds. (Erlbaum, 1984), pp. 293–317. [Google Scholar]
- 4.Ekman P., An argument for basic emotions. Cogn. Emot. 6, 169–200 (1992). [Google Scholar]
- 5.Russell J. A., Core affect and the psychological construction of emotion. Psychol. Rev. 110, 145–172 (2003). [DOI] [PubMed] [Google Scholar]
- 6.MacLean P. D., Some psychiatric implications of physiological studies on frontotemporal portion of limbic system (visceral brain). Clin. Neurophysiol. 4, 407–418 (1952). [DOI] [PubMed] [Google Scholar]
- 7.J. Panksepp, Affective Neuroscience: The Foundations of Human and Animal Emotions. Series in Affective Science (Oxford Univ. Press, 1998), pp. xii, 466 pp. [Google Scholar]
- 8.Adolphs R., The biology of fear. Curr. Biol. 23, R79–R93 (2013). [DOI] [PMC free article] [PubMed] [Google Scholar]
- 9.Mayberg H. S., Liotti M., Brannan S. K., McGinnis S., Mahurin R. K., Jerabek P. A., Silva J. A., Tekell J. L., Martin C. C., Lancaster J. L., Fox P. T., Reciprocal limbic-cortical function and negative mood: Converging PET findings in depression and normal sadness. Am. J. Psychiatry 156, 675–682 (1999). [DOI] [PubMed] [Google Scholar]
- 10.Pessoa L., Adolphs R., Emotion processing and the amygdala: From a ‘low road’ to ‘many roads’ of evaluating biological significance. Nat. Rev. Neurosci. 11, 773–783 (2010). [DOI] [PMC free article] [PubMed] [Google Scholar]
- 11.Vuilleumier P., Richardson M. P., Armony J. L., Driver J., Dolan R. J., Distant influences of amygdala lesion on visual cortical activation during emotional face processing. Nat. Neurosci. 7, 1271–1278 (2004). [DOI] [PubMed] [Google Scholar]
- 12.Shuler M. G., Bear M. F., Reward timing in the primary visual cortex. Science 311, 1606–1609 (2006). [DOI] [PubMed] [Google Scholar]
- 13.Haenny P. E., Schiller P. H., State dependent activity in monkey visual cortex. Exp. Brain Res. 69, 225–244 (1988). [DOI] [PubMed] [Google Scholar]
- 14.Sasikumar D., Emeric E., Stuphorn V., Connor C. E., First-pass processing of value cues in the ventral visual pathway. Curr. Biol. 28, 538–548.e3 (2018). [DOI] [PMC free article] [PubMed] [Google Scholar]
- 15.Kragel P. A., LaBar K. S., Multivariate neural biomarkers of emotional states are categorically distinct. Soc. Cogn. Affect. Neurosci. 10, 1437–1448 (2015). [DOI] [PMC free article] [PubMed] [Google Scholar]
- 16.Chang L. J., Gianaros P. J., Manuck S. B., Krishnan A., Wager T. D., A sensitive and specific neural signature for picture-induced negative affect. PLOS Biol. 13, e1002180 (2015). [DOI] [PMC free article] [PubMed] [Google Scholar]
- 17.McAlonan K., Cavanaugh J., Wurtz R. H., Guarding the gateway to cortex with attention in visual thalamus. Nature 456, 391–394 (2008). [DOI] [PMC free article] [PubMed] [Google Scholar]
- 18.Öhman A., Mineka S., The malicious serpent: Snakes as a prototypical stimulus for an evolved module of fear. Curr. Dir. Psychol. Sci. 12, 5–9 (2003). [Google Scholar]
- 19.Miskovic V., Anderson A. K., Modality general and modality specific coding of hedonic valence. Curr. Opin. Behav. Sci. 19, 91–97 (2018). [DOI] [PMC free article] [PubMed] [Google Scholar]
- 20.A. Moors, Appraisal theory of emotion, in Encyclopedia of Personality and Individual Differences, V. Zeigler-Hill, T. K. Shackelford, Eds. (Springer, 2018). [Google Scholar]
- 21.Izard C. E., Basic emotions, natural kinds, emotion schemas, and a new paradigm. Perspect. Psychol. Sci. 2, 260–280 (2007). [DOI] [PubMed] [Google Scholar]
- 22.D. Kahneman, P. Egan, Thinking, Fast and Slow (Farrar, Straus and Giroux, 2011), vol. 1. [Google Scholar]
- 23.Berridge K., Winkielman P., What is an unconscious emotion? (The case for unconscious “liking”). Cognit. Emot. 17, 181–211 (2003). [DOI] [PubMed] [Google Scholar]
- 24.D. E. Rumelhart, P. Smolensky, J. L. McClelland, G. E. Hinton, Schemata and sequential thought processes, in PDP Models, in Parallel Distributed Processing: Explorations in the Microstructures of Cognition (MIT Press, 1986), vol. 2, pp. 7–57. [Google Scholar]
- 25.Cowen A. S., Keltner D., Self-report captures 27 distinct categories of emotion bridged by continuous gradients. Proc. Natl. Acad. Sci. U.S.A. 114, E7900–E7909 (2017). [DOI] [PMC free article] [PubMed] [Google Scholar]
- 26.P. J. Lang, M. M. Bradley, B. N. Cuthbert, “International affective picture system (IAPS): Affective ratings of pictures and instruction manual” (Report no. A-8, University of Florida, 2008).
- 27.Z. Rasheed, M. Shah, Movie genre classification by exploiting audio-visual features of previews, in Object Recognition Supported by User Interaction for Service Robots (IEEE, 2002), vol. 2, pp. 1086–1089. [Google Scholar]
- 28.A. Krizhevsky, I. Sutskever, G. E. Hinton, ImageNet classification with deep convolutional neural networks, in Advances in Neural Information Processing Systems (Neural Information Processing Systems Foundation Inc., 2012), pp. 1097–1105. [Google Scholar]
- 29.J. L. McClelland, D. E. Rumelhart, G. E. Hinton, in The appeal of parallel distributed processing, in Parallel Distributed Processing: Explorations in the Microstructure of Cognition, L. M. James, E. R. David, CPR Group, Eds. (MIT Press, 1986), pp. 7–57. [Google Scholar]
- 30.Khaligh-Razavi S.-M., Kriegeskorte N., Deep supervised, but not unsupervised, models may explain IT cortical representation. PLOS Comput. Biol. 10, e1003915 (2014). [DOI] [PMC free article] [PubMed] [Google Scholar]
- 31.Carroll J. B., An analytical solution for approximating simple structure in factor analysis. Psychometrika 18, 23–38 (1953). [Google Scholar]
- 32.M. M. Bradley, P. J. Lang, The International Affective Picture System (IAPS) in the study of emotion and attention, in Handbook of Emotion Elicitation and Assessment (Oxford Univ. Press, 2007), pp. 29–46. [Google Scholar]
- 33.Mikels J. A., Fredrickson B. L., Larkin G. R., Lindberg C. M., Maglio S. J., Reuter-Lorenz P. A., Emotional category data on images from the International Affective Picture System. Behav. Res. Methods 37, 626–630 (2005). [DOI] [PMC free article] [PubMed] [Google Scholar]
- 34.Tellegen A., Watson D., Clark L. A., On the dimensional and hierarchical structure of affect. Psychol. Sci. 10, 297–303 (1999). [Google Scholar]
- 35.Kohavi R., A study of cross-validation and bootstrap for accuracy estimation and model selection. IJCAI 14, 1137–1145 (1995). [Google Scholar]
- 36.Kurdi B., Lozano S., Banaji M. R., Introducing the open affective standardized image set (OASIS). Behav. Res. Methods 49, 457–470 (2017). [DOI] [PubMed] [Google Scholar]
- 37.Rifkin R., Klautau A., In defense of one-vs-all classification. J. Mach. Learn. Res. 5, 101–141 (2004). [Google Scholar]
- 38.Yamins D. L. K., DiCarlo J. J., Using goal-driven deep learning models to understand sensory cortex. Nat. Neurosci. 19, 356–365 (2016). [DOI] [PubMed] [Google Scholar]
- 39.Lancaster J. L., Woldorff M. G., Parsons L. M., Liotti M., Freitas C. S., Rainey L., Kochunov P. V., Nickerson D., Mikiten S. A., Fox P. T., Automated Talairach atlas labels for functional brain mapping. Hum. Brain Mapp. 10, 120–131 (2000). [DOI] [PMC free article] [PubMed] [Google Scholar]
- 40.Esterman M., Tamber-Rosenau B. J., Chiu Y.-C., Yantis S., Avoiding non-independence in fMRI data analysis: Leave one subject out. Neuroimage 50, 572–576 (2010). [DOI] [PMC free article] [PubMed] [Google Scholar]
- 41.Glasser M. F., Coalson T. S., Robinson E. C., Hacker C. D., Harwell J., Yacoub E., Ugurbil K., Andersson J., Beckmann C. F., Jenkinson M., Smith S. M., Van Essen D. C., A multi-modal parcellation of human cerebral cortex. Nature 536, 171–178 (2016). [DOI] [PMC free article] [PubMed] [Google Scholar]
- 42.Gaser C., Dahnke R., CAT—A computational anatomy toolbox for the analysis of structural MRI data. HBM 2016, 336–348 (2016). [Google Scholar]
- 43.Amunts K., Malikovic A., Mohlberg H., Schormann T., Zilles K., Brodmann’s areas 17 and 18 brought into stereotaxic space—Where and how variable? Neuroimage 11, 66–84 (2000). [DOI] [PubMed] [Google Scholar]
- 44.Tzourio-Mazoyer N., Landeau B., Papathanassiou D., Crivello F., Etard O., Delcroix N., Mazoyer B., Joliot M., Automated anatomical labeling of activations in SPM using a macroscopic anatomical parcellation of the MNI MRI single-subject brain. Neuroimage 15, 273–289 (2002). [DOI] [PubMed] [Google Scholar]
- 45.Kragel P. A., Koban L., Barrett L. F., Wager T. D., Representation, pattern information, and brain signatures: From neurons to neuroimaging. Neuron 99, 257–273 (2018). [DOI] [PMC free article] [PubMed] [Google Scholar]
- 46.Melin A. D., Chiou K. L., Walco E. R., Bergstrom M. L., Kawamura S., Fedigan L. M., Trichromacy increases fruit intake rates of wild capuchins (Cebus capucinus imitator). Proc. Natl. Acad. Sci. U.S.A. 114, 10402–10407 (2017). [DOI] [PMC free article] [PubMed] [Google Scholar]
- 47.Susskind J. M., Lee D. H., Cusi A., Feiman R., Grabski W., Anderson A. K., Expressing fear enhances sensory acquisition. Nat. Neurosci. 11, 843–850 (2008). [DOI] [PubMed] [Google Scholar]
- 48.Seth A. K., Interoceptive inference, emotion, and the embodied self. Trends Cogn. Sci. 17, 565–573 (2013). [DOI] [PubMed] [Google Scholar]
- 49.Barrett L. F., Bliss-Moreau E., Affect as a psychological primitive. Adv. Exp. Soc. Psychol. 41, 167–218 (2009). [DOI] [PMC free article] [PubMed] [Google Scholar]
- 50.Grill-Spector K., Malach R., The human visual cortex. Annu. Rev. Neurosci. 27, 649–677 (2004). [DOI] [PubMed] [Google Scholar]
- 51.Naselaris T., Kay K. N., Nishimoto S., Gallant J. L., Encoding and decoding in fMRI. Neuroimage 56, 400–410 (2011). [DOI] [PMC free article] [PubMed] [Google Scholar]
- 52.Vetter P., Smith F. W., Muckli L., Decoding sound and imagery content in early visual cortex. Curr. Biol. 24, 1256–1262 (2014). [DOI] [PMC free article] [PubMed] [Google Scholar]
- 53.Kriegeskorte N., Mur M., Ruff D. A., Kiani R., Bodurka J., Esteky H., Tanaka K., Bandettini P. A., Matching categorical object representations in inferior temporal cortex of man and monkey. Neuron 60, 1126–1141 (2008). [DOI] [PMC free article] [PubMed] [Google Scholar]
- 54.Mobbs D., Yu R., Rowe J. B., Eich H., FeldmanHall O., Dalgleish T., Neural activity associated with monitoring the oscillating threat value of a tarantula. Proc. Natl. Acad. Sci. U.S.A. 107, 20582–20586 (2010). [DOI] [PMC free article] [PubMed] [Google Scholar]
- 55.I. J. Goodfellow, J. Pouget-Abadie, M. Mirza, B. Xu, D. Warde-Farley, S. Ozair, A. Courville, Y. Bengio, Generative adversarial nets, in Advances in Neural Information Processing Systems (Neural Information Processing Systems Foundation Inc., 2014), pp. 2672–2680. [Google Scholar]
- 56.Adolphs R., How should neuroscience study emotions? by distinguishing emotion states, concepts, and experiences. Soc. Cogn. Affect. Neurosci. 12, 24–31 (2017). [DOI] [PMC free article] [PubMed] [Google Scholar]
- 57.Dan-Glauser E. S., Scherer K. R., The Geneva affective picture database (GAPED): A new 730-picture database focusing on valence and normative significance. Behav. Res. Methods 43, 468–477 (2011). [DOI] [PubMed] [Google Scholar]
- 58.Libkuman T. M., Otani H., Kern R., Viger S. G., Novak N., Multidimensional normative ratings for the International Affective Picture System. Behav. Res. Methods 39, 326–334 (2007). [DOI] [PubMed] [Google Scholar]
- 59.Glasser M. F., Sotiropoulos S. N., Wilson J. A., Coalson T. S., Fischl B., Andersson J. L., Xu J., Jbabdi S., Webster M., Polimeni J. R., van Essen D. C., Jenkinson M.; WU-Minn HCP Consortium , The minimal preprocessing pipelines for the Human Connectome Project. Neuroimage 80, 105–124 (2013). [DOI] [PMC free article] [PubMed] [Google Scholar]
- 60.Eickhoff S. B., Stephan K. E., Mohlberg H., Grefkes C., Fink G. R., Amunts K., Zilles K., A new SPM toolbox for combining probabilistic cytoarchitectonic maps and functional imaging data. Neuroimage 25, 1325–1335 (2005). [DOI] [PubMed] [Google Scholar]
- 61.Colden A., Bruder M., Manstead A. S. R., Human content in affect-inducing stimuli: A secondary analysis of the international affective picture system. Motiv. Emot. 32, 260–269 (2008). [Google Scholar]
- 62.Naselaris T., Kay K. N., Nishimoto S., Gallant J. L., Encoding and decoding in fMRI. Neuroimage 56, 400–410 (2011). [DOI] [PMC free article] [PubMed] [Google Scholar]
- 63.Nili H., Wingfield C., Walther A., Su L., Marslen-Wilson W., Kriegeskorte N., A toolbox for representational similarity analysis. PLOS Comput. Biol. 10, e1003553 (2014). [DOI] [PMC free article] [PubMed] [Google Scholar]
- 64.Kay K. N., Naselaris T., Prenger R. J., Gallant J. L., Identifying natural images from human brain activity. Nature 452, 352–355 (2008). [DOI] [PMC free article] [PubMed] [Google Scholar]
- 65.Efron B., How biased is the apparent error rate of a prediction rule? J. Am. Stat. Assoc. 81, 461–470 (1986). [Google Scholar]
- 66.Haynes J.-D., A primer on pattern-based approaches to fMRI: Principles, pitfalls, and perspectives. Neuron 87, 257–270 (2015). [DOI] [PubMed] [Google Scholar]
- 67.Benson N. C., Jamison K. W., Arcaro M. J., Vu A. T., Glasser M. F., Coalson T. S., Van Essen D. C., Yacoub E., Ugurbil K., Winawer J., Kay K., The human connectome project 7 Tesla retinotopy dataset: Description and population receptive field analysis. J. Vis. 18, 23 (2018). [DOI] [PMC free article] [PubMed] [Google Scholar]
- 68.J. Deng, W. Dong, R. Socher, L.-J. Li, K. Li, L. Fei-Fei, ImageNet: A large-scale hierarchical image database, in IEEE Conference on Computer Vision and Pattern Recognition, 2009. CVPR 2009 (IEEE, 2009), pp. 248–255. [Google Scholar]
Associated Data
This section collects any data citations, data availability statements, or supplementary materials included in this article.
Supplementary Materials
Supplementary material for this article is available at http://advances.sciencemag.org/cgi/content/full/5/7/eaaw4358/DC1
Supplementary Text
Fig. S1. Comparison of different CNN architectures.
Fig. S2. Visual features associated with different emotion schemas.
Fig. S3. Dimensionality of CNN predictions in the holdout dataset estimated with PCA and clustering of classification errors in 20-way classification.
Fig. S4. Surface renders depict where decreases (blue) or increases (red) in fMRI activation are predictive of activation in emotion category units of EmoNet.
Fig. S5. Information about emotion schema is distributed across human visual cortex.
Fig. S6. Decoding EmoNet activation using fMRI responses from different visual areas and a model comprising the entire occipital lobe.
Fig. S7. Results of simulations using repeated random subsampling to assess sample size and power for fMRI experiment I.
Fig. S8. Classification of images containing dogs from ImageNet (68).
Fig. S9. Simulated experiments used to evaluate the bias of the discriminable cluster identification method.
Movie S1. Model predictions for action trailers.
Movie S2. Model predictions for horror trailers.
Movie S3. Model predictions for romantic comedy trailers.