Abstract
The application of bedside ultrasonography in routine clinical practice has dramatically evolved over the last few decades and will likely continue to grow as technological advances lead to enhanced portability and affordability of the equipment. Despite mounting interest, most nephrology fellowship training programs do not offer formal training in renal ultrasonography and there is inertia among practicing nephrologists to adopt this skill as a practice-changing advancement. Lack of familiarity with the topic is considered a key reason for this inertia. Understanding of basic ultrasound physics, instrumentation, principles of optimal image acquisition and interpretation is critical for enhanced efficiency and patient safety while using this tool. Herein, we provide a brief overview of the basic principles of diagnostic renal ultrasonography as well as introduction to common sonographic pathologies encountered in day-to-day nephrology practice with illustrative images.
Keywords: Ultrasound, Kidney, Cyst, Hydronephrosis, Stone, Point of care
Core tip: Point-of-care renal ultrasonography has emerged as a valuable bedside diagnostic tool for non-radiology physicians. It reduces fragmentation of care and quickly provides answers to simple clinical questions thereby enhancing patient care and satisfaction. In addition, using bedside ultrasound as the first line investigation may eliminate unnecessary radiation and contrast exposure. This pictorial review includes a simplified version of the basics of ultrasound instrumentation and image interpretation.
INTRODUCTION
Over the past few decades, point-of-care ultrasonography (POCUS) has emerged as an invaluable adjunct to bedside diagnostic evaluation especially in the field of emergency medicine. Lack of ionizing radiation, non-invasive nature, and advances in portability and affordability of the equipment have made ultrasound a first-line imaging modality for a broad range of indications. While radiology-performed conventional ultrasonography is a comprehensive examination intended to fully explore the area of interest, POCUS performed at the bedside is primarily intended to answer focused questions such as, “does the patient have pericardial effusion?”, “is hydronephrosis present?”, “is the patient short of breath because of hypervolemia?”, etc. and help narrow the differential diagnosis. POCUS has been found so useful in clinical practice that some authors describe it as the fifth pillar of bedside physical examination added to the traditional ones, namely, inspection, palpation, percussion and auscultation[1]. In recent years, an increasing number of internal medicine specialists and subspecialists have been incorporating POCUS into their practice to improve diagnostic timeliness and accuracy. With respect to nephrology practice, sonography of the kidneys is integral to the diagnostic evaluation of acute kidney injury (AKI) and chronic kidney disease (CKD); its performance by the nephrologist can expedite and enhance the consultation process[2]. Moreover, it reduces fragmen-tation of care and enhances patient satisfaction. Though not a difficult skill to learn, performance and interpretation of POCUS does require training in the form of didactics and hands-on instruction. We have previously reported our experience with development of a nephrology-oriented POCUS curriculum for internal medicine residents in our institution, which was received with great enthusiasm and resulted in increased confidence of the residents in identifying structural abnormalities of the kidneys[3]. In this review, we will briefly describe the basics of ultrasonography, technique and interpretation of a normal renal sonogram. In addition, we will discuss the common renal sonographic pathologies encountered in routine nephrology practice. Discussion of volume status assessment by inferior vena cava, lung and focused cardiac ultrasound as well as use of sonography for procedural guidance is beyond the scope of this article.
BASIC ULTRASOUND PHYSICS, MODES AND INSTRUMENTATION
Over the past several years, technological advancements have resulted in the emergence of miniaturized handheld ultrasound equipment that are compact and battery operated; using these devices, POCUS can be readily performed with decent image quality. However, the basic ultrasound physics, modes and principles of image acquisition are essentially unchanged. Sound is a longitudinal mechanical wave produced by vibration and requires a material medium (e.g., air, tissue) to travel. The number of waves that passes through a fixed point in 1 second is defined as frequency and is measured in hertz (Hz). Audible sound has a frequency of 20 to 20000 Hz. Frequencies below this range are called infrasound and those above are called ultrasound. Medical ultrasound imaging uses sound waves of 1 to 20 megahertz (MHz), which is significantly above the limit of human hearing.
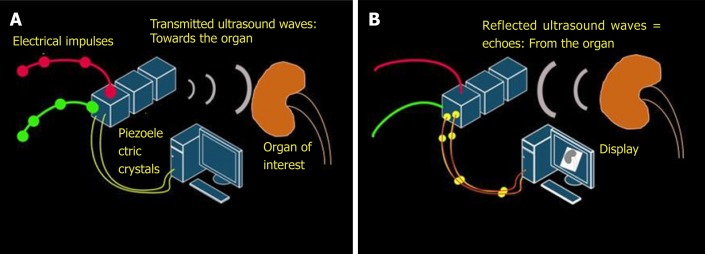
The key working principle of ultrasonography is as follows: When stimulated by an electric current, crystals located in the transducer or probe vibrate and produce ultrasound waves. These are called piezoelectric crystals and typically made up of lead zirconium titanate. The ultrasound waves are then transmitted into the tissues and the transducer now listens for the reflected ultrasound waves, or the echoes. The returning echoes are converted into electrical signals by the piezoelectric crystals and displayed as a 2-dimensional gray-scale image on the monitor[4]. Conversion of mechanical (i.e., sound) energy into electrical energy is called the “piezoelectric effect” and the opposite is called “inverse piezoelectric effect”. Therefore, generation of an ultrasound involves both of these principles (Figure 1).
Figure 1.
Working principles underlying generation of ultrasound image. A: Inverse piezoelectric effect – conversion of electrical energy into mechanical energy (ultrasound waves); B: Piezoelectric effect – conversion of mechanical energy into electrical energy by the piezoelectric crystals located in the transducer. These impulses are displayed on the monitor in the image format.
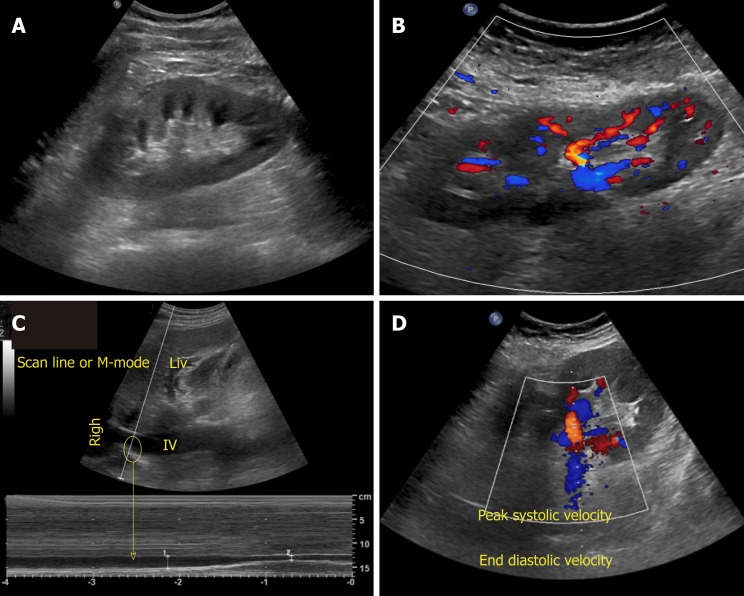
There are various modes of ultrasound display. Examples of the modes that are routinely used in POCUS are B-mode, M-mode, color Doppler and pulsed wave Doppler (Figure 2). B-mode or the brightness mode is the term used to denote the regular 2-dimensional gray-scale display. M-mode or the motion mode obtains an image in the B-mode and displays it graphically as changes over a period of time. It is unidimensional and useful to assess moving structures such as changes in diameter of the inferior vena cava with respiration, excursion of heart valves, pleural sliding etc. In the color Doppler mode, the velocity of mobile acoustic interfaces (typically blood cells) is measured as a shift in frequency, and represented as a range of colors: Red color denotes flow towards the transducer and blue away from the transducer. In pulsed wave Doppler, the velocity and direction of the blood flow are displayed graphically and audibly. If blood is moving away from the transducer, a lower frequ-ency (negative deflection) is detected and if it is moving toward the transducer, a higher frequency (positive deflection) is detected[5]. In nephrology, doppler modality is helpful in assessing renal blood flow and measuring resistive indices in transplanted kidneys.
Figure 2.
Commonly used modes in nephrology-oriented point of care ultrasonography. A: B-mode: Grey-scale image of the left kidney; B: Color Doppler mode: Blood flow inside the kidney is indicated by red and blue colors; C: M-mode: Variations in diameter of the inferior vena cava over time at the area of interest (circle); D: Pulsed wave Doppler: Transverse view of the kidney with graphic representation of flow in the renal artery.
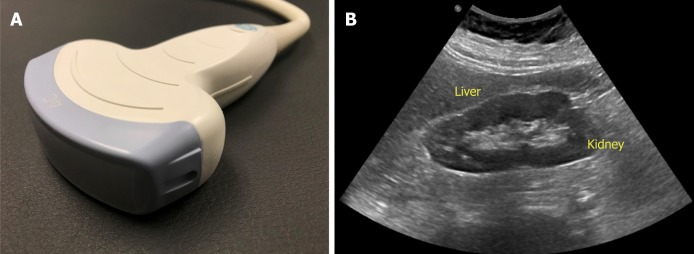
The probe used to perform abdominal sonography is the curvilinear or convex array probe, which has a lower frequency (typically 2 to 5 MHz) and provides a wide, fan-shaped scanning area on the monitor (Figure 3). Frequency of the probe determi-nes depth of penetration and image resolution; higher frequency probes provide less penetration of the ultrasound waves through the tissue planes, but generate higher resolution images. Therefore, superficial applications such as dialysis catheter placement and evaluation of the arteriovenous fistula are performed using high frequency probes (typically 6 to 15 MHz). Conversely, low frequency probes provide deeper penetration and are ideal for abdominal and cardiac applications. Cardiac probe or the phased array probe is a low frequency probe as well, the main difference being that it has a smaller footprint or face of the probe, which allows better manipulation in the rib interspaces.
Figure 3.
Curvilinear probe (A) used for abdominal applications (B) example of an image obtained using this probe.
IMAGE ORIENTATION AND INTERPRETATION
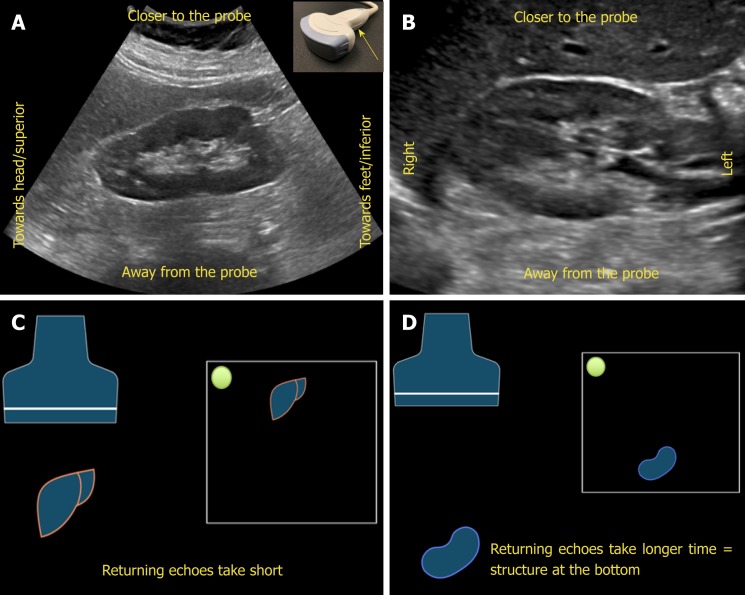
Understanding image orientation is an important component of accurate interpre-tation. For instance, if a cyst is noted on one of the poles of the kidney, how do we know if it is superior pole or the inferior, especially if liver or spleen is not seen in the image? Every ultrasound transducer has a probe marker along one side of its head. This marker can be a light, dot, or a linear ridge and corresponds to indicator on the screen, which is typically a dot or letter denoting the manufacturer. During standard abdominal exam, the probe marker should be pointed toward patient’s head when obtaining longitudinal images and to the right in the transverse plane. Therefore, if the cyst in above example is on the pole closer to the screen indicator, it is towards the head of the patient, i.e., superior pole of the kidney in the longitudinal plane.
Now, what determines which structure is on the top of the image and which is at the bottom? The underlying principle is “time is equal to distance”. Echoes returning from a structure that is farther from the probe takes longer time compared to those returning from the structure, that is closer to the probe and that farther structure is portrayed at the bottom of the screen, nearer one on the top. Therefore, the top part of the image represents “anterior” or “lateral” aspect of the abdomen depending on the scanning plane used (Figure 4).
Figure 4.
Orientation of the image. A, B: Ultrasound image of the (A) longitudinal and (B) transverse views of the right kidney demonstrating the image orientation; C, D: Cartoon illustrating that echoes returning from a structure that is farther from the probe take longer time compared to those returning from the structure that is closer to the probe and that farther structure is portrayed at the bottom of the screen and the nearer one on the top. Note that the arrow in Figure 4A points to the probe marker and the green dot represents indicator on the screen.
The next concept of image interpretation is “relative echogenicity”. Echogenicity refers to how bright or dark something appears in the gray scale ultrasound image; the brighter something appears, the more echogenic it is. In other words, the brighter structure makes strong echoes or returning sound waves. Echogenicity is “relative” to the surrounding structures as the ultrasound image is typically composed of 256 different shades of grey and each shade can be both brighter and darker relative to other shades, unless it is completely “white” or “black” (Figure 5). The physical property of the tissue that determines its echogenicity is called “acoustic impedance”, which is defined as the resistance for propagation of ultrasound waves. This varies according to the density of the material ultrasound passes through[6]. A structure that reflects most of the sound waves back will appear bright (hyperechoic); bone (e.g., ribs), fibrous tissue (e.g., diaphragm, renal capsule) and adipose tissue (e.g., renal sinus fat) are very echogenic and therefore appear bright on abdominal ultrasono-graphy images. Air is also a strong reflector of the ultrasound beam and appears bright, making it difficult to visualize structures behind it. Typically, the kidneys are easily identifiable because renal capsule (consisting of thin fibrous tissue) which is next to fat appears bright and makes the organ well demarcated. Solid organs, such as the liver and spleen, have intermediate echogenicity, and the kidney cortex is normally isoechoic (equal in brightness) or hypoechoic (darker) compared with the normal liver or normal spleen[7,8]. Fluid (e.g., blood, urine, serous fluid in cysts) is an excellent transmitter of sound waves and appears black (anechoic).
Figure 5.
Illustration of “relative echogenicity”. The circular area in the center is hyperechoic (brighter), isoechoic (similar brightness), hypoechoic (darker) and anechoic (black) compared to the surrounding area respectively. Echogenicity of the commonly encountered structures on renal sonography are listed inside the circles. Note that renal cortex can be either isoechoic or hypoechoic compared to that of normal liver.
In this context, an adjustable feature of the machine called “gain” is noteworthy. The sonographer can manipulate the brightness of the image by increasing or decreasing the gain. By increasing the gain, the ultrasound machine allows processing of more incoming echoes, creating a brighter image. Conversely, a darker image is obtained when the gain is decreased. When a part of the image is optimal and the rest of it is too bright or too dark, a feature known as “time gain compensation” allows the operator to adjust the image brightness at specific depths[5].
SONOGRAPHIC EVALUATION OF THE KIDNEYS AND THE BLADDER
Technique
As mentioned above, ultrasound examination of the kidney is usually performed with a low frequency curvilinear transducer. Higher frequencies may be needed while evaluating renal transplant patients, when the allograft location is very superficial. Imaging of the right kidney is easier than that of the left kidney as the liver provides a large acoustic window (i.e., we are looking at the kidney “through” the liver using it as a window) in contrast to the spleen on the left. Examination is typically performed in the supine position, although lateral decubitus, oblique or even prone positions may be required for visualization of the left kidney due to overlying bowel gas[9]. To acquire longitudinal views of the kidney, the examination is usually started with the probe positioned in the mid axillary line at tenth rib interspace with the probe marker pointing towards patient’s head. The probe may have to be slided superiorly or inferiorly depending on the patient’s body habitus. Once the entire long axis of the kidney is in view, the probe should be fanned anteriorly and posteriorly to image it completely. The probe is then rotated 90 degrees counterclockwise (probe marker now faces right of the patient) to obtain a short axis or transverse view of the kidney. Now it is fanned to view the kidney from upper to lower pole to ensure complete examination. Comprehensive renal Doppler imaging consists of direct visualization of renal arteries and veins, measurement of blood velocity, and analysis of pulsed wave doppler waveforms (including resistive index calculation) in segmental arteries. Renal artery evaluation is technically difficult due to poor insonation angles (should be less than 60 degrees) overlying bowel gas, and the frequent occurrence of multiple arteries. It is of note that renal artery evaluation has a high failure rate (up to 30%) even when performed by expert sonographers[9]. When detailed evaluation is not possible or deemed unnecessary, we recommend obtaining at least one color doppler image in each plane as it would help differentiating vessels from dilated collecting system and also identify small stones. This will be discussed further in the latter sections of the manuscript.
With respect to ultrasound examination of the transplanted kidney, the surgical anatomy should be confirmed and comparison with prior studies be made whenever possible. The kidney is easily identifiable as it is usually palpable in the right or left pelvis. Longitudinal and transverse views of the transplanted kidney should be obtained and special attention be paid to perinephric space for any evidence of fluid collection. If a ureteral stent is in place, an attempt should be made to determine the proximal and distal extent of the stent[10]. Color Doppler images of the entire kidney provide a global assessment of transplant renal perfusion and assess for vascular abnormalities. Measurement of resistive indices using pulsed wave Doppler is important for transplanted kidneys as higher values may serve as a clue to graft rejection. Moreover, it has been shown that renal transplant recipients with high resistive index of at least 0.80 have higher mortality in the first 2 years post-transplant compared with those with lower values[11]. The resistive index measures the degree of intrarenal arterial impedance and is calculated as follows: [(PSV – EDV)/PSV], where PSV is peak systolic velocity and EDV is end diastolic velocity. Resistive index is calculated at the level of arcuate arteries at corticomedullary junction or the larger segmental and interlobar vessels (preferred); the value of 0.7 is used as the threshold to discriminate between normal and pathologic resistance to flow[12]. Too low values may indicate prerenal state or lack of good blood flow to the transplanted kidney. Figure 6 demonstrates resistive indices in arcuate arteries in a transplanted kidney.
Figure 6.
Images of the transplanted kidney demonstrating resistive indices in the superior, middle and inferior arcuate arteries (at corticomedullary junction; sample indicated by yellow circle), which were calculated as 0.61, 0.64 and 0.60 respectively and EDV = end diastolic velocity.
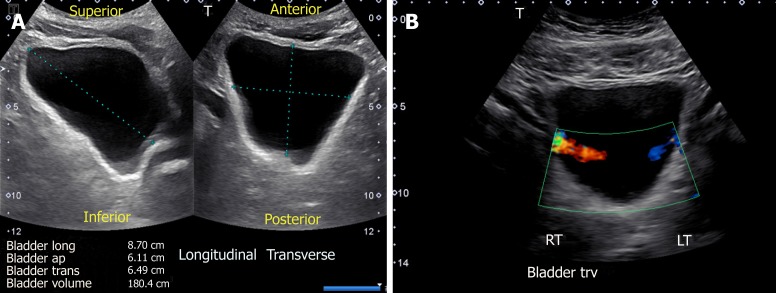
Sonography is a simple and useful tool in the evaluation of the urinary bladder, and should be performed in any patient with dilated collecting system. The examination is performed with the patient in supine position with suprapubic area exposed. The probe is placed sagittally in the midline above the pubic symphysis with probe marker towards patient’s head to obtain longitudinal view of the bladder. Then it should be angled laterally and swept to left and right to examine the lateral borders. The probe is then rotated 90 degrees counter clockwise to obtain the transverse view and swept superior to inferior to image the bladder completely. The volume of the bladder is estimated by orthogonal measurements, assuming it to be an ellipsoid (= 0.52 × the three orthogonal dimensions)[13] (Figure 7A).
Figure 7.
Urinary bladder ultrasound demonstrating (A) bladder volume measurement: Length, antero-posterior and transverse measurements are obtained and multiplied by 0.52 to obtain the approximate amount of urine volume and (B) color Doppler image of the bladder showing ureteral jets.
Normal features
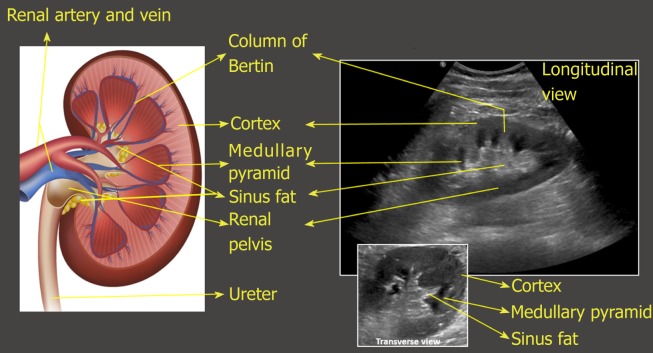
On the sonogram, renal capsule is echogenic and makes the bean shaped organ easily identifiable. Kidney length in adults is typically about 10–12 cm but varies with body size. Renal parenchyma is composed of two distinct zones, the outer cortex and the inner medulla, which is organized into pyramids. As mentioned before, the renal cortex is either isoechoic or hypoechoic (more commonly) compared with the normal liver or normal spleen. The medullary pyramids are hypoechoic or anechoic com-pared to cortex. The renal cortical tissue extends into the medulla separating pyramids in the form of columns called “columns of Bertin”. It is important to make a note of this anatomical feature as these columns can sometimes hypertrophy and mimic a neoplasm[14]. Unlike a true neoplasm, the hypertrophied column of Bertin is in continuity with, and of similar appearance to normal cortex, and the renal outline is typically preserved. The sinus fat is echogenic and occupies major part of the inner kidney. The collecting system is usually not visualized unless distended owing to its small caliber and the surrounding echogenic sinus fat[15] (Figure 8). However, the collecting system of a well-functioning transplanted kidney is often slightly dilated, likely because of a combination of an increased volume of urine produced (i.e., acting as the sole kidney) and loss of the ureter’s tonicity from denervation[16]. In the transverse section, the mid portion of the kidney is C-shaped with the vessels entering and leaving through the hilum (Figure 2D) and the poles appear circular.
Figure 8.
Illustration of longitudinal section of the kidney with corresponding ultrasound image. Transverse view of the kidney is also shown. Note that the most echogenic part of the kidney is sinus fat, and calyces and ureter are not usually visible unless distended. Renal pelvis is hypoechoic but not usually “black” (anechoic) unless there is hydronephrosis.
Urinary bladder appears as an anechoic fluid-filled structure (urine is black on ultrasound) located in the mid pelvis. A full bladder is necessary to comprehensively evaluate the characteristics of its walls, contents and pelvic organs. Ureteric orifices, if visible, appear as small echogenic protuberances on the posterior aspect. Urine passes down the ureters in pulses, which can be detected upon entry into the base of the bladder. These ureteral “jets” (Figure 7B) are best detected in the Doppler mode and provide evidence of ureteral patency[15]. While the presence of strong jets bilaterally goes against obstruction, their absence does not rule in obstructive uropathy. More-over, their practical utility is limited and there is disagreement among various specialties about their necessity and clinical relevance[17].
COMMON SONOGRAPHIC ABNORMALITIES
Abnormalities of the renal size and echogenicity
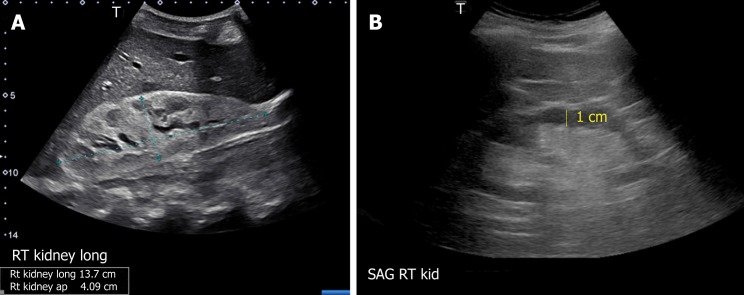
Though the normal pole-to-pole kidney length in adults is 10-12 cm, it varies with body size. While nomograms based on large population studies are not available unlike in children[13,18], there exists a formula to estimate the kidney size: Kidney length (mm) = 49.18 + 0.21 × weight (kg) + 0.27 × height (cm). However, this was based on computed tomography measurements[19]. When measured appropriately, kidney length may help distinguish AKI from CKD as it is expected to decrease in patients with CKD[8], though patients with diabetic nephropathy are known to have relatively large kidneys. Large kidneys in AKI may result from infiltrative diseases (e.g., multiple myeloma, amyloidosis) (Figure 9A), acute glomerulonephritis and acute interstitial nephritis (due to edema and inflammatory infiltrates) and renal vein thrombosis (edema from congestion)[7]. In addition to length, assessment of renal cortical and/or parenchymal thickness is helpful in distinguishing AKI from CKD. Cortical thickness is measured from the base of the medullary pyramid to the outer margin of the kidney. It is generally around 7-10 mm, being thicker at the poles[20,21]. Cortical thickness is expected to be reduced in CKD (Figure 9B). When the medullary pyramids are not clearly visible, which is not uncommon, parenchymal thickness should be measured from outer margin of the kidney to tip of the pyramid or till the sinus fat is visible, which is usually 1.5–2.0 cm[13].
Figure 9.
Renal sonogram demonstrating (A) large echogenic kidney in a patient with multiple myeloma and (B) thin parenchyma approximately 1 cm in a patient with chronic kidney disease.
Echogenicity of the renal cortex relative to liver or spleen can be evaluated both qualitatively and quantitatively[22], though qualitative method is commonly used. Increased cortical echogenicity is commonly attributed to CKD and has been correlated with interstitial fibrosis, tubular atrophy, and glomerulosclerosis in histologic studies[23]. However, increased echogenicity can also be seen in AKI where inflammatory infiltrates and proteinaceous casts reflect sound waves (e.g., acute glomerulonephritis, acute tubular necrosis). Decreased cortical echogenicity usually results from interstitial edema in cases of inflammation or infection.
Hydronephrosis
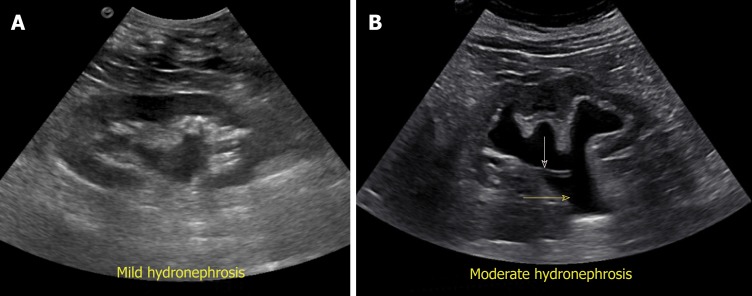
Exclusion of urinary tract obstruction as a cause for AKI is one of the commonest indications for renal POCUS. Hydronephrosis appears as branching, “interconnected” areas of decreased echogenicity (anechoic in general, indicating the presence of fluid) in the renal collecting system area. The source of obstruction is usually located distal to the kidney, e.g., a stone in the pelviureteric junction, ureter or ureterovesical junction or bladder outlet obstruction from a stone, mass or enlarged prostate. As the severity of hydronephrosis increases, the urine moves proximally into the kidney exerting pressure on the parenchyma. While there is no universally accepted grading system but in routine clinical practice, we classify hydronephrosis as mild moderate and severe. In mild hydronephrosis, there is dilatation of the renal pelvis and calyces but the pelvicalyceal pattern is retained. In moderate hydronephrosis, medullary pyramids start to flatten due to back pressure in addition to dilatation of pelvicalyceal system. In severe cases, renal pelvis and calyces appear ballooned and cortico-medullary differentiation is lost making the cortex thin (Figure 10).
Figure 10.
Grading of hydronephrosis. A: Note that as the severity of hydronephrosis increases, the urine (anechoic structure) moves proximally into the kidney exerting pressure on the parenchyma; B: White arrow points to ureteral stent and yellow arrow indicates dilated proximal ureter.
False-negative findings can occur in the setting of acute or partial obstruction, volume depletion and retroperitoneal fibrosis[24,25]. Conversely, presence of hydrone-phrosis does not always indicate pathologic urinary obstruction. For example, a large diuresis can distend the intrarenal collecting system as with congenital nephrogenic diabetes insipidus[26]. Pregnancy is another well-known example where dilatation of the collecting system and ureters begins in the first trimester and persists for a few weeks postpartum[27] due to smooth muscle relaxing effect of progesterone and compression of the gravid uterus on the ureters.
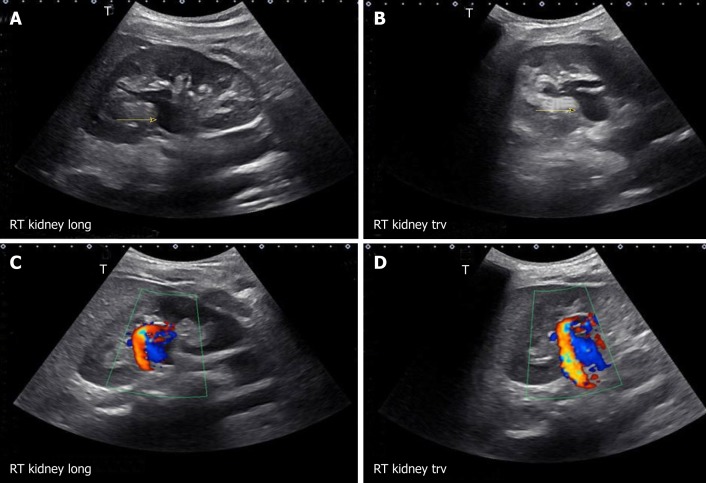
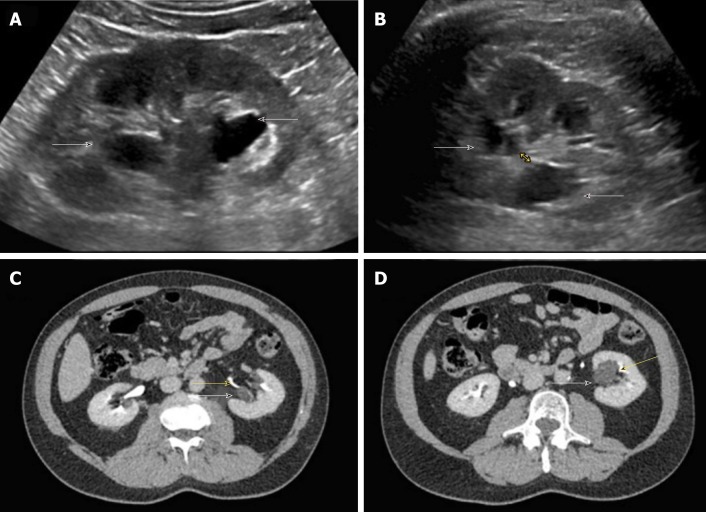
There are certain conditions that can mimic hydronephrosis, which physicians performing POCUS need to be aware of. Renal vessels or vascular malformations are common amongst those and can be easily differentiated using color Doppler imaging (Figure 11)[28]. Parapelvic cysts can also mimic hydronephrosis on a renal sonogram because of their hypoechoic nature and close proximity to the collecting system. Hydronephrosis appears as branching, “interconnected” anechoic area, while parapelvic cysts are seen as “noncommunicating” cystic masses close to the renal pelvis. In addition, a dilated pelvicalyceal system has a cauliflower appearance, whereas a parapelvic cyst is more spherical[29,30]. When the sonogram is not clear enough, a computed tomogram (CT scan) with contrast should be considered to differentiate between these two conditions (Figure 12), especially if the patient presents with renal dysfunction. Extrarenal pelvis is an anatomical variant that can be confused with hydronephrosis. It appears as a large hypoechoic mass just outside the renal sinus and unlike hydronephrosis, it is not associated with dilated calyces, parenchymal thinning, hydroureter, or enlarged kidney per se[31].
Figure 11.
Longitudinal and transverse gray-scale renal ultrasound images demonstrating anechoic region in the mid-kidney suggestive of mild hydronephrosis in the top panel. Doppler images demonstrating prominent arteriovenous flow suggestive of vascular malformation are shown in the bottom panel. Adapted from reference No. 29, first author’s previous work, published under CC BY-NC 4.0 license.
Figure 12.
Renal sonogram. A, B: Sagittal (A) and transverse (B) views of the left kidney showing hypoechoic areas in the pelvic area (arrows) suggestive of hydronephrosis; C, D: However, on the transverse view, these areas do not seem to be connected with one another (double‐headed arrow) and computed tomography (CT) scan with contrast demonstrating (C) and parapelvic cysts (arrows) that are separate from the contrast‐filled collecting system (yellow arrows) (D). Adapted from reference no. 30, first author’s previous work, published under CC BY-NC 4.0 license.
Obstructed urinary bladder
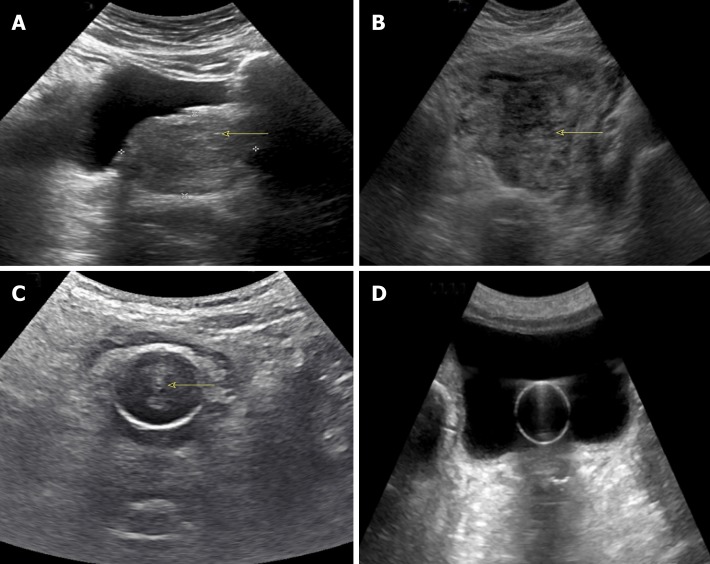
Evaluation of urinary tract obstruction is never complete without bladder examina-tion. POCUS is a non-invasive way of measuring post void residual urine volume, which may be helpful when bladder outlet obstruction is suspected. It may also reveal abnormalities such as prostatomegaly, bladder mass, stone or even obstructed Foley catheter (Figure 13).
Figure 13.
Urinary bladder ultrasound. A: Enlarged prostate (arrow) compressing the urinary bladder; B: Heterogeneous solid mass (arrow) occupying almost the entire bladder; C: Normal appearance of a decompressed bladder with Foley catheter: The empty bladder with functioning catheter is difficult to visualize, and the hypoechoic/anechoic fluid-filled balloon (arrow) is the only portion visible; D: Distended bladder filled with urine despite the presence of Foley catheter indicating catheter malfunction.
Kidney stones
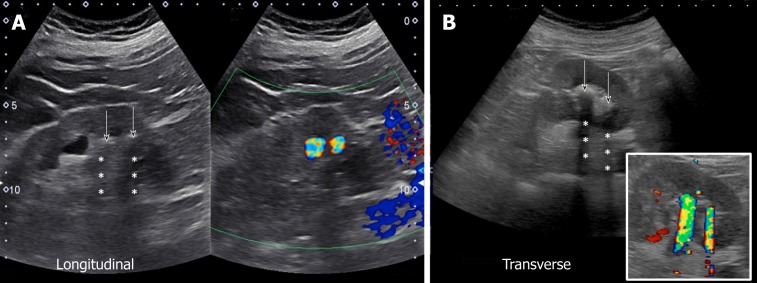
Although sonography is less sensitive than CT for detecting kidney stones, it is the preferred initial imaging modality as there is no risk of radiation, is reproducible, inexpensive, and the outcome is not significantly different for patients with suspected urolithiasis undergoing initial ultrasound exam compared to those undergoing CT scan[32,33]. On gray-scale images, stones appear as hyperechoic or bright structures with a posterior “acoustic shadow”. Acoustic shadowing is the black area or signal void seen beyond structures that do not transmit ultrasound waves[34]. In the Doppler mode, stones exhibit “twinkling sign” or artifact, which refer to a rapidly alternating focus of color Doppler signals mimicking turbulent flow and is more pronounced with rougher stones. It is of note that this sign is more sensitive than shadowing for detection of small stones[35], which we found to be very helpful in our practice (Figure 14).
Figure 14.
Renal sonogram demonstrating grey-scale (A) and corresponding color Doppler (B) images of the kidney demonstrating acoustic shadowing and twinkling sign respectively, which is diagnostic of stones. Arrows point to the hyperechoic stones and asterisks indicate shadowing.
Kidney cysts
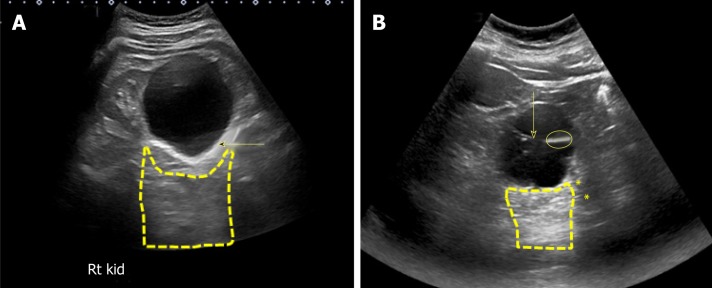
Cysts in the kidney are other common abnormality encountered in clinical practice. They may be sporadic, hereditary (e.g., autosomal dominant polycystic kidney disease, tuberous sclerosis complex), acquired cystic kidney disease, or occasionally malignant[9,15]. Cysts can be simple or complex. The diagnosis of a simple benign renal cyst on sonography requires the presence of all the following findings: A well-defined, round, anechoic structure, imperceptible near wall and thin echogenic far wall, and increased through transmission manifested by “acoustic enhancement”. Acoustic enhancement refers to the increased intensity of echoes (bright area) relative to surrounding tissues, distal to a low-attenuating structure such as a cyst[36]. This phenomenon is not specific to cysts and can be seen with any fluid containing space such as a blood vessel or urinary bladder. Any lesion that does not meet criteria for a simple cyst is considered a complex cyst and may be characterized by findings such as irregular thickened walls, septations, internal echoes, and calcifications (Figure 15). In this context, it is important to note that the utility of sonography in the Bosniak classification of cysts is limited, as the detection of neovascularization in malignant lesions, indicated by contrast enhancement of solid components, septa or walls, is an essential part of the classification. However, it is known that ultrasound may demon-strate internal septa better than CT and magnetic resonance imaging. Therefore, it has been suggested that simple and minimally complex (Bosniak I and II) cysts may be followed with sonography alone[37,38].
Figure 15.
Renal sonogram demonstrating a large simple cyst in the lower pole of the right kidney. A: Arrow points to echogenic far wall and the contained area posterior to the cyst represents acoustic enhancement; B: Example of a complex cyst with septations (arrow). The image shows both acoustic enhancement from the cyst (contained area with yellow outline) and acoustic shadowing (asterisks) from calcifications in the septa (circle).
Kidney infections
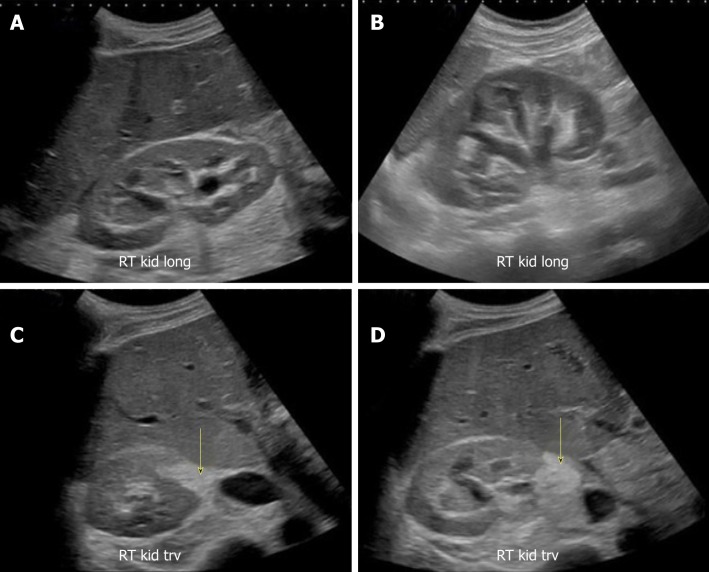
Though commonly obtained, renal ultrasound is relatively an insensitive test for the diagnosis of acute pyelonephritis as sonographic abnormalities are found in only about 20%-24% of the patients[39,40]. The positive findings of pyelonephritis on sonography, if present, may include congenital anomalies and a variety of changes in the renal parenchyma such as hydronephrosis, unilateral increase in kidney size, loss of renal sinus fat due to edema, changes in echogenicity due to hemorrhage (hyperechoic) or edema (hypoechoic), abscess formation, and areas of hypoperfusion (visible on Doppler mode)[41]. However, POCUS may be helpful in evaluating for pyonephrosis (pus in the collecting system), which is characterized by the presence of low-level echoes within the collecting system, especially when iodinated contrast use for CT is contraindicated. We recently reported a case of pyonephrosis that was missed on non-contrast CT scan but diagnosed with renal sonography leading to positive patient outcome (Figure 16)[42].
Figure 16.
Renal sonogram images. A, B: Bilateral moderate hydronephrosis and hydroureter; C, D: Transverse views of the right kidney showing echogenic debris (arrows) in the right collecting system in addition to fluid–fluid levels, suggestive of pyonephrosis. Adapted from reference No. 43, first author’s previous work, published under CC BY-NC 4.0 license.
BEYOND THE KIDNEY
In addition to diagnostic renal sonography, assessment of volume status is an impor-tant application of POCUS in the practice of nephrology. Lung, inferior vena cava and focused cardiac ultrasound are relatively easy to learn and immensely useful tools for nephrologists, especially in the care of end-stage renal disease (ESRD) patients[43]. For example, B-lines in the lung suggestive of increased lung water are detected in ESRD patients even in the absence of symptoms such as dyspnea or peripheral edema[44]. Similarly, data suggests that inferior vena cava measurements by sonography are accurate to predict high or low central venous pressure in dialysis patients[45]. Focused bedside echocardiography is another must-have skill for the nephrologists, which helps quick detection of life-threatening conditions such as pericardial effusion. Moreover, focused echo might detect dynamic abnormalities (e.g., regional wall motion abnormalities) during hemodialysis, which would not be otherwise detected during elective procedure in the cardiology or radiology department[43].
CONCLUSION
POCUS is quickly becoming an indispensable bedside diagnostic tool for non-radiology physicians. Having a basic understanding of the ultrasound physics, modes used for image generation and ability to distinguish normal from abnormal studies optimizes the scans being performed and enhances the use of ultrasound in patient care. At the same time, it is important to recognize that while POCUS alleviates the need for further investigations in some cases, it is not always a “replacement” for formal ultrasonography. Radiology consultation should be sought even when is slightest doubt about the diagnosis. Furthermore, as with any other skill, the use of POCUS requires dedicated education and hands-on training. Currently several national and local organizations offer training and certification for practicing physicians in various aspects of POCUS but the content and quality of these programs is not held to any universal standard. Therefore, it is imperative that we come up with subspecialty-specific guidelines defining the scope of practice and competency assessment to ensure quality control, which in turn is essential for safe and efficient patient care.
Footnotes
Conflict-of-interest statement: The authors have no conflicts of interest to declare.
Manuscript source: Unsolicited manuscript
Peer-review started: January 10, 2019
First decision: January 26, 2019
Article in press: March 12, 2019
Specialty type: Urology and nephrology
Country of origin: United States
Peer-review report classification
Grade A (Excellent): 0
Grade B (Very good): B, B
Grade C (Good): C
Grade D (Fair): 0
Grade E (Poor): 0
P-Reviewer: Ekpenyong CEE, Robles NR, Silva ACS S-Editor: Ji FF L-Editor: A E-Editor: Wang J
Contributor Information
Abhilash Koratala, Division of Nephrology, Hypertension and Renal Transplantation, University of Florida, Gainesville, FL 32610-0224, United States. akoratsla@ufl.edu.
Deepti Bhattacharya, Division of Nephrology, Hypertension and Renal Transplantation, University of Florida, Gainesville, FL 32610-0224, United States.
Amir Kazory, Division of Nephrology, Hypertension and Renal Transplantation, University of Florida, Gainesville, FL 32610-0224, United States.
References
- 1.Narula J, Chandrashekhar Y, Braunwald E. Time to Add a Fifth Pillar to Bedside Physical Examination: Inspection, Palpation, Percussion, Auscultation, and Insonation. JAMA Cardiol. 2018;3:346–350. doi: 10.1001/jamacardio.2018.0001. [DOI] [PubMed] [Google Scholar]
- 2.Kaptein MJ, Kaptein EM. Focused Real-Time Ultrasonography for Nephrologists. Int J Nephrol. 2017;2017:3756857. doi: 10.1155/2017/3756857. [DOI] [PMC free article] [PubMed] [Google Scholar]
- 3.Koratala A, Bhattacharya D, Kazory A. Helping patients and the profession: Nephrology-oriented point-of-care ultrasound program for internal medicine residents. Clin Nephrol. 2018 doi: 10.5414/CN109652. [DOI] [PubMed] [Google Scholar]
- 4.Lieu D. Ultrasound physics and instrumentation for pathologists. Arch Pathol Lab Med. 2010;134:1541–1556. doi: 10.5858/2009-0730-RA.1. [DOI] [PubMed] [Google Scholar]
- 5.Enriquez JL, Wu TS. An introduction to ultrasound equipment and knobology. Crit Care Clin. 2014;30:25–45, v. doi: 10.1016/j.ccc.2013.08.006. [DOI] [PubMed] [Google Scholar]
- 6.Abu-Zidan FM, Hefny AF, Corr P. Clinical ultrasound physics. J Emerg Trauma Shock. 2011;4:501–503. doi: 10.4103/0974-2700.86646. [DOI] [PMC free article] [PubMed] [Google Scholar]
- 7.Faubel S, Patel NU, Lockhart ME, Cadnapaphornchai MA. Renal relevant radiology: use of ultrasonography in patients with AKI. Clin J Am Soc Nephrol. 2014;9:382–394. doi: 10.2215/CJN.04840513. [DOI] [PMC free article] [PubMed] [Google Scholar]
- 8.Ozmen CA, Akin D, Bilek SU, Bayrak AH, Senturk S, Nazaroglu H. Ultrasound as a diagnostic tool to differentiate acute from chronic renal failure. Clin Nephrol. 2010;74:46–52. [PubMed] [Google Scholar]
- 9.Gulati M, Cheng J, Loo JT, Skalski M, Malhi H, Duddalwar V. Pictorial review: Renal ultrasound. Clin Imaging. 2018;51:133–154. doi: 10.1016/j.clinimag.2018.02.012. [DOI] [PubMed] [Google Scholar]
- 10.American College of Radiology (ACR); Society for Pediatric Radiology (SPR); Society of Radiologists in Ultrasound (SRU); American Institute of Ultrasound in Medicine (AIUM) AIUM practice guideline for the performance of an ultrasound examination of solid-organ transplants. J Ultrasound Med. 2014;33:1309–1320. doi: 10.7863/ultra.33.7.1309. [DOI] [PubMed] [Google Scholar]
- 11.Naesens M, Heylen L, Lerut E, Claes K, De Wever L, Claus F, Oyen R, Kuypers D, Evenepoel P, Bammens B, Sprangers B, Meijers B, Pirenne J, Monbaliu D, de Jonge H, Metalidis C, De Vusser K, Vanrenterghem Y. Intrarenal resistive index after renal transplantation. N Engl J Med. 2013;369:1797–1806. doi: 10.1056/NEJMoa1301064. [DOI] [PubMed] [Google Scholar]
- 12.Granata A, Fiorini F, Andrulli S, Logias F, Gallieni M, Romano G, Sicurezza E, Fiore CE. Doppler ultrasound and renal artery stenosis: An overview. J Ultrasound. 2009;12:133–143. doi: 10.1016/j.jus.2009.09.006. [DOI] [PMC free article] [PubMed] [Google Scholar]
- 13.O'Neill WC. Renal relevant radiology: use of ultrasound in kidney disease and nephrology procedures. Clin J Am Soc Nephrol. 2014;9:373–381. doi: 10.2215/CJN.03170313. [DOI] [PMC free article] [PubMed] [Google Scholar]
- 14.Leekam RN, Matzinger MA, Brunelle M, Gray RR, Grosman H. The sonography of renal columnar hypertrophy. J Clin Ultrasound. 1983;11:491–494. doi: 10.1002/jcu.1870110907. [DOI] [PubMed] [Google Scholar]
- 15.Niyyar VD, O'Neill WC. Point-of-care ultrasound in the practice of nephrology. Kidney Int. 2018;93:1052–1059. doi: 10.1016/j.kint.2017.11.032. [DOI] [PubMed] [Google Scholar]
- 16.Kolofousi C, Stefanidis K, Cokkinos DD, Karakitsos D, Antypa E, Piperopoulos P. Ultrasonographic features of kidney transplants and their complications: an imaging review. ISRN Radiol. 2012;2013:480862. doi: 10.5402/2013/480862. [DOI] [PMC free article] [PubMed] [Google Scholar]
- 17.Delair SM, Kurzrock EA. Clinical utility of ureteral jets: disparate opinions. J Endourol. 2006;20:111–114. doi: 10.1089/end.2006.20.111. [DOI] [PubMed] [Google Scholar]
- 18.Dinkel E, Ertel M, Dittrich M, Peters H, Berres M, Schulte-Wissermann H. Kidney size in childhood. Sonographical growth charts for kidney length and volume. Pediatr Radiol. 1985;15:38–43. doi: 10.1007/BF02387851. [DOI] [PubMed] [Google Scholar]
- 19.Harmse WS. Normal variance in renal size in relation to body habitus. SAJR. 2011;15:355. [Google Scholar]
- 20.Abrams HL. Quantitative derivates of renal radiologic studies. An overview. Invest Radiol. 1972;7:240–279. doi: 10.1097/00004424-197207000-00008. [DOI] [PubMed] [Google Scholar]
- 21.Miletić D, Fuckar Z, Sustić A, Mozetic V, Stimac D, Zauhar G. Sonographic measurement of absolute and relative renal length in adults. J Clin Ultrasound. 1998;26:185–189. doi: 10.1002/(sici)1097-0096(199805)26:4<185::aid-jcu1>3.0.co;2-9. [DOI] [PubMed] [Google Scholar]
- 22.Manley JA, O'Neill WC. How echogenic is echogenic? Quantitative acoustics of the renal cortex. Am J Kidney Dis. 2001;37:706–711. doi: 10.1016/s0272-6386(01)80118-9. [DOI] [PubMed] [Google Scholar]
- 23.Page JE, Morgan SH, Eastwood JB, Smith SA, Webb DJ, Dilly SA, Chow J, Pottier A, Joseph AE. Ultrasound findings in renal parenchymal disease: comparison with histological appearances. Clin Radiol. 1994;49:867–870. doi: 10.1016/s0009-9260(05)82877-6. [DOI] [PubMed] [Google Scholar]
- 24.Koratala A, Chamarthi G, Loy JL, Olaoye OA. Illusion, Suspicion, and Obstruction: An Intriguing Case of Acute Kidney Injury. Am J Med. 2018;131:e489–e491. doi: 10.1016/j.amjmed.2018.08.003. [DOI] [PubMed] [Google Scholar]
- 25.Esprit DH, Koratala A, Chornyy V, Wingo CS. Obstructive Nephropathy Without Hydronephrosis: Suspicion Is the Key. Urology. 2017;101:e9–e10. doi: 10.1016/j.urology.2016.11.041. [DOI] [PubMed] [Google Scholar]
- 26.Morin ME, Baker DA. The influence of hydration and bladder distension on the sonographic diagnosis of hydronephrosis. J Clin Ultrasound. 1979;7:192–194. doi: 10.1002/jcu.1870070306. [DOI] [PubMed] [Google Scholar]
- 27.Peake SL, Roxburgh HB, Langlois SL. Ultrasonic assessment of hydronephrosis of pregnancy. Radiology. 1983;146:167–170. doi: 10.1148/radiology.146.1.6849041. [DOI] [PubMed] [Google Scholar]
- 28.Koratala A, Bhattacharya D, Chamarthi G. Point-of-care renal ultrasound: Interpret with care. Clin Case Rep. 2018;7:233–235. doi: 10.1002/ccr3.1934. [DOI] [PMC free article] [PubMed] [Google Scholar]
- 29.Koratala A, Alquadan KF. Parapelvic cysts mimicking hydronephrosis. Clin Case Rep. 2018;6:760–761. doi: 10.1002/ccr3.1431. [DOI] [PMC free article] [PubMed] [Google Scholar]
- 30.Tarzamni MK, Sobhani N, Nezami N, Ghiasi F. Bilateral parapelvic cysts that mimic hydronephrosis in two imaging modalities: a case report. Cases J. 2008;1:161. doi: 10.1186/1757-1626-1-161. [DOI] [PMC free article] [PubMed] [Google Scholar]
- 31.Koratala A, Bhattacharya D. Extrarenal pelvis mimicking hydronephrosis: a case for caution. Clin Case Rep. 2017;5:1720–1721. doi: 10.1002/ccr3.1143. [DOI] [PMC free article] [PubMed] [Google Scholar]
- 32.Hansen KL, Nielsen MB, Ewertsen C. Ultrasonography of the Kidney: A Pictorial Review. Diagnostics (Basel) 2015;6:pii: E2. doi: 10.3390/diagnostics6010002. [DOI] [PMC free article] [PubMed] [Google Scholar]
- 33.Smith-Bindman R, Aubin C, Bailitz J, Bengiamin RN, Camargo CA, Jr, Corbo J, Dean AJ, Goldstein RB, Griffey RT, Jay GD, Kang TL, Kriesel DR, Ma OJ, Mallin M, Manson W, Melnikow J, Miglioretti DL, Miller SK, Mills LD, Miner JR, Moghadassi M, Noble VE, Press GM, Stoller ML, Valencia VE, Wang J, Wang RC, Cummings SR. Ultrasonography versus computed tomography for suspected nephrolithiasis. N Engl J Med. 2014;371:1100–1110. doi: 10.1056/NEJMoa1404446. [DOI] [PubMed] [Google Scholar]
- 34.Koratala A, Vangapalli A, Bhattacharya D, Lee Loy J. Bladder stone: “Must know” ultrasonographic signs. Clin Case Rep. 2018 doi: 10.1002/ccr3.1977. [DOI] [PMC free article] [PubMed] [Google Scholar]
- 35.Gliga ML, Chirila CN, Podeanu DM, Imola T, Voicu SL, Gliga MG, Gliga PM. Twinkle, twinkle little stone: an artifact improves the ultrasound performance! Med Ultrason. 2017;19:272–275. doi: 10.11152/mu-984. [DOI] [PubMed] [Google Scholar]
- 36.Baad M, Lu ZF, Reiser I, Paushter D. Clinical Significance of US Artifacts. Radiographics. 2017;37:1408–1423. doi: 10.1148/rg.2017160175. [DOI] [PubMed] [Google Scholar]
- 37.Park BK, Kim B, Kim SH, Ko K, Lee HM, Choi HY. Assessment of cystic renal masses based on Bosniak classification: comparison of CT and contrast-enhanced US. Eur J Radiol. 2007;61:310–314. doi: 10.1016/j.ejrad.2006.10.004. [DOI] [PubMed] [Google Scholar]
- 38.Muglia VF, Westphalen AC. Bosniak classification for complex renal cysts: history and critical analysis. Radiol Bras. 2014;47:368–373. doi: 10.1590/0100-3984.2013.1797. [DOI] [PMC free article] [PubMed] [Google Scholar]
- 39.Vourganti S, Agarwal PK, Bodner DR, Dogra VS. Ultrasonographic evaluation of renal infections. Radiol Clin North Am. 2006;44:763–775. doi: 10.1016/j.rcl.2006.10.001. [DOI] [PubMed] [Google Scholar]
- 40.June CH, Browning MD, Smith LP, Wenzel DJ, Pyatt RS, Checchio LM, Amis ES., Jr Ultrasonography and computed tomography in severe urinary tract infection. Arch Intern Med. 1985;145:841–845. [PubMed] [Google Scholar]
- 41.Craig WD, Wagner BJ, Travis MD. Pyelonephritis: radiologic-pathologic review. Radiographics. 2008;28:255–77; quiz 327-8. doi: 10.1148/rg.281075171. [DOI] [PubMed] [Google Scholar]
- 42.Kamboj M, Lee Loy J, Koratala A. Renal ultrasonography: a reliable diagnostic tool for pyonephrosis. Clin Case Rep. 2018;6:1176–1178. doi: 10.1002/ccr3.1512. [DOI] [PMC free article] [PubMed] [Google Scholar]
- 43.Beaubien-Souligny W, Bouchard J, Denault A. Point-of-care ultrasound in end-stage kidney disease: beyond lung ultrasound. Curr Opin Nephrol Hypertens. 2018;27:487–496. doi: 10.1097/MNH.0000000000000453. [DOI] [PubMed] [Google Scholar]
- 44.Mallamaci F, Benedetto FA, Tripepi R, Rastelli S, Castellino P, Tripepi G, Picano E, Zoccali C. Detection of pulmonary congestion by chest ultrasound in dialysis patients. JACC Cardiovasc Imaging. 2010;3:586–594. doi: 10.1016/j.jcmg.2010.02.005. [DOI] [PubMed] [Google Scholar]
- 45.Sekiguchi H, Seaburg LA, Suzuki J, Astorne WJ, Patel AS, Keller AS, Gajic O, Kashani KB. Central venous pressure and ultrasonographic measurement correlation and their associations with intradialytic adverse events in hospitalized patients: A prospective observational study. J Crit Care. 2018;44:168–174. doi: 10.1016/j.jcrc.2017.10.039. [DOI] [PubMed] [Google Scholar]


