

Abstract
Interest in nanomaterials for subsurface applications has grown markedly due to their successful application in a variety of disciplines, such as biotechnology and medicine. Nevertheless, nanotechnology application in the petroleum industry presents greater challenges to implementation because of the harsh conditions (i.e. high temperature, high pressure, and high salinity) that exist in the subsurface that far exceed those present in biological applications. The most common subsurface nanomaterial failures include colloidal instability (aggregation) and sticking to mineral surfaces (irreversible retention). We previously reported an atomic force microscopy (AFM) study on the calcium-mediated adhesion of nanomaterials in reservoir fluids (S. L. Eichmann and N. A. Burnham, Sci. Rep. 7, 11613, 2017), where we discovered that the functionalized and bare AFM tips showed mitigated adhesion forces in calcium ion rich fluids. Herein, molecular dynamics reveal the molecular-level details in the AFM experiments. Special attention was given to the carboxylate-functionalized AFM tips because of their prominent ion-specific effects. The simulation results unambiguously demonstrated that in calcium ion rich fluids, the strong carboxylate-calcium ion complexes prevented direct carboxylate-calcite interactions, thus lowering the AFM adhesion forces. We performed the force measurement simulations on five representative calcite crystallographic surfaces and observed that the adhesion forces were about two to three fold higher in the calcium ion deficient fluids compared to the calcium ion rich fluids for all calcite surfaces. Moreover, in calcium ion deficient fluids, the adhesion forces were significantly stronger on the calcite surfaces with higher calcium ion exposures. This indicated that the interactions between the functionalized AFM tips and the calcite surfaces were mainly through carboxylate interactions with the calcium ions on calcite surfaces. Finally, when analyzing the order parameters of the tethered functional groups, we observed significantly different behavior of the alkanethiols depending on the absence or presence of calcium ions. These observations agreed well with AFM experiments and provided new insights for the competing carboxylate/calcite/calcium ion interactions.
Subject terms: Atomistic models, Nanoscale materials
Introduction
Using nanomaterials for subsurface applications, such as oil and gas recovery, reservoir imaging, flow diagnostics, CO2 sequestration, and environmental remediation, has attracted great attention in recent years1–11. The unique properties of nanomaterials have the potential to achieve much higher performance in the above mentioned applications. For example, the ultra-sensitive optical properties12,13 (e.g. persistent luminescence and surface-enhanced Raman scattering) may be used in reservoir interwell tracers for improved waterflood recovery optimization14–16. In addition, the distinctive interfacial properties10 (e.g. wedge-film disjoining and Pickering emulsion formation) may be used to mobilize residual oil given the correct tailoring of the nanomaterial chemistry and concentration. Unfortunately, harsh subsurface environments with high salinity (>120 000 ppm of total dissolved solids) and often elevated temperatures (>100 °C) impose great engineering challenges for the applications for nanomaterials in these conditions17–26. Specifically, the colloidal stability of nanomaterials is largely compromised by excessive charge screening and subsequent loss of electrostatic repulsion at the high salinities3,4,24–26. In addition, the dehydration and collapse of steric polymer coatings at high temperatures renders most common nanomaterial stabilizers unusable in subsurface conditions3,4,24–26. In addition to nanomaterial-nanomaterial aggregation, nanomaterial-mineral surface adsorption leads to irreversible retention and represents another great challenge that must be addressed3,4,17–23. Material loss through irreversible retention correlates directly to the costs of applying these materials. Classical approaches and theories (e.g. DLVO theory) have been applied in this area with limitations. Clearly, a new paradigm is needed to solve the above challenges before we can successfully deploy nanomaterials for advanced subsurface applications.
The concept of specific ion effects has been recognized for decades, yet the microscopic details, physical origins, and potential implications have been controversial, leading to significant debate in the scientific community27–39. Recent adhesion force measurements using atomic force microscopy (AFM) demonstrated interesting ion-specific behavior of nanomaterials in reservoir fluids40. In this study, carboxylate-functionalized AFM tips (and to a lesser extent the oxidized bare silicon tips) showed decreased adhesion to calcite surfaces in calcium (Ca2+) ion rich fluids. Moreover, this effect was insensitive to the total ionic strength (salinity) of the fluid, which contradicted classical DLVO theory predictions. Another AFM study similarly demonstrated that the adhesion force increases with increasing hydration radius through specific ion effects when carboxylate groups are present41.
In the present work, we aim to provide molecular-level understanding of the AFM experiments by means of atomistic molecular dynamics (MD) simulations. These simulations focus on the carboxylate-functionalized tips (Fig. 1) because of the strong ion-specific effects of these functional groups. As we will show, the MD results precisely captured the experimental trends. In addition, the simulations revealed the fine balance between the carboxylate-ion, carboxylate-calcite, and calcite-ion interactions in different reservoir fluids on diverse calcite crystallographic surfaces (Fig. 2). By analyzing the order parameter of the alkanethiols tethered to the AFM tips, we further discovered that their behavior throughout the adhesion measurement was affected by the presence of specific ions. We believe the molecular insights put forward in this study may have important implications for stabilizing nanomaterials in harsh subsurface oil and gas reservoirs, or other similar conditions found in the environment, biology, and pharmaceuticals42,43.
Figure 1.
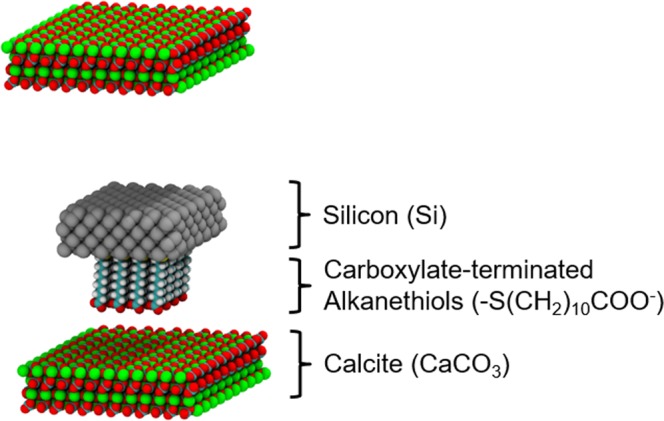
Schematic of simulation setup. The atom colors are: Ca = green; C = cyan; O = red; H = white; S = yellow; Si = gray.
Figure 2.
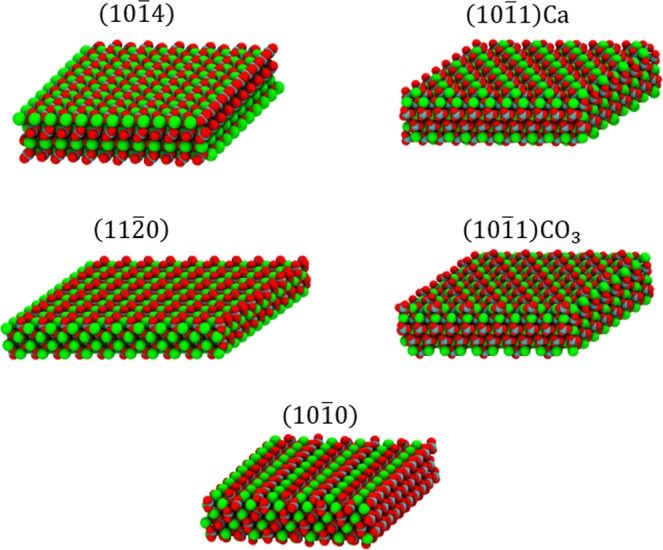
Snapshots of different calcite crystallographic surfaces. The atom colors are the same as in Fig. 1.
Results and Discussion
First, the carboxylate and ion complexes were studied in the different reservoir fluids; seawater (SW), calcium-doped seawater (CaSW), and brine (B) as described in the methods section. Figure 3 shows the snapshots of the simulation boxes after initial 20 ns production runs with fixed silicon slabs. As can be clearly seen, when away from the calcite surface, the carboxylates strongly chelate the calcium ions in the B and CaSW fluids (Fig. 3b,c). Figure 4 shows the radial distribution functions g(r) for the carboxylate groups with different ions and with water molecules. In SW (Fig. 4a), the negatively charged carboxylate groups were mainly surrounded by the positively charged Na+ ions because of electrostatic interactions. However, in B and CaSW (Fig. 4b,c), the carboxylates bind the Ca2+ ions more strongly due to the chelating effect (c.f. Fig. 3b,c); the strong carboxylate-Ca2+ ion complexes have been well documented44–46.
Figure 3.

Snapshots of the simulation boxes after initial production runs with fixed silicon slabs in different reservoir fluids. In the fluids the ion colors are: Na+ = transparent blue; Cl− = transparent orange; Ca2+ = green. Other atom colors are the same as in Fig. 1. Water molecules are removed for clarity. The alkanethiols in all three fluids start with similar order. The end carboxyl groups in seawater (SW) are surrounded by sodium ions, while those in brine (B) and calcium-doped seawater (CaSW) strongly chelate the calcium ions.
Figure 4.

Radial distribution functions g(r) for the carboxylate groups with different ions or with water molecules in different reservoir fluids, confirming the complexation of the carboxylate groups by sodium ions in seawater (SW) and by calcium ions in brine (B) and calcium-doped seawater (CaSW).
Next, steered molecular dynamics (SMD) simulations were used to model the AFM experiments where the adhesion force is measured as the minimum in the force curve as the simulated AFM tip is pulled away from the surface. Figure 5 shows the representative force measurements from the SMD simulations with the carboxylate-functionalized silicon slabs first approaching (blue curves; decreasing z) and then retracting from the calcite surfaces (red curves; increasing z). In SMD simulations the maximum force on the retraction curve, Fmax, represents the adhesion force measured experimentally by AFM, albeit not necessarily at the same order of magnitude. The behavior of the approach curves was similar in all fluids where the functionalized AFM tips experienced repulsion when the tethered alkanethiols are compressed against the calcite surfaces. The retraction curves, however, show variations with changing fluid chemistry where the functional groups in contact with the calcite surfaces experienced different adhesion forces in different fluids. As shown, the adhesion, marked by stars, was much stronger in SW (Fig. 5a) than in B and CaSW (Fig. 5b,c). This result matched nicely with prior experiments40.
Figure 5.

Representative force measurements from the steered molecular dynamics (SMD) simulations in different reservoir fluids. The blue curves are with the silicon slabs approaching to the calcite surfaces (decreasing z), and the red curves are with the silicon slabs retracting from the calcite surfaces (increasing z). The stars represent the maximum retracting forces, Fmax. The adhesion is much greater in seawater (SW) than in brine (B) or calcium-doped seawater (CaSW).
To explore this further, Fig. 6 shows the simulation snapshots when the functionalized AFM tips experienced the maximum retracting force (c.f. the stars in Fig. 5). As can be seen, in SW the carboxylates formed multiple direct contacts with the calcium ions on the calcite surfaces (Fig. 6a). In contrast, in B and CaSW, the strong complexes between the carboxylate groups and the Ca2+ ions in fluids prevented direct interaction between the carboxylate groups and their adhesion sites on the calcite surfaces (Fig. 6b,c). The force measurements were similar for the B and CaSW cases (Fig. 5b,c); nevertheless, there were microscopic differences. In the concentrated B fluids, a layer of NaCl can deposit on the calcite surfaces (Fig. 6b), which further screens the functionalized AFM tip interactions with the calcite surface interactions. This screening effect has previously been reported in Chen et al.47. On the other hand, in the less concentrated CaSW fluids, the functionalized AFM tips can still touch the calcite surfaces but the carboxylate groups were occupied by the calcium ions from solution and could not form strong adhesion to the calcite surfaces (Fig. 6c).
Figure 6.

Snapshots of the simulation boxes at the maximum retracting forces (c.f. stars in Fig. 5) in different reservoir fluids. The atom and ion colors are the same as in Figs 1 and 3. Water molecules are removed for clarity. Note the difference in the order of the alkanethiols among the three fluids.
In SMD simulations, we observed that the behavior of the tethered alkanethiols can be modified by specific ions. This phenomenon was captured by following the order parameter, S = < (3 cos2θ − 1)/2>, throughout the simulations. The order parameter is commonly used in studies of liquid crystals48, and θ are the angles between the principal axes of the tethered alkanethiols and the pulling directions (z axis) (Fig. 7). If S = 1, the alkanethiols will all be aligned with the z axis.
Figure 7.

Representative traces of the order parameter, S = < (3 cos2θ − 1)/2>, where θ are the angles between the principal axes of the tethered alkanethiols and the pulling direction (z axis), from the SMD simulations in different reservoir fluids. Further examples are shown in the supplementary material. The blue and red curves represent the same sequences as in Fig. 5, and the stars represent the locations of the maximum retracting forces. While the change in order upon approach is similar for all three fluids, upon retraction in seawater (SW) the alkanethiols undergo the greatest variation in order.
After initial equilibrium, prior to calcite-surface interactions, the alkanethiols were more aligned with the z-axis in B and CaSW (S ~ 0.7; Fig. 7b,c), while in SW the free-moving alkanethiols were less aligned (S ~ 0.5; Fig. 7a). The different behavior is because of the nature of the ions: in B and CaSW, a single calcium chelates with two carboxyl groups, restricting the motion of the alkanethiols, whereas in SW, sodium binds with only one carboxyl group. In SW, the alkanethiols are more mobile.
In the approach curves (blue curves in Fig. 7) for all fluids, S decreases with decreasing z due to alkane chain compression. For the retraction curves (red curves in Fig. 7, more examples shown in supplementary material), however, the S parameter behavior is distinctly different in SW compared to in B and CaSW. When retracting from calcite surfaces in SW, S first increased to ~0.7 at the maximum retracting force and then dropped to ~0.2 after the tip detached from the surface (Fig. 7a), whereas in B and CaSW, S changed much less dramatically (Fig. 7b,c).
Interestingly, the Ca2+ content affects the structure of the alkanethiols more on the retracting motion than on the approach. These results suggest that in SW the functional groups are bound tightly enough to the surface to promote rearrangement prior to detachment, which is not generally the case in the other two fluids. Figure 8 shows the retraction simulation snapshots in SW and B. As shown, the alkanethiols in SW have the highest alignment with stretched morphologies at the maximum retraction force (z = 3.0 nm), and then showed “spring back” morphologies after detachment from the calcite surfaces (z = 3.5 and 4.0 nm). This behavior was not observed in the other two fluids because the lower adhesion in these cases was not sufficient to stretch the alkanethiols prior to detachment, and therefore no subsequent “spring back” morphologies exist.
Figure 8.

Simulation snapshots of the retraction sequences in SW and B. Note in SW the alkanethiols are nearly all aligned perpendicularly to the surface (S ~ 0.7) at z = 3.0 nm when stretched and show “spring back” morphologies at z = 3.5 and 4.0 nm. Similar behavior was not observed in the B and CaSW fluids. The orange arrows in the snapshots for SW (z = 3.0 and 3.5 nm) are the average orientations of the alkane chains before and after pull-off, and the orange oval in B (z = 3.0 nm) highlights the salt layer on the surface of the calcite.
The effects of calcite crystallographic structure on the maximum retracting force, Fmax, are shown in Fig. 9 for each fluid. The results showed that for all crystal structures the Fmax values were about two to three fold higher in SW compared to in B and CaSW, which is quantitatively consistent with the previously reported experimental results40. It should be noted that the previous experimental studies and the current simulations are at room temperature and focused on the effects of calcium concentration on the measured interactions. Additional molecular dynamics studies were performed to demonstrate the effect of temperature and magnesium content separately (see Supplemental Information). These simulations show that the two fold increase is still observed at an elevated temperature of 100 °C (Fig. S2). In addition, simulation results in magnesium-doped seawater (MgSW) on selected calcite surfaces showed that, similar to the calcium ions, the magnesium ions can also mitigate adhesion but with lower efficiency (Fig. S3). These observations validate the predictability of the MD simulations, complemented the AFM experiments, and gave a more complete picture of this interesting calcium-mediated adhesion phenomenon in reservoir fluids.
Figure 9.
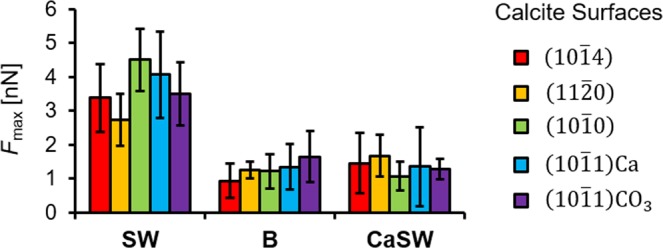
Summary of the maximum retracting forces, Fmax, in different reservoir fluids on different calcite crystallographic surfaces. The error bars are from five independent simulations in each case. Adhesion in seawater (SW) is consistently two or three times higher than in brine (B) and calcium-doped seawater (CaSW). There are small differences in adhesion among the five different crystallographic directions, with the (10 0) and (10 1)Ca surfaces showing higher adhesion than the other three.
Finally, the effects of calcium exposure for the various calcite crystallographic structures were examined. Figure 10 shows the ion distribution versus depth of the calcite surface for each crystallographic structure shown in Fig. 2. The exposed calcium ions on the calcite surface are marked with stars to indicate the ions available to interact with the carboxylate groups on AFM tips. In SW we observed that Fmax was the highest on the (100) surfaces and was the lowest on the (11 0) surfaces (Fig. 9). This is a result of the more accessible calcium ions on the (10 0) surfaces (c.f. Figs 2 and 10c) and the less exposed calcium ions on the (11 0) surfaces (Fig. 10b).
Figure 10.
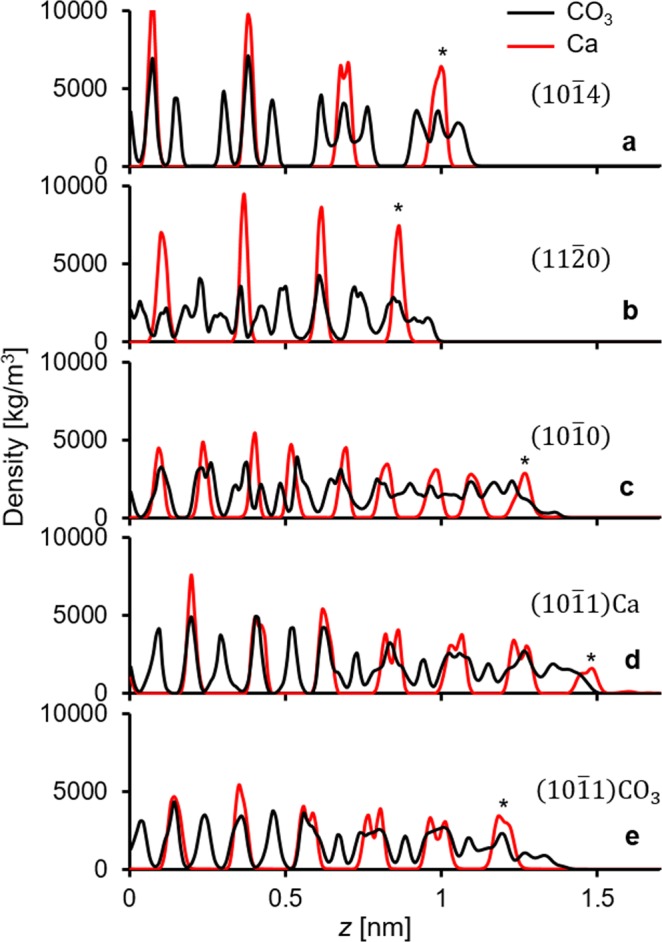
Density distributions of the calcite Ca (red) and CO3 (black) ions along the z axis. The stars represent the surface Ca ions that can interact with the carboxylate groups on the AFM tips. Consistent with the adhesion results for seawater in Fig. 8, calcium lies closer to the surface for the (10 0) and (10 1)Ca crystallographic faces.
In summary, this work provides molecular-level details about the calcium-mediated adhesion of nanomaterials to calcite surfaces in reservoir fluids. Using atomistic molecular dynamics (MD) simulations, we first showed that the carboxylate groups on the AFM tips strongly chelate calcium ions in the B and CaSW fluids. We then performed non-equilibrium steered molecular dynamics (SMD) simulations to model an AFM experiment and measure the adhesion forces between the AFM tips and the calcite surfaces; the adhesion forces were two to three fold stronger in the Ca2+ deficient SW fluid compared to in the Ca2+ abundant B and CaSW fluids, which quantitatively matched prior experimental results40. Simulation snapshots directly show that the complexes between the carboxylate groups and the Ca2+ ions in solution prevented the direct carboxylate-calcite interactions, which resulted in decreased adhesion in the B and CaSW fluids. Inspecting the order parameter of the tethered alkanethiols on the AFM tips, we further discovered that the complexes between carboxylates and the Ca2+ ions reduce the alkanethiols’ initial mobility and that retracting the tip in SW aligns the alkanethiols prior to pull-off significantly more than in B or CaSW. SMD simulations on five different calcite surfaces showed that the adhesion forces were stronger in SW compared to in B and CaSW for all calcite crystallographic structures. Furthermore, in SW the calcite surfaces with more accessible calcium ions [e.g. (10 0) surfaces] had stronger adhesion compared to surfaces with less exposed calcium ions [e.g. (11 0) surfaces]. We believe the MD study put forward in this work not only captured the essential physics of the ion-specific nanomaterials adhesion in reservoir fluids, but also provided valuable molecular details that are experimentally inaccessible.
Methods
The system studied consisted of a carboxylate-functionalized atomic force microscopy (AFM) tip analogue between extended calcite slabs (Fig. 1) in different reservoir fluids. The AFM tip analogue consisted of a square ~4 nm × ~4 nm silicon slab with 16 carboxylate-terminated alkanethiols (-S(CH2)10COO−) grafted with 0.54 nm grafting distances49,50. Five low surface energy calcite surfaces were considered (Fig. 2)47,51–53: (10 4), (11 0), (10 0), (10 1)Ca, and (10 1)CO3. Three reservoir fluids were considered in this study, of which the notations followed prior experiments40 but here the constituents were simplified for computational purposes: (1) seawater, SW: 0.7 M NaCl, (2) brine, B: 1.28 M NaCl + 0.34 M CaCl2, and (3) calcium-doped seawater, CaSW: 0.7 M NaCl + 0.34 M CaCl2. Notably, in this study we only focused on the NaCl and CaCl2 salts in order to pinpoint the calcium-mediated ion-specific behavior.
In the simulations, the calcite, calcite-water, and calcite-organic molecules interactions were described by the force field of Xiao et al.54, in which the organic molecules were described by the OPLS-AA force field55, and the water was treated with the TIP3P model56. The geometric combination rule was used to deduce all pairwise Lennard-Jones potentials from atom-wise CaCO3, OPLS-AA, and water model parameters. This force field has been previously used to study hydration layers as well as the carboxylate-calcite interactions with good compatibility54,57. The ions were modeled by the force field included in OPLS-AA parameter set originally developed by Åqvist and Chandrasekhar et al.58,59. Finally, the silicon slab was modeled by the GROMOS 53a6 force field60.
All molecular dynamics (MD) simulations were performed at temperature T = 300 K and P = 1 bar. Periodic boundary conditions were used in three dimensions, with an extended calcite slab perpendicular to the z axis. The lengths of the x and y box vectors were both ~5 nm, with the angle between x and y axis ranged from 90° to 113° depending on the terminated calcite crystallographic planes47. The space between the calcite slab and its periodic image were set to 7.5 nm, where the AFM tip was put in the middle (c.f. Fig. 1). In this work, MD simulations were carried out using GROMACS v2018.261. Electrostatic interactions were calculated using the particle-mesh Ewald (PME) summation, with a real-space cutoff of 1 nm, a grid spacing of 0.16 nm, and fourth-order interpolation. The van der Waals and neighbor-list cutoffs were both set to 1 nm. We used velocity rescaling temperature coupling with a time constant of 0.5 ps and Berendsen semi-isotropic pressure coupling with a time constant of 5 ps. The simulation time step was set to 2 fs.
Before the production runs, the systems were pre-equilibrated with a steepest-descent energy minimization, a 0.1 ns NVT, and a 1 ns NPT simulations. The production runs consisted of three consecutive steps: (1) 20 ns equilibration run with restrained silicon slabs, (2) 40 ns non-equilibrium steered molecular dynamics54,62–64 (SMD) run with the silicon slabs approached to the calcite surfaces with constant velocity (0.05 nm/ns), and (3) 40 ns SMD run with the silicon slabs retracted from the calcite surfaces with constant velocity (0.05 nm/ns). The bottom layer of the calcite molecules was restrained in order to support the surface, while the top layer of the calcite molecules facing the AFM tip could freely move. All bonds with H-atoms were constrained using the LINCS algorithm65 with the exception of water molecules, which were constrained using the SETTLE algorithm66.
The order parameter was calculated as S = < (3 cos2θ − 1)/2>, where θ was the angle between the principal axes of the tethered alkanethiols and the pulling direction (z axis). The angle, θ, used in the order parameter was calculated during the SMD simulations by averaging the angles of the 16 tethered alkanethiols at every 100 ps interval.
Supplementary information
Acknowledgements
We thank Aramco Research Center-Boston, Reservoir Engineering Technology team members for valuable discussions. We acknowledge ASC, IT Services for managing computational resources.
Author Contributions
H.C. performed MD simulations, prepared the figures, and wrote the manuscript. S.L.E. provided guidance about molecular framework, MD simulation design to mimic AFM experiments, reviewed results, and assisted in manuscript preparation. N.A.B. provided technical and theoretical guidance about AFM and the order parameter, reviewed the results, and assisted in manuscript preparation. All authors reviewed the full manuscript.
Data Availability
The data sets generated during and/or analyzed during the current study are not publicly available due to the corresponding author’s corporate affiliation but are available from the corresponding author on reasonable request.
Competing Interests
The authors declare no competing interests.
Footnotes
Publisher’s note: Springer Nature remains neutral with regard to jurisdictional claims in published maps and institutional affiliations.
Supplementary information
Supplementary information accompanies this paper at 10.1038/s41598-019-46999-8.
References
- 1.Kanj, M. Y., Rashid, M. & Giannelis, E. P. Industry first field trial of reservoir nanoagents. In SPE Middle East Oil and Gas Show and Conference. (Society of Petroleum Engineers, 2011).
- 2.Kosynkin, D. & Alaskar, M. Oil industry first interwell trial of reservoir nanoagent tracers. In SPE Annual Technical Conference and Exhibition. (Society of Petroleum Engineers, 2016).
- 3.Berlin JM, et al. Engineered nanoparticles for hydrocarbon detection in oil-field rocks. Energy Environ. Sci. 2011;4:505–509. doi: 10.1039/C0EE00237B. [DOI] [Google Scholar]
- 4.Hwang C-C, et al. Highly stable carbon nanoparticles designed for downhole hydrocarbon detection. Energy Environ. Sci. 2012;5:8304–8309. doi: 10.1039/c2ee21574h. [DOI] [Google Scholar]
- 5.Javadpour F, Nicot J-P. Enhanced CO2 storage and sequestration in deep saline aquifers by nanoparticles: commingled disposal of depleted uranium and CO2. Transport Porous Med. 2011;89:265–284. doi: 10.1007/s11242-011-9768-z. [DOI] [Google Scholar]
- 6.Worthen AJ, et al. Nanoparticle-stabilized carbon dioxide-in-water foams with fine texture. J. Colloid Interface Sci. 2013;391:142–151. doi: 10.1016/j.jcis.2012.09.043. [DOI] [PubMed] [Google Scholar]
- 7.Zhang W-x. Nanoscale iron particles for environmental remediation: an overview. J. Nanopart. Res. 2003;5:323–332. doi: 10.1023/A:1025520116015. [DOI] [Google Scholar]
- 8.Kanel SR, Nepal D, Manning B, Choi H. Transport of surface-modified iron nanoparticle in porous media and application to arsenic (III) remediation. J. Nanopart. Res. 2007;9:725–735. doi: 10.1007/s11051-007-9225-7. [DOI] [Google Scholar]
- 9.Ogolo, N., Olafuyi, O. & Onyekonwu, M. Enhanced oil recovery using nanoparticles. In SPE Saudi Arabia Section Technical Symposium and Exhibition (Society of Petroleum Engineers, 2012).
- 10.Zhang H, Nikolov A, Wasan D. Enhanced oil recovery (EOR) using nanoparticle dispersions: underlying mechanism and imbibition experiments. Energy Fuels. 2014;28:3002–3009. doi: 10.1021/ef500272r. [DOI] [Google Scholar]
- 11.ShamsiJazeyi, H., Miller, C. A., Wong, M. S., Tour, J. M. & Verduzco, R. Polymer‐coated nanoparticles for enhanced oil recovery. J. Appl. Polym. Sci. 131 (2014).
- 12.Chang S, Eichmann SL, Huang T-YS, Yun W, Wang W. Controlled design and fabrication of SERS–SEF multifunctional nanoparticles for nanoprobe applications: morphology-dependent SERS phenomena. J. Phys. Chem. C. 2017;121:8070–8076. doi: 10.1021/acs.jpcc.7b00688. [DOI] [Google Scholar]
- 13.Chuang Y-J, et al. Ultra-sensitive in-situ detection of near-infrared persistent luminescent tracer nanoagents in crude oil-water mixtures. Sci. Rep. 2016;6:27993. doi: 10.1038/srep27993. [DOI] [PMC free article] [PubMed] [Google Scholar]
- 14.Ow, H. et al. First deployment of a novel advanced tracers system for improved waterflood recovery optimization. In SPE Abu Dhabi International Petroleum Exhibition & Conference (Society of Petroleum Engineers, 2018).
- 15.Chen, H. & Poitzsch, M. E. Improved reservoir history matching and production optimization with tracer data. In SPE Annual Technical Conference and Exhibition. (Society of Petroleum Engineers, 2018).
- 16.Thomas, G. et al. Deployment and detection of a novel barcoded advanced tracers system for the optimization of improved waterflood recovery in hydrocarbon reservoirs. In SPE Middle East Oil and Gas Show and Conference (Society of Petroleum Engineers, 2019).
- 17.Kanj, M. Y., Funk, J. J. & Al-Yousif, Z. Nanofluid coreflood experiments in the ARAB-D. In SPE Saudi Arabia Section Technical Symposium. (Society of Petroleum Engineers, 2009).
- 18.Yu, H. et al. Transport and retention of aqueous dispersions of paramagnetic nanoparticles in reservoir rocks. In SPE Improved Oil Recovery Symposium (Society of Petroleum Engineers, 2010).
- 19.Zhang, T. et al. Investigation of nanoparticle adsorption during transport in porous media. In SPE Annual Technical Conference and Exhibition. (Society of Petroleum Engineers, 2013).
- 20.Li YV, Cathles LM, Archer LA. Nanoparticle tracers in calcium carbonate porous media. J. Nanopart. Res. 2014;16:2541. doi: 10.1007/s11051-014-2541-9. [DOI] [Google Scholar]
- 21.Ureña-Benavides EE, et al. Low adsorption of magnetite nanoparticles with uniform polyelectrolyte coatings in concentrated brine on model silica and sandstone. Ind. Eng. Chem. Res. 2016;55:1522–1532. doi: 10.1021/acs.iecr.5b03279. [DOI] [Google Scholar]
- 22.Kmetz AA, et al. Improved mobility of magnetite nanoparticles at high salinity with polymers and surfactants. Energy Fuels. 2016;30:1915–1926. doi: 10.1021/acs.energyfuels.5b01785. [DOI] [Google Scholar]
- 23.Chen, H., Kmetz, A. A., Cox, J. R. & Poitzsch, M. E. Impact of irreversible ietention on tracer deployments; constraining novel material deployments. In SPE Abu Dhabi International Petroleum Exhibition & Conference. (Society of Petroleum Engineers, 2017).
- 24.Bagaria HG, et al. Iron oxide nanoparticles grafted with sulfonated copolymers are stable in concentrated brine at elevated temperatures and weakly adsorb on silica. ACS Appl. Mater. Interfaces. 2013;5:3329–3339. doi: 10.1021/am4003974. [DOI] [PubMed] [Google Scholar]
- 25.Bagaria HG, et al. Stabilization of iron oxide nanoparticles in high sodium and calcium brine at high temperatures with adsorbed sulfonated copolymers. Langmuir. 2013;29:3195–3206. doi: 10.1021/la304496a. [DOI] [PubMed] [Google Scholar]
- 26.Zuniga CA, Goods JB, Cox JR, Swager TM. Long-term high-temperature stability of functionalized graphene oxide nanoplatelets in Arab-D and API brine. ACS Appl. Mater. Interfaces. 2016;8:1780–1785. doi: 10.1021/acsami.5b09656. [DOI] [PubMed] [Google Scholar]
- 27.Baldwin RL. How Hofmeister ion interactions affect protein stability. Biophys. J. 1996;71:2056. doi: 10.1016/S0006-3495(96)79404-3. [DOI] [PMC free article] [PubMed] [Google Scholar]
- 28.Collins KD. Ions from the Hofmeister series and osmolytes: effects on proteins in solution and in the crystallization process. Methods. 2004;34:300–311. doi: 10.1016/j.ymeth.2004.03.021. [DOI] [PubMed] [Google Scholar]
- 29.Zhang Y, Furyk S, Bergbreiter DE, Cremer PS. Specific ion effects on the water solubility of macromolecules: PNIPAM and the Hofmeister series. J. Am. Chem. Soc. 2005;127:14505–14510. doi: 10.1021/ja0546424. [DOI] [PubMed] [Google Scholar]
- 30.Zhang Y, Cremer PS. Interactions between macromolecules and ions: the Hofmeister series. Curr. Opin. Chem. Biol. 2006;10:658–663. doi: 10.1016/j.cbpa.2006.09.020. [DOI] [PubMed] [Google Scholar]
- 31.Petrache HI, Zemb T, Belloni L, Parsegian VA. Salt screening and specific ion adsorption determine neutral-lipid membrane interactions. Proc. Natl. Acad. Sci. USA. 2006;103:7982–7987. doi: 10.1073/pnas.0509967103. [DOI] [PMC free article] [PubMed] [Google Scholar]
- 32.Cho Y, et al. Effects of Hofmeister anions on the phase transition temperature of elastin-like polypeptides. J. Phys. Chem. B. 2008;112:13765–13771. doi: 10.1021/jp8062977. [DOI] [PMC free article] [PubMed] [Google Scholar]
- 33.Lund M, Vrbka L, Jungwirth P. Specific ion binding to nonpolar surface patches of proteins. J. Am. Chem. Soc. 2008;130:11582–11583. doi: 10.1021/ja803274p. [DOI] [PubMed] [Google Scholar]
- 34.Lo Nostro P, Ninham BW. Hofmeister phenomena: an update on ion specificity in biology. Chem. Rev. 2012;112:2286–2322. doi: 10.1021/cr200271j. [DOI] [PubMed] [Google Scholar]
- 35.Rembert KB, et al. Molecular mechanisms of ion-specific effects on proteins. J. Am. Chem. Soc. 2012;134:10039–10046. doi: 10.1021/ja301297g. [DOI] [PubMed] [Google Scholar]
- 36.Tomé LI, Pinho SP, Jorge M, Gomes JR, Coutinho JOA. Salting-in with a salting-out agent: explaining the cation specific effects on the aqueous solubility of amino acids. J. Phys. Chem. B. 2013;117:6116–6128. doi: 10.1021/jp4021307. [DOI] [PubMed] [Google Scholar]
- 37.Jungwirth P, Cremer PS. Beyond Hofmeister. Nature Chemistry. 2014;6:261–263. doi: 10.1038/nchem.1899. [DOI] [PubMed] [Google Scholar]
- 38.Chen H, Cox JR, Panagiotopoulos AZ. Force fields for carbohydrate–divalent cation interactions. J. Phys. Chem. B. 2016;120:5203–5208. doi: 10.1021/acs.jpcb.6b01438. [DOI] [PubMed] [Google Scholar]
- 39.Chen H, Cox JR, Ow H, Shi R, Panagiotopoulos AZ. Hydration repulsion between carbohydrate surfaces mediated by temperature and specific ions. Sci. Rep. 2016;6:28553. doi: 10.1038/srep28553. [DOI] [PMC free article] [PubMed] [Google Scholar]
- 40.Eichmann SL, Burnham NA. Calcium-mediated adhesion of nanomaterials in reservoir fluids. Sci. Rep. 2017;7:11613. doi: 10.1038/s41598-017-11816-7. [DOI] [PMC free article] [PubMed] [Google Scholar]
- 41.Rios-Carvajal T, Pedersen N, Bovet N, Stipp S, Hassenkam T. Specific ion effects on the interaction of hydrophobic and hydrophilic self-assembled monolayers. Langmuir. 2018;34:10254–10261. doi: 10.1021/acs.langmuir.8b01720. [DOI] [PubMed] [Google Scholar]
- 42.Oren A. Microbial life at high salt concentrations: phylogenetic and metabolic diversity. Saline Systems. 2008;4:2. doi: 10.1186/1746-1448-4-2. [DOI] [PMC free article] [PubMed] [Google Scholar]
- 43.Morissette SL, et al. High-throughput crystallization: polymorphs, salts, co-crystals and solvates of pharmaceutical solids. Adv. Drug Del. Rev. 2004;56:275–300. doi: 10.1016/j.addr.2003.10.020. [DOI] [PubMed] [Google Scholar]
- 44.Cannan RK, Kibrick A. Complex formation between carboxylic acids and divalent metal cations. J. Am. Chem. Soc. 1938;60:2314–2320. doi: 10.1021/ja01277a012. [DOI] [Google Scholar]
- 45.Einspahr H, Bugg CE. The geometry of calcium carboxylate interactions in crystalline complexes. Acta Crystallogr. Sect. B: Struct. Sci. 1981;37:1044–1052. doi: 10.1107/S0567740881005037. [DOI] [Google Scholar]
- 46.Byler DM, Farrell HM. Infrared spectroscopic evidence for calcium ion interaction with carboxylate groups of casein1. J. Dairy Sci. 1989;72:1719–1723. doi: 10.3168/jds.S0022-0302(89)79287-0. [DOI] [Google Scholar]
- 47.Chen H, Panagiotopoulos AZ, Giannelis EP. Atomistic molecular dynamics simulations of carbohydrate–calcite interactions in concentrated brine. Langmuir. 2015;31:2407–2413. doi: 10.1021/la504595g. [DOI] [PubMed] [Google Scholar]
- 48.Khoo, I.-C. Liquid crystals: physical properties and nonlinear optical phenomena. Liquid Crystals: Physical Properties and Nonlinear Optical Phenomena, by Iam-Choon Khoo, pp. 320. ISBN 0-471-30362-3. Wiley-VCH, December 1994., 320 (1994).
- 49.Soliman W, Bhattacharjee S, Kaur K. Adsorption of an antimicrobial peptide on self-assembled monolayers by molecular dynamics simulation. J. Phys. Chem. B. 2010;114:11292–11302. doi: 10.1021/jp104024d. [DOI] [PubMed] [Google Scholar]
- 50.Steffens C, Leite FL, Bueno CC, Manzoli A, Herrmann PSDP. Atomic force microscopy as a tool applied to nano/biosensors. Sensors. 2012;12:8278–8300. doi: 10.3390/s120608278. [DOI] [PMC free article] [PubMed] [Google Scholar]
- 51.de Leeuw N, Parker S. Atomistic simulation of the effect of molecular adsorption of water on the surface structure and energies of calcite surfaces. J. Chem. Soc., Faraday Trans. 1997;93:467–475. doi: 10.1039/a606573b. [DOI] [Google Scholar]
- 52.de Leeuw NH, Parker SC. Surface structure and morphology of calcium carbonate polymorphs calcite, aragonite, and vaterite: an atomistic approach. J. Phys. Chem. B. 1998;102:2914–2922. doi: 10.1021/jp973210f. [DOI] [Google Scholar]
- 53.Sekkal W, Zaoui A. Nanoscale analysis of the morphology and surface stability of calcium carbonate polymorphs. Sci. Rep. 2013;3:1587. doi: 10.1038/srep01587. [DOI] [PMC free article] [PubMed] [Google Scholar]
- 54.Xiao S, Edwards SA, Gräter F. A new transferable forcefield for simulating the mechanics of CaCO3 crystals. J. Phys. Chem. C. 2011;115:20067–20075. doi: 10.1021/jp202743v. [DOI] [Google Scholar]
- 55.Jorgensen WL, Maxwell DS, Tirado-Rives J. Development and testing of the OPLS all-atom force field on conformational energetics and properties of organic liquids. J. Am. Chem. Soc. 1996;118:11225–11236. doi: 10.1021/ja9621760. [DOI] [Google Scholar]
- 56.Jorgensen WL, Chandrasekhar J, Madura JD, Impey RW, Klein ML. Comparison of simple potential functions for simulating liquid water. J. Chem. Phys. 1983;79:926–935. doi: 10.1063/1.445869. [DOI] [Google Scholar]
- 57.Zhu B, Xu X, Tang R. Hydration layer structures on calcite facets and their roles in selective adsorptions of biomolecules: A molecular dynamics study. J. Chem. Phys. 2013;139:234705. doi: 10.1063/1.4848696. [DOI] [PubMed] [Google Scholar]
- 58.Aaqvist J. Ion-water interaction potentials derived from free energy perturbation simulations. J. Phys. Chem. 1990;94:8021–8024. doi: 10.1021/j100384a009. [DOI] [Google Scholar]
- 59.Chandrasekhar J, Spellmeyer DC, Jorgensen WL. Energy component analysis for dilute aqueous solutions of lithium (1+), sodium (1+), fluoride (1-), and chloride (1-) ions. J. Am. Chem. Soc. 1984;106:903–910. doi: 10.1021/ja00316a012. [DOI] [Google Scholar]
- 60.Oostenbrink C, Villa A, Mark AE, Van Gunsteren WF. A biomolecular force field based on the free enthalpy of hydration and solvation: the GROMOS force‐field parameter sets 53A5 and 53A6. J. Comput. Chem. 2004;25:1656–1676. doi: 10.1002/jcc.20090. [DOI] [PubMed] [Google Scholar]
- 61.Abraham MJ, et al. GROMACS: High performance molecular simulations through multi-level parallelism from laptops to supercomputers. SoftwareX. 2015;1:19–25. doi: 10.1016/j.softx.2015.06.001. [DOI] [Google Scholar]
- 62.Grubmüller H, Heymann B, Tavan P. Ligand binding: molecular mechanics calculation of the streptavidin-biotin rupture force. Science. 1996;271:997–999. doi: 10.1126/science.271.5251.997. [DOI] [PubMed] [Google Scholar]
- 63.Heymann B, Grubmüller H. Molecular dynamics force probe simulations of antibody/antigen unbinding: entropic control and nonadditivity of unbinding forces. Biophys. J. 2001;81:1295–1313. doi: 10.1016/S0006-3495(01)75787-6. [DOI] [PMC free article] [PubMed] [Google Scholar]
- 64.Gräter F, Shen J, Jiang H, Gautel M, Grubmüller H. Mechanically induced titin kinase activation studied by force-probe molecular dynamics simulations. Biophys. J. 2005;88:790–804. doi: 10.1529/biophysj.104.052423. [DOI] [PMC free article] [PubMed] [Google Scholar]
- 65.Hess B. P-LINCS: a parallel linear constraint solver for molecular simulation. J. Chem. Theory Comput. 2008;4:116–122. doi: 10.1021/ct700200b. [DOI] [PubMed] [Google Scholar]
- 66.Miyamoto S, Kollman PA. SETTLE: an analytical version of the SHAKE and RATTLE algorithm for rigid water models. J. Comput. Chem. 1992;13:952–962. doi: 10.1002/jcc.540130805. [DOI] [Google Scholar]
Associated Data
This section collects any data citations, data availability statements, or supplementary materials included in this article.
Supplementary Materials
Data Availability Statement
The data sets generated during and/or analyzed during the current study are not publicly available due to the corresponding author’s corporate affiliation but are available from the corresponding author on reasonable request.