Abstract
Individuals blinded by retinitis pigmentosa can now be treated with retinal prostheses that provide artificial vision through the coordinated electrical stimulation of remaining retinal neurons. In vitro investigations characterizing the response of retinal neurons to electrical stimulation have primarily focused on retinal ganglion cells because they are the output neurons of the retina and their superficial position in the retina makes them readily accessible to in vitro recording techniques. The majority of information regarding the response of inner retinal neurons has been inferred from ganglion cell activity. This in vitro investigation directly measures the response of bipolar cells to extracellular electrical stimulation using patch clamp electrophysiology in the wholemount retina of normal Tg(Gng13-EGFP)GI206Gsat and degenerate rd10 Tg(Gng13-EGFP)GI206Gsat mice. Bipolar cells respond to electrical stimulation with time-locked depolarizing voltage transients. The latency of the response declines with increases in stimulation amplitude. A desensitizing response is observed during repeated stimulation with 25-ms biphasic current pulses delivered at pulse rates greater than 6 pps. A burst of long-latency (200–1000 ms) inhibitory postsynaptic potentials are evoked by the stimulus and the burst exhibits evidence of a lower and upper stimulation threshold.
Keywords: Electrical stimulation, bipolar cell, wholemount retina, prosthesis
1. Introduction
Retinal prostheses provide artificial sight to individuals blinded by outer retinal diseases such as retinitis pigmentosa. The prostheses function by converting images of the visual scene into spatiotemporal patterns of electrical stimulation that activate surviving retinal neurons (Humayun et al. 1996; Freeman et al. 2011; Weiland et al. 2016). This retinal activity is interpreted by the brain as a visual percept (Humayun et al. 2012; Ayton et al. 2014; Stingl et al. 2015). Research investigating effective retinal stimulation protocols primarily measure responses of retinal ganglion cells (RGCs) because they are the output neurons of the retina and they are readily accessible by in vitro recording techniques (Sekirnjak et al. 2006; Behrend et al. 2011; Cho et al. 2016). It has been shown that RGCs can be activated directly by the electrical stimulus or indirectly by an electrical stimulus that activates inner retinal neurons, which then provide synaptic input to RGCs (Freeman & Fried 2011; Jensen, Ofer R Ziv, et al. 2005; Eickenscheidt et al. 2012).
Several studies support the idea that long-duration or low-frequency stimulus pulses can selectively activate bipolar cells within the inner retina while avoiding direct activation of RGCs (Greenberg et al. 1999; Jensen, Ofer R. Ziv, et al. 2005; Freeman et al. 2011). Direct RGC activation has the potential consequence of not only exciting RGCs whose somas are near the stimulating electrode, but also peripheral RGCs whose axons pass by the active electrode (Behrend et al. 2011; Weitz et al. 2015). Axonal stimulation leads to the perception of elongated shapes since the peripheral RGCs represent peripheral visual fields (Nanduri 2011; Nanduri et al. 2012). A recent case study in a single human subject reported percept shapes were more focal and less elongated when long-duration pulses were used (Weitz et al. 2015).
Direct measurements of retinal bipolar cell activity in response to electrical stimulation have been conducted in a limited number of studies (Margalit & Thoreson 2006; Cameron et al. 2013). Using a retinal slice preparation to gain access to bipolar cells, depolarizing and hyperpolarizing responses were detected in wild-type and rd1 mouse bipolar cells (Margalit & Thoreson 2006; Cameron et al. 2013). Stimulation thresholds were reported to remain the same between wild-type and rd1 bipolar cells (Cameron et al. 2013), Inhibitory currents detected in bipolar cells were caused by the activation of amacrine cells which were first synaptically driven by bipolar cells (Margalit & Thoreson 2006). An advantage of the retinal slice preparation is that it facilitates neural recordings from cells in the inner retina. Disadvantages are that it severs lateral synaptic connections and suffers from significant current shunting around the tissue during stimulation (Margalit et al. 2011). The wholemount retina preparation more accurately mimics the operational environment of retinal prostheses implanted in patients, but it is difficult to obtain patch clamp recordings of bipolar cell activity because these cells are covered by other neural layers that restrict access of the patch pipette. To further our understanding of the bipolar cell response to extracellular electrical stimulation, this report utilizes a novel photoreceptor peeling technique to facilitate direct measurement of bipolar cell activity in wholemount retina (Walston et al. 2017).
2. Methods
2.1. Tissue Preparation
Normal transgenic Tg(Gng13-EGFP)GI206Gsat (N=13) and rd10 Tg(Gng13-EGFP)GI206Gsat (N=7) adult mice expressing enhanced green fluorescent protein (EGFP) in ON-type bipolar cells in a C57BL/6J background strain were anaesthetized with ketamine/xylazine before cervical dislocation (Gong et al. 2003; Huang et al. 2003). Eyes were enucleated and placed in 30°C Ames’ media (Sigma, Louis, MO) (pH=7.4, 280 mOsm) supplemented with sodium bicarbonate and penicillin-streptomycin, and oxygenated with 95% O2, 5% CO2. Photoreceptor outer segments and somas were removed from the wholemount retina using filter paper to expose bipolar cells (Walston et al. 2017). The retina was mounted RGC-side down on a custom microelectrode array (Figure 1A) and perfused with Ames’ media at a flow rate of 4–6 mL/min. The retina was gently held down by a PTFE membrane (JVWP01300, Millipore) that was manually perforated with 1-mm-diameter holes to allow patch clamp pipette access, and weighted with a titanium ring. A Ag/AgCl return electrode was placed in solution above the retina. The retina was visualized with an upright microscope using 10x (Figure 1B) and 60x water-immersion (Figure 1C) objectives.
Figure 1. Patch clamp recording experimental setup.
A Photoreceptors have been removed from wholemount retina using the photoreceptor peel technique while the inner nuclear layer (INL), inner plexiform layer (IPL) and retinal ganglion cell (RGC) layer remain intact. The retina is placed RGC-side down on a microelectrode array to model the epiretinal stimulation configuration. Distant ground electrode is placed in solution above the retina. Patch clamp pipette advances toward bipolar cells from the subretinal space. B Wholemount retina laid RGC-side down on microelectrode array under 10x magnification. Large black circles are 75-μm-diameter electrodes. C Region in white square from B under 60x magnification. Scale bar 10μm.
2.2. Electrophysiology
Whole-cell current clamp recordings were collected from the somas of ON-type bipolar cells expressing EGFP using an EPC9 Patch Clamp Amplifier (HEKA, Bellmore, New York) under the control of PatchMaster software. Patch clamp pipettes were pulled from 1.2-mm outer diameter borosilicate glass (Sutter Instruments, Novato, CA) with resistance 6–14 MΩ. The pipettes were filled with internal solution containing the following components (mM): 120 K-Gluconate, 10 NaCl, 3 ATP-Mg, 0.3 GTP-Na, 10 HEPES, 0.5 EGTA, 10 Phosphocreatine Disodium Hydrate, adjusted to pH=7.3 with KOH (Sigma, Louis, MO) and an osmolality of 270 mOsm. A liquid junction potential of 14 mV was measured and corrected using previously described methods (Neher 1992).
Electrical stimulation voltage pulses (STG-2008, Multi-Channel Systems) was passed through a custom voltage to current convertor (Behrend 2009) and applied to the retina through 75-μm-diameter disk electrodes, with an electrode material of either indium tin-oxide or platinum-iridium (Petrossians et al. 2011; Petrossians et al. 2014). Stimulation currents were charge-balanced, biphasic, cathodic-first square-current pulses without an interphase gap. Cathodic phase pulse durations applied were 8-, 16-, 25-, 50-, and 100-ms at various amplitudes. Each pulse was presented 10 times at a rate of 0.33 pulses per second (pps), and the order of the pulse trains was randomized. 75-μm diameter electrodes were used because they are within the range of electrode sizes currently used in retinal prostheses and it has been shown that the area of activated RGCs in response to stimulation is not further reduced with the use of smaller electrodes (Behrend et al. 2011; Weitz et al. 2015). Indium tin-oxide electrodes were initially used because they are optically transparent and aided in the visualization of bipolar cells during the patch clamp process. Platinum-iridium electrodes were later used for their higher charge injection capacity (Petrossians et al. 2011).
Data was post-processed in custom MATLAB (MathWorks) scripts. Electrical stimulus artifacts were removed from recordings by averaging trials that did not have a stimulus-evoked response, and then linearly scaling the waveform to remove the stimulus artifact from stimulus presentations of different amplitudes (Sekirnjak et al. 2006). Stimulus-evoked depolarizing voltage transients were categorized as those occurring within 150 ms after the stimulus presentation. The artifact-subtracted traces were passed through a 30-point moving average filter (287 Hz 3dB cutoff frequency) and followed by a high-pass filter to reduce noise. Threshold for the resulting signal was set at 2xRMS to detect the presence of depolarizing voltage transients. Full-width half-maximum measurements were recorded with respect to the peak of the voltage transient and the resting membrane potential. Depolarizing voltage transients were not considered stimulus-evoked events if spontaneous activity caused the membrane potential of the cell to rise above the full-width half-maximum of the voltage transient before the onset of the stimulus. The stimulation threshold for each cell was defined as the first stimulation amplitude that elicited a response in the bipolar cell in at least 5 of the 10 stimulus presentations. Inhibitory postsynaptic potentials (IPSPs) were processed with a similar algorithm optimized to detect negative peaks in the first derivative of the recording above 2xRMS. Response latencies were recorded as the time point corresponding to the peak of the response.
Repetitive stimulation was applied for 8 seconds using 25-ms pulses delivered at 1, 2, 4, 6, 8, 10, 12, 14, 16, 18, 20 pps. Stimuli were repeated three times each and the order of the stimulus presentations was randomized. The onset of each pulse train was separated by 10 seconds. The amplitude of the stimulus was chosen as the stimulation amplitude that evoked a response from the bipolar cell 12 of 16 times when delivered at 2 pps. The artifact subtraction procedure was applied to every pulse for each stimulation pulse rate. Responses are defined as depolarizing voltage transients with amplitudes greater than 2xRMS of the baseline activity measured before the onset of stimulation. The amplitude of the evoked responses was correlated with the latency from the start of the stimulation period. The ratio describing the sum of the response amplitudes with the number of stimuli was calculated for each one-second bin of the stimulation period. Responses were normalized against the maximum ratio and averaged between cells.
3. Results
3.1. Response to Electrical Stimulation
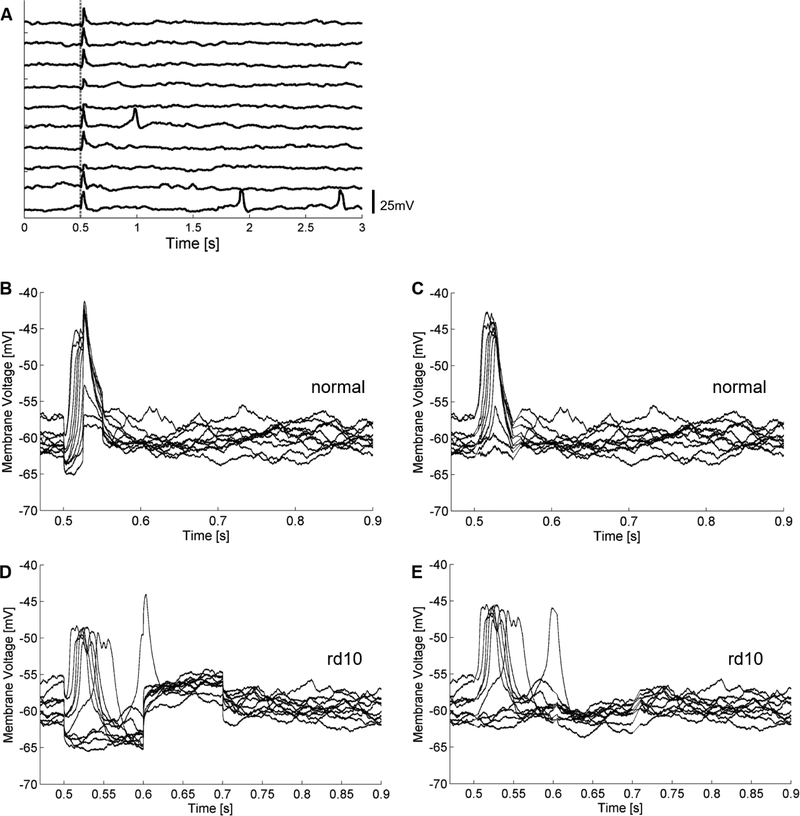
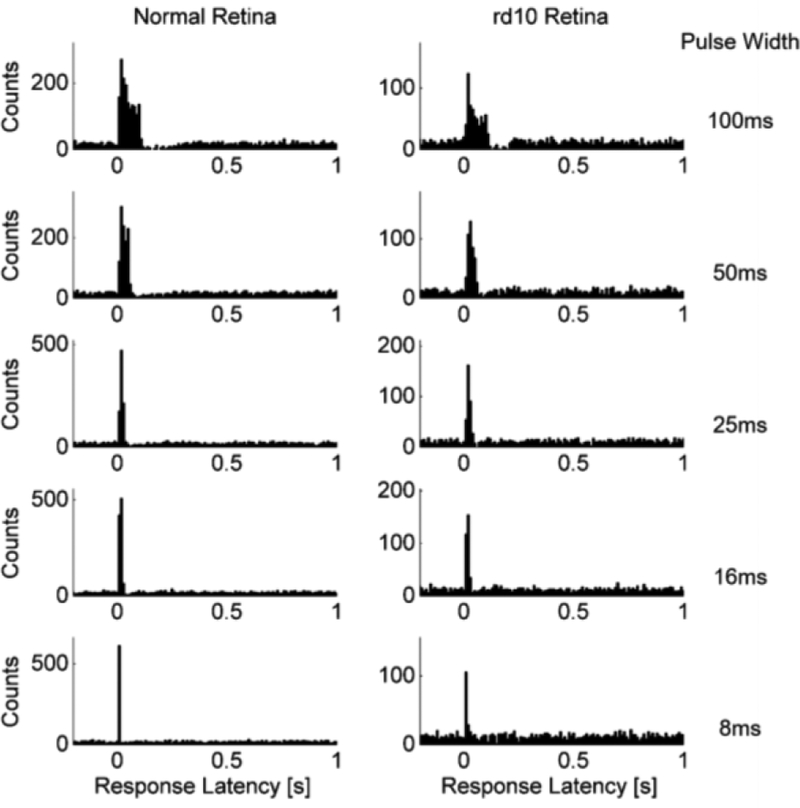
Bipolar cells responded to electrical stimulation with a depolarizing voltage transient time-locked with the stimulus. Figure 2A shows the response to ten 25-ms, 1-μA current pulses delivered at 0.33 pps. The rising phase of the depolarizing voltage transient is aligned with the cathodic phase of the stimulation. Spontaneous activity is observed in a few of the trials. The bipolar cell response is shown on an expanded time scale before (Figure 2B) and after (Figure 2C) stimulus artifact subtraction. Similarly, bipolar cell responses to electrical stimulation in rd10 retina exhibited depolarizing voltage transients (Figure 2D,E). After recording from several cells, the latency of the voltage transients was examined to determine if there were temporally clustered responses. Figure 3 shows a peristimulus time histogram of response latencies from 39 bipolar cells after stimulation with 100-, 50-, 25-, 16-, and 8-ms pulses of varying stimulus amplitudes for normal and rd10 retina. Only one cluster of responses between approximately 10 and 150 ms is identifiable above the spontaneous activity baseline. In the 100-ms stimulation histogram, there is a brief range (approximately 200 ms) of suppressed activity following the response period. The suppression is strongest following the end of the cathodic phase, and likely caused by the subsequent anodic phase of the stimulus. A similar suppression is evident in the 50-ms pulse width histogram, but with a shorter period (approximately 100 ms).
Figure 2: Bipolar cell responses to electrical stimulation.
25-ms, 1-μA stimulation applied at t = 0.5 seconds. 10 pulses delivered at 0.33 pps. A Raw recordings before stimulus artifact removal. Stimulus onset marked by vertical dashed line. Time-locked large voltage depolarizing transients observed in addition to a putative sub-threshold response. Spontaneous activity in the form of fast depolarizations are also observed during the recording. B Raw traces of A overlaid on an expanded time scale. C Overlaid traces after stimulus artifact removal from B. D Rd10 bipolar cell raw traces overlaid of in response to 100-ms, 1.4-μA stimulation applied. E Overlaid traces after stimulus artifact removal from D.
Figure 3: Peristimulus time histogram of depolarizing voltage transients.
Electrical stimuli applied at t=0 seconds. Aggregate latencies for all stimulation amplitudes used in investigation separated by stimulation pulse width (100-, 50-, 25-, 16-, and 8-ms). Left column shows bipolar cells from normal retina (N=27). Right column shows bipolar cells from rd10 retina (N=12).
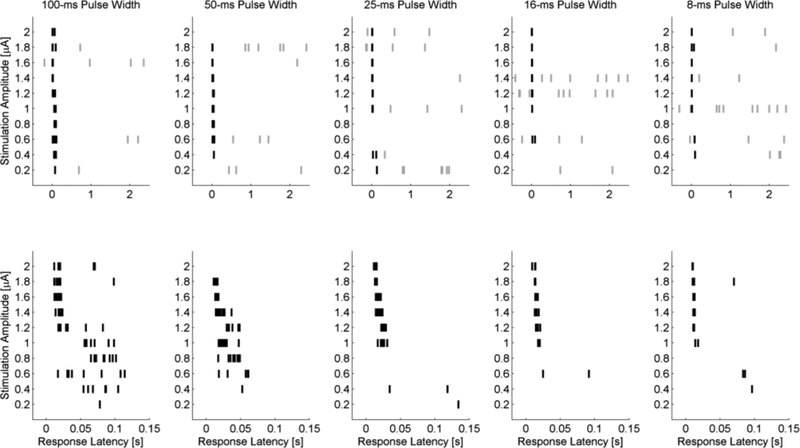
Shorter pulse width stimulation has a smaller latency response range than longer pulse widths. Figure 4 illustrates the response latencies as a function of amplitude and pulse width for the same bipolar cell stimulated in Figure 2. Ten stimulation pulses were delivered at 0.33 pps for each amplitude and pulse width. Spontaneous activity (grey) and evoked activity (black) is shown in Figure 4 (top row). An expanded time scale reveals the trend towards shorter latencies as the stimulation amplitudes was increased (Figure 4, bottom row). The number of trials in which an evoked response was recorded also increased as the stimulation amplitude is increased.
Figure 4. Raster plot of bipolar cell response latencies in normal retina.
Stimuli are presented 10 times for each stimulation amplitude. Stimulus applied at t=0 seconds. Background activity is shown in grey and evoked responses in black notches. Top row, Activity during 100-, 50-, 25-, 16-, and 8-ms stimulation. Bottom row, expanded view off the top row showing the first 150ms. Depolarizing voltage transients occurring within 150 ms are considered evoked responses. Data corresponds to the same cell shown in Figure 2.
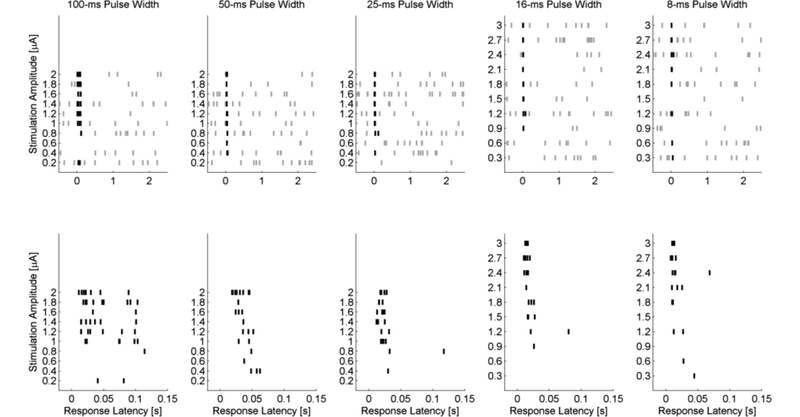
The latency of the evoked depolarizing transients was in the range of 10–150 ms for rd10 bipolar cells as shown in the peri-stimulus time histogram (Figure 3). Raster plots show the timing of evoked responses along with spontaneous activity (Figure 5, top row). The expanded time axes (Figure 5, bottom row) similarly demonstrates a decrease in response latency and an increase in the number of evoked response in correspondence with increasing stimulus amplitudes.
Figure 5: Raster plot of bipolar cell response latencies in rd10 retina.
Stimuli are presented 10 times for each stimulation amplitude. Background activity is shown in gray and evoked responses in black notch. Stimulus applied at t=0 seconds. Top row, Activity during 100-, 50-, 25-, 16, and 8-ms stimulation. Bottom row, expanded view off the top row showing the first 150 ms. Depolarizing voltage transients occurring within 150 ms are considered evoked responses.
3.2. Application of Blockers
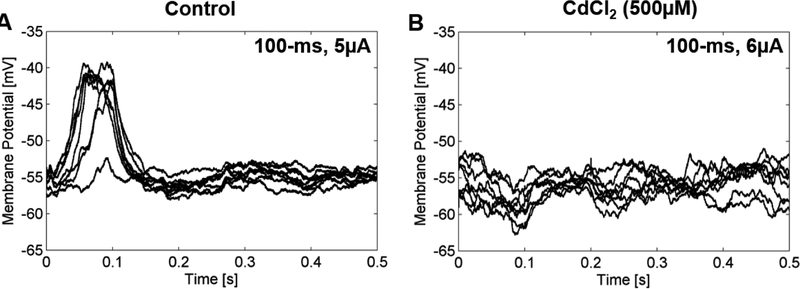
The origin of the depolarizing voltage transient was investigated through pharmacological blockers. The bipolar cell response to 100-ms stimulation before and after the application of 500μM CdCl2 to the bath solution was recorded. Depolarizing voltage transients were observed in control conditions at 5μA (Figure 6A). In the presence of CdCl2, depolarizing voltage transients are reduced when stimulating with 6μA (Figure 6B). Responses were not recovered after 10min wash out of the CdCl2 for the control solution.
Figure 6: Depolarizing voltage transients are not observed in the presence of CdCl2.
100 ms cathodic-first stimulus is delivered at 1 Hz and applied at t=0. A Responses are evoked in control conditions at 5 μA. B After 10 min application of 500 μM CdCl2, response to 6 uA stimulation is reduce in the same cell. The effect of 500 μM CdCl2 was not reversed.
3.3. Strength-Duration Curves
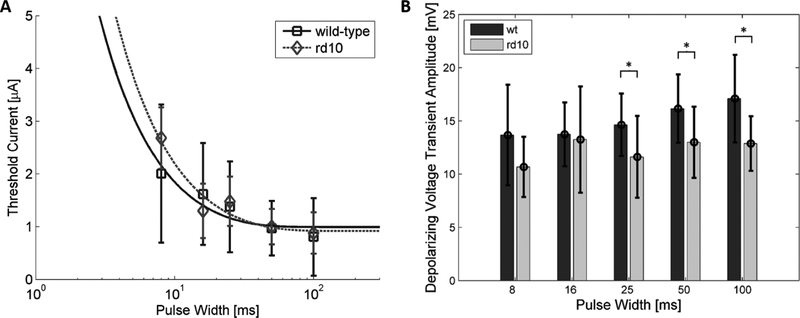
Strength-duration curves were generated for normal (with photoreceptor-peeled) and rd10 ON-type bipolar cells in response to electrical stimulation (Figure 7A). Cells without a measured threshold for each of the stimulation pulse widths were excluded. Longer pulse durations required lower stimulation amplitudes to evoke a response from the bipolar cell. Differences in stimulation thresholds were not detected at any pulse width between normal and rd10 bipolar cells (p>0.05, t-test). Lapicque’s decaying exponential model was used to fit the strength-duration curve (Lapicque 1931). The model yields an average chronaxie of 9.2±4.5 ms for normal and 14.1±6.3 ms for rd10 bipolar cells, while rheobase currents were 0.88±0.21 μA for normal and 0.91±0.24 μA for rd10 bipolar cells. Neither chronaxie, nor rheobase were significantly different between bipolar cells of normal and rd10 retina (p>0.05, t-test).
Figure 7: Stimulation thresholds and response amplitudes.
A Stimulation strength-duration curve for normal and rd10 ON-type bipolar cells. Stimulation amplitudes are higher for shorter stimulation pulse widths. Stimulation thresholds of normal (square) and rd10 (diamond) bipolar cells are not significantly different (p > 0.05). Error bars indicate standard deviation. Data fit to decaying exponentials with R2 = 0.84 and 0.91 for normal and rd10 curves, respectively. B Average depolarizing voltage transient response amplitude measured at stimulation threshold current. Rd10 voltage transient response amplitudes are significantly lower for 100-, 50-, and 25-ms, stimulation. Error bars represent standard deviation. Asterisks denote significance (p<0.05, t-test).
The amplitude of the depolarizing voltage transient response was evaluated at the stimulation threshold current. Average response amplitudes were significantly lower in bipolar cells of rd10 retina than in normal retina for 100-, 50-, and 25-ms stimulation (Figure 7B). The average amplitude of spontaneous depolarizations in bipolar cells from rd10 retina (16.12±3.79 mV, N=12) was significantly lower than in bipolar cells from normal retina (18.94±2.75 mV, N=27) (p=0.0125, t-test). The full width half maximum of the spontaneous activity was not significantly different (p=0.54, t-test). Full-width half-maximum was 60.5±39.1 ms in rd10 and 55.1±16.9 ms normal bipolar cells.
3.4. Inhibitory Postsynaptic Potentials
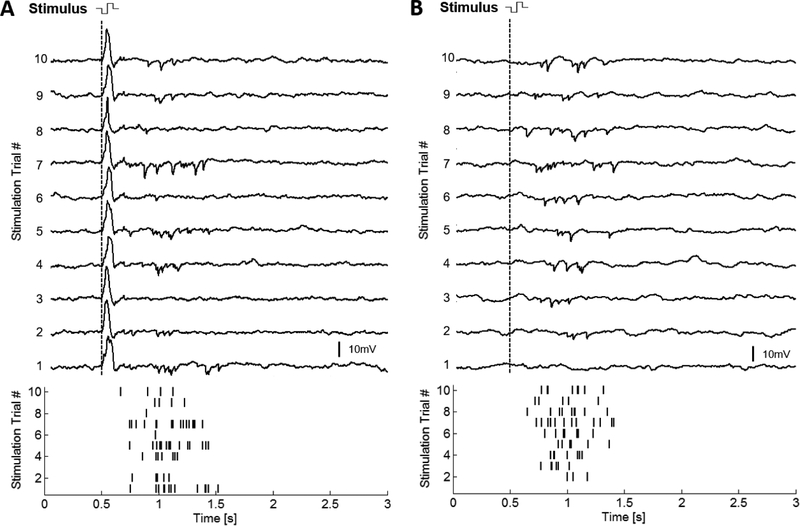
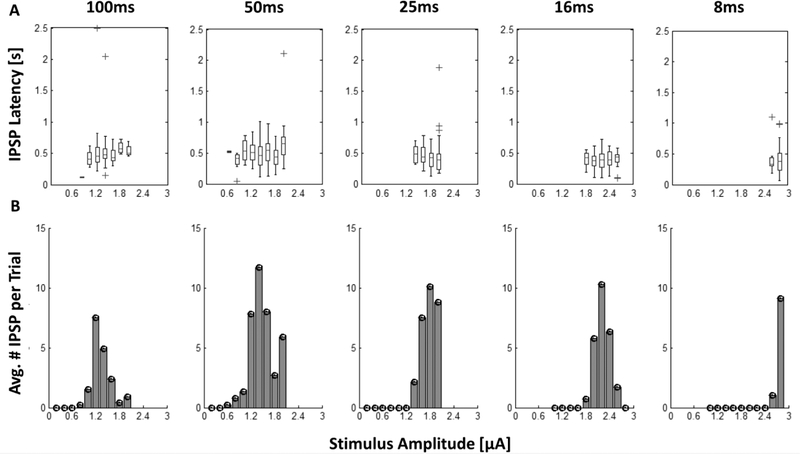
In 13 normal and 1 rd10 bipolar cells, a burst of hyperpolarizing voltage transients was observed after the electrical stimulus was applied. Figure 8A shows the hyperpolarizing voltage transients elicited from a bipolar cell using 100-ms, 1.8 μA stimulation. The response was reproduced in 9 of the 10 stimulation trials at this amplitude. These transients resemble IPSCs mediated by synaptic transmission from amacrine cells to bipolar cells (Vickers et al. 2012). From the raster plot, IPSP bursts began approximately 200 ms after the stimulus and concluded 800 ms later (Figure 8A). The IPSPs could be observed in both the presence and absence of an evoked depolarizing voltage transient. Figure 8B shows IPSPs evoked in a different bipolar cell in response to 100-ms, 1.2 μA stimulation. Even without the depolarizing voltage transient, the latency and duration of the response is similar. Furthermore, the latency range of the evoked IPSP bursts remained constant with respect to the applied stimulation amplitudes and pulse widths as illustrated by the box-plot for an individual bipolar cell in Figure 9A. However, Figure 9B shows how the number of evoked IPSPs is nonlinearly dependent on the stimulation amplitude for each of the stimulation pulse widths. The IPSP bursts appear to exhibit lower and upper stimulation thresholds, in which stimulation at the lower or upper bounds evokes a few IPSPs in the burst whereas a stimulation amplitude between these bounds evokes a more robust response.
Figure 8: IPSP recorded in ON-type bipolar cells.
Current clamp recording of bipolar cells in response to 100 ms stimulation. Artifact subtraction has been performed on all traces. A Bipolar cell stimulated at 1.8 μA evokes a depolarizing response followed by a burst of hyperpolarizing responses. B A different cell stimulated at 1.2 μA evokes a burst of hyperpolarizing voltage transients without a depolarizing response. Raster plots for the hyperpolarizing voltage transients are shown at the bottom for the 10 trials with each cell.
Figure 9: Latency and average number of IPSPs vs. stimulation amplitude and duration.
A The latency of the IPSP burst is shown in the box plots for each stimulation amplitude. The line inside each rectangle represents the median response. The parallel edge of the rectangle corresponds to 1-quartile away from the median. Whiskers enclose the range of the response latencies. Crosses above some of the box plots indicate IPSP outliers. B Bar blots show the average number of IPSPs evoked per stimulus at each amplitude and pulse width.
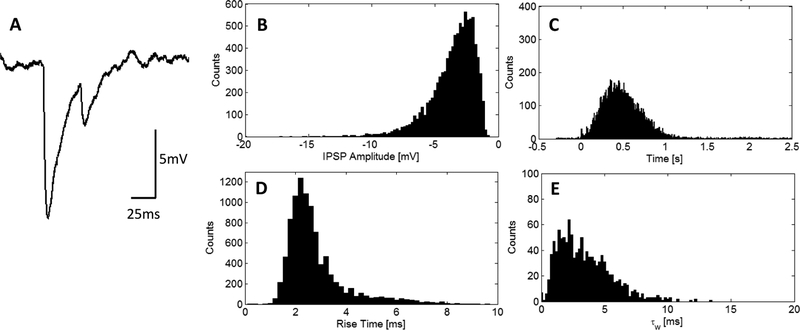
Individual IPSPs kinetics were analyzed on the basis of amplitude, rise time, decay time and latency. To analyze the amplitude, the local minimum and maximum membrane potential with respect to the leading edge of the IPSP were measured. The 10–90% rise time was calculated as the time needed for the IPSP to hyperpolarize from 10% to 90% of the peak amplitude (Tamás et al. 1997; Williams & Stuart 2002; Frech & Backus 2004; Feigenspan & Babai 2015). The decay time, τw, was calculated by first fitting the trailing edge of the IPSP to a double exponential and then taking the weighted-average of the two exponential time constants with their respective scalar exponential coefficient. Both IPSPs in Figure 10A would be included to estimate the average rise time, but only the second IPSP would be used in the determination of the decay time because the membrane potential returns to the resting membrane potential. The amplitude of the IPSPs was analyzed with a Poisson distribution yielding maximum likelihood estimate of 3.64 mV [3.60, 3.68 mV CI] (Figure 10B). The latency of the IPSPs are concentrated within a range of 183 ms to 895 ms (Figure 10C). The average rise time was 2.85±1.23 ms and the distribution is shown in Figure 10D. The average decay time was 3.45±2.10 ms (Figure 10E).
Figure 10: IPSP kinetics.
A Example of two recorded IPSPs. B Aggregate IPSP amplitudes have maximum likelihood estimate 3.61 mV [3.57, 3.64] 95% confidence interval. C Latency of the IPSPs (N=9390). D Aggregate rise time have average of 2.80±1.18 ms (N=9647). E Aggregate decay time have average of 3.45 ±2.10 ms (N=1160). The leading edge of each IPSP was used in the determination of the 10–90% rise time and amplitude as measured with respect to the local minimum and local maximum of each IPSP. The decay time, τw, was measured from IPSPs that repolarized to baseline similar to the smaller amplitude IPSP in A allowing for a more accurate double exponential fit.
3.5. Facilitation then Attenuation of Response with Increasing Stimulation Rate
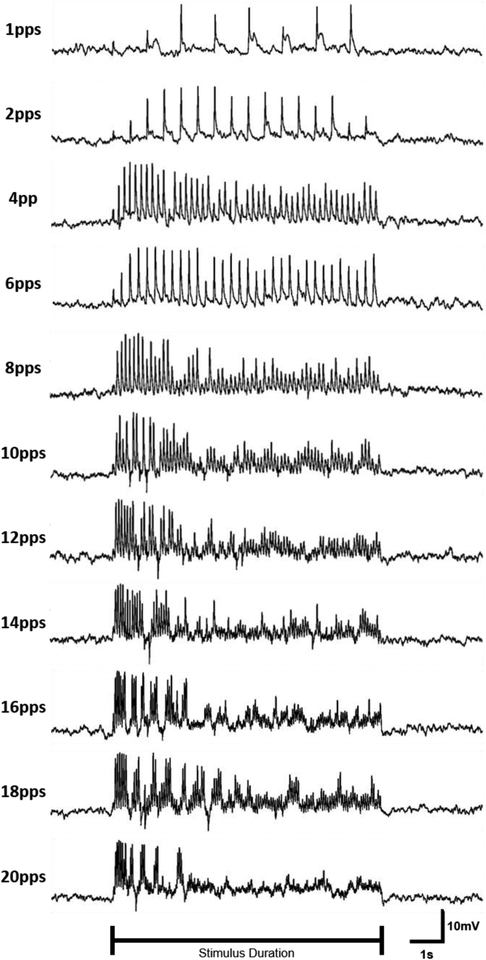
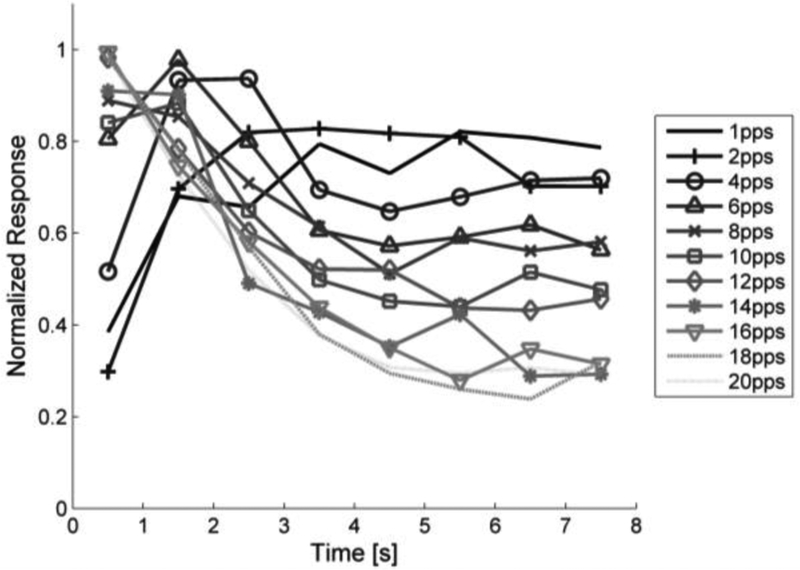
The response of bipolar cells to varying stimulation pulse rates was analyzed because the indirect response in RGCs has previously been shown to desensitize to high-frequency stimulation (Sekirnjak et al. 2006; Jensen & Rizzo 2007; Freeman & Fried 2011). 25-ms pulses were delivered at pulse rates ranging from 1–20 pps. Figure 11 illustrates the response of a bipolar cell in normal retina to various stimulation pulse rates. The response grows in amplitude for the first few stimulation pulses in the train which suggests facilitation. At pulse rates ≤4 pps, the response amplitude remains fairly consistent throughout the duration of the stimulation. The response amplitude begins to decline during 6 pps stimulation, though a response is consistently evoked. For 8 pps and higher, there is an initial burst of activity followed by reduced activity for the remainder of the stimulus duration. The initial burst of activity becomes more prominent and temporally compact as the stimulation pulse rate increases. For pulse rates ≥14 pps, the depolarizing voltage transients are separated by periods of repolarization. Responses were consistent across the 3 trials performed with this protocol. The average normalized response of bipolar cells (N=7) to repetitive electrical stimulation illustrates that stimulation below 6 pps elicits a relatively consistent voltage response, whereas higher pulse rates demonstrate pronounced attenuation throughout the stimulus duration (Figure 12).
Figure 11: Stimulation pulse rate affects bipolar cell response characteristics.
Normal ON-type bipolar cell activity for a single neuron shown in response to 25-ms 1.5 μA biphasic pulse delivered at 1–20 pps for 8 seconds beginning at 2 seconds. Order of stimulation was randomized. Stimulus artifact has been removed from traces.
Figure 12: Normalized bipolar cell response to repetitive stimulation.
Bipolar cells are stimulated at rates between 1 and 20 pps (N = 7). Stimulation amplitude was set to evoke response in bipolar cell 12/16 times at 2 pps. Facilitation is observed low pulse rates which then maintain relatively stable responses throughout the stimulation period. High pulse rate stimulation result in a strong initial response that was not sustained through the stimulus period.
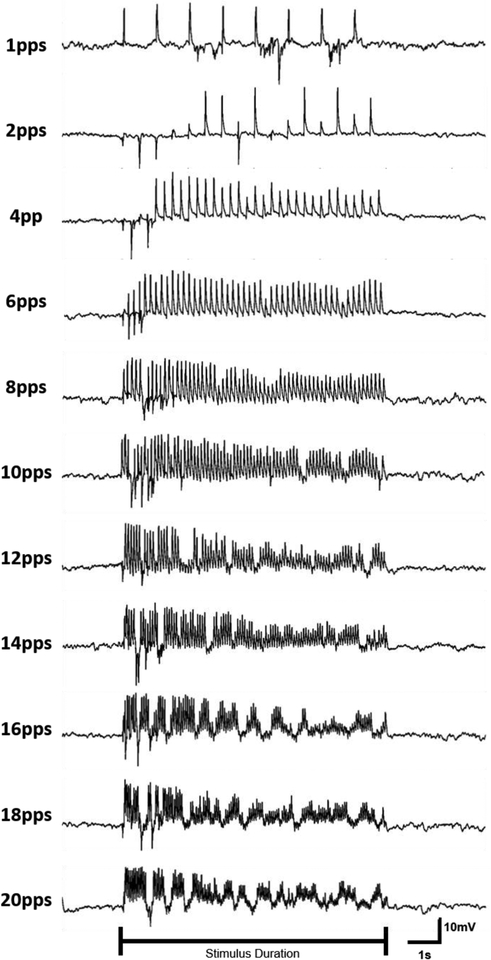
Evoked IPSPs demonstrate a dependence on the stimulation pulse rate. Pulses in the 0.33-pps stimulation protocol consistently evoked IPSPs at multiple amplitudes and pulse widths (Figure 9). Similarly, 1-pps stimulation evoked multiple IPSPs bursts throughout the 8 second stimulation protocol (Figure 13). However, for stimulation rates greater than 2 pps an IPSP burst was observed only within the first second after stimulation (Figure 13). Based on the latency, this initial burst is most likely evoked by the first stimulation pulse in the train. Similar IPSP burst patterns were evoked in the 3 trials. 10 seconds separated the last and first pulse between successive trials.
Figure 13: IPSP bursts show frequency dependent response during repeated stimulation.
Response of a bipolar cell to 1–20 Hz stimulation with 25 ms biphasic pulses. Stimulation period is 8 seconds. 1pps stimulation evokes multiple IPSPs during the stimulus. Pulse rates faster than 2 pps have IPSPs that occur within the first second of the stimulation period.
4. Discussion
4.1. Retina Preparation
The photoreceptor peel technique facilitated direct measurement of the response of ON-type bipolar cells to extracellular electrical stimulation in wholemount retina via patch clamp recording. Our prior work has shown that bipolar cell physiology is not altered by peeling (Walston et al. 2017). The advantage of the wholemount retina preparation is that it better mimics the operational environment of the retinal prosthesis in comparison to retinal slice or dissociated cell culture preparations. However, with the removal of photoreceptors from the retina, the input into the remaining retinal neurons has been altered. It has been reported that occluding photoreceptor input through application of pharmacological blockers L-AP4 and NBQX can induce retinal oscillatory membrane potentials in wild-type retina similar to those observed in degenerate retina (Trenholm et al. 2012). In contrast, oscillatory potentials were not observed in our measurements.
4.2. Depolarizing Voltage Transient Amplitudes
Bipolar cells responded to extracellular electrical stimulation with time-locked depolarizing voltage transients. The amplitude of the depolarizing voltage transient can vary (Figure 7B). The trend appears to be an increase in amplitude until a membrane potential is reached at which point the cell will depolarize to a maximal voltage transient amplitude. Some bipolar cells also demonstrated a reduction in voltage transient amplitude as the stimulus amplitude was increased further. This result is consistent with observations noted previously in bipolar cells (Cameron et al. 2013). Additionally, the shorter (8-and 16-ms) pulses widths demonstrated a greater frequency of low amplitude depolarizing voltage transients. The peak amplitude of the evoked responses appear to be influenced by the cessation of the cathodic phase and beginning of the anodic phase of the stimulation. This suggests that the anodic phase is repolarizing the bipolar cell and limiting the amplitude of the response. From previous work in RGCs, it is expected that introducing an interphase gap between the cathodic and anodic stimulation phases may allow the bipolar cell to continue to depolarize and reduce stimulation thresholds (Weitz et al. 2014).
The depolarizing voltage transients appear to be mediated by the activation of voltage-gated calcium channels per the response reduction in the presence of CdCl2 (Figure 6). Previous studies in the mouse and goldfish retina show that calcium spikes originate in the bipolar cell terminal because there is a high concentration of voltage-gated calcium channels (Zenisek & Matthews 1998; Mennerick et al. 1997; Protti & Llano 1998). If the voltage signal detected in the soma originates in the terminal, then it is likely an attenuated and low-pass filtered version of the response because the signal must propagate down the long and narrow bipolar cell axon before reaching the soma (Baden et al. 2011). Despite directly recording bipolar cell activity with patch clamp electrophysiology, there may be some responses in the terminal that cannot be detected in the soma.
4.3. Depolarizing Voltage Transient Latencies
The onset of the depolarizing voltage transient response coincided with cathodic phase of the epiretinal stimulation. The latency of the depolarizing voltage transients as measured at the peak of the response tended to decrease as the stimulus amplitude increased until reaching a minimum latency of approximately 10ms (Figure 4). In comparison, the latency of the indirect response measured in ON-RGCs has as many as three distinct action potential burst latencies at approximately 5–20, 40–60, and 100 ms (Eickenscheidt et al. 2012; Jensen, Ofer R Ziv, et al. 2005; Im & Fried 2015; Freeman & Fried 2011; Sekirnjak et al. 2006). The burst of action potentials in ON-RGCs occurring between 40 and 60 ms in the ganglion response has been associated with the photoreceptor response in wild-type retina (Eickenscheidt et al. 2012; Im & Fried 2015). Action potentials with latencies beyond 100 ms are synaptically mediated but the origin is less clear. The bursts occurring between 5 and 20 ms is suggested to be associated with the bipolar cell response (Eickenscheidt et al. 2012). Though the latencies measured at the peak of the bipolar cell depolarizing voltage transient response were only measured as short as 10ms, it is likely that the latency of the voltage transient response is correlated with the latency of the RGC response as the onset of the bipolar cell depolarization was often evident at approximately 3 ms.
4.4. Normal vs Degenerate retina
The stimulation thresholds were not significantly different between bipolar cells of normal and rd10 retina in response to extracellular electrical stimulation for any of the stimulation pulses tested. This observation may have several explanations and implications on downstream RGC activity. Studies recording from RGCs note that RGC stimulation thresholds are higher in degenerate retina than wild-type retina in response to indirect stimulation (Goo et al. 2011; Weitz et al. 2015; Jensen & Rizzo 2008). The lower thresholds observed in wild-type retina are suggested to be mediated by the activation of photoreceptors, which are deemed to have lower stimulation thresholds than bipolar cells (Eickenscheidt et al. 2012). The removal of photoreceptors from the normal retina in this study may elevate bipolar cell response threshold because both preparations now have significantly reduced photoreceptor input. Alternatively, the difference in indirect stimulation threshold measured in RGCs may be attributed to the degeneration of inner retinal neurons. 50% of rod bipolar cells in the S334ter-line3 rat model of retinitis pigmentosa degenerate by post-natal day 60 (Ray et al. 2010), and 20% degenerate by post-natal day 100 in the rd10 mouse model (Gargini et al. 2007). This reduction in synaptic input to RGCs could elevate the indirect stimulation thresholds. In addition, the reduced response amplitude of the depolarizing voltage transients in degenerate retina (Figure 7B) could translate to less robust responses in postsynaptic RGCs, although this difference was small.
4.5. Repetitive Stimulation and Retinal Desensitization
Repetitive stimulation of the retina has been linked with percept fading for users of retinal prostheses (Pérez Fornos et al. 2012; Stingl et al. 2015; Zrenner et al. 2011). The indirect response in RGCs has been shown to desensitize to repeated stimulation and is often associated with artificial percept fading (Sekirnjak et al. 2006; Jensen & Rizzo 2007; Freeman & Fried 2011; Im & Fried 2016). The mechanism of desensitization remains unresolved, though the persistence of desensitization has been demonstrated in the presence of amacrine cell blockers (Freeman & Fried 2011), indicating that inhibitory synaptic input to bipolar cell terminals and ganglion cell dendrites is not required for desensitization.
At the stimulation amplitudes used in this study for repeated stimulation, the first few stimulation pulses often evoked increasingly larger amplitude depolarizing voltage transients until a maximal response was achieved, which resembles facilitation (Bourinet et al. 1994; Zühlke et al. 1999; Zucker & Regehr 2002). However, the response of bipolar cells to various rates of repeated stimulation was most reliable at low pulse rates throughout the 8 second stimulation period (Figure 12). At higher stimulation pulse rates, the response attenuates. This phenomenon resembles calcium-dependent calcium channel inactivation in which increased intracellular calcium concentrations cause the closure of calcium channels (Eckert & Chad 1984; von Gersdorff & Matthews 1996). In this case, the rate and degree of inactivation were dependent on the size of the calcium current. Taken together, the bipolar cell recordings suggest that the desensitization mechanism is controlled by voltage-gated calcium channel inactivation and is independent of synaptic vesicle depletion. For retinal prosthesis function and the prevention of percept fading, controlling the amplitude of the depolarizing voltage transient may be advantageous because the amplitude and timing of the voltage transient correlate with the number of vesicles that are available for release from the synaptic terminal (Gomis et al. 1999; Palmer 2006). It may be possible to use repetitive subthreshold stimulation to activate inner retinal neurons to generate a sustained response and to mitigate synaptic vesicle depletion (Sekhar et al. 2016).
4.6. Inhibitory Postsynaptic Potentials
In 14 of 39 bipolar cells, hyperpolarizing voltage transients that are likely IPSPs driven by amacrine cell activity were detected. IPSPs were observed with and without the presence of a depolarizing voltage transient (Figure 8). Previous evidence suggests that the mechanism of action first involves the release of glutamate from bipolar cell terminals that drives activity in amacrine cells (Margalit & Thoreson 2006; Tsai et al. 2011). Amacrine cells can release gamma-aminobutyric acid (GABA) on to bipolar cells or make reciprocal connections with the stimulating bipolar cells (Vigh et al. 2011). The latency of the IPSPs were in the same range regardless of the stimulation amplitude and pulse width with leading edge of the IPSP burst beginning approximately 200 ms after the stimulus presentation. Dual patch clamp recordings of amacrine cells and bipolar cells in the goldfish retina demonstrate similar transmission latencies (50–100 ms) when stimulating amacrine cells first and recording the response in bipolar cells (Vickers et al. 2012). This onset latency is approximately half the IPSP latency reported in this study.
The IPSP bursts demonstrated lower and upper stimulation thresholds (Figure 9). An upper threshold phenomenon has been observed during the direct activation of RGCs (Boinagrov et al. 2012). The upper stimulation threshold was attributed to the decreased sodium current driving force and eventual reversal of the sodium channel current at high stimulation amplitudes. If sodium channels in amacrine cells also experience a reversal current flow, then the finding that amacrine cells are not directly activated by extracellular stimulation may require further examination (Margalit & Thoreson 2006; Tsai et al. 2009). Paired patch clamp recordings between bipolar and amacrine cells have demonstrated that the application of voltage-gated sodium channel blocker tetrodotoxin may partially suppress amacrine cell feedback activity in bipolar cells (Hartveit 1999; Chavez et al. 2010). An alternative or complementary explanation for the upper and lower IPSP stimulation thresholds is that they are caused by the balance of direct and serial inhibition by amacrine cells (Eggers & Lukasiewicz 2011; Eggers & Lukasiewicz 2010). Low amplitude stimulation activates a region of neurons local to the electrode that may preferentially invoke direct inhibition whereby amacrine cells directly inhibit bipolar cells. Higher stimulation amplitudes activate larger regions of neurons that begin to activate more of the amacrine cell network, which causes serial inhibition between amacrine cells and reduces inhibition of bipolar cells. Therefore, IPSPs in bipolar cells could exhibit a maximum prominence in response to a moderate stimulation amplitude that causes minimal amacrine cell inhibition and significant bipolar cell inhibition.
IPSPs were also present in the repeated stimulation experiments. With a constant stimulation amplitude, low pulse rate (≤2 pps) stimulation evoked multiple bursts of IPSPs during the stimulus duration, but higher pulse rate stimulation only evoked bursting within the first second of stimulation (Figure 13). This suggests a stimulus frequency-dependent activation, which is potentially coupled with synaptic vesicle release, in addition to the amplitude dependence.
5. Conclusion
Using a novel wholemount retina preparation technique, we have been able to characterize the activity of bipolar cells to electrical stimulation, and indirectly characterize putative inhibitory amacrine cell activity. We found that ON-type bipolar cells have a depolarizing voltage transient response to electrical stimulation that is dependent on the amplitude, pulse width, and frequency of the stimulus. This study focused on ON-type bipolar cells (these were the labeled cells) leaving the OFF-bipolar cell pathway unexplored. Characterization of the OFF pathway will be important to advance our understanding of how the inner retina as a system responds to electrical stimulation. Initial examinations of OFF-type cone bipolar cell activity report fast hyperpolarizations and slow depolarizations in both wild-type and rd1 mouse retina (Cameron et al. 2013). Our results suggest that retinal degeneration does not increase stimulation thresholds in bipolar cells. We have identified inhibitory activity at the synapse of bipolar cells that is likely mediated by amacrine cells. Further examination of its non-linear dependence on stimulation amplitude and its variable response to high rates of stimulation will be useful for understanding the response of the inner retina and may be leveraged in advanced retinal stimulation paradigms.
Significance.
This investigation uses patch clamp electrophysiology to provide direct analysis of ON-type bipolar cell responses to electrical stimulation in a wholemount retina preparation. It explores the effects of variable stimulus amplitudes, pulse widths, and frequencies in both normal and degenerate retina. The analysis adds to a body of work largely based upon indirect measurements of bipolar cell activity, and the methodology demonstrates an alternative retina preparation technique in which to acquire single-cell activity.
6. Funding / Grants
This research has been supported by the National Eye Institute (Grants RO1 EY022931 and EY022931-S1), National Science Foundation (Grant CBET 1343193), National Institutes of Health (Grants U01MH098937 and P41EB002182), Department of Defense (Grant MR152020), the USC Institute for Biomedical Therapeutics, and a Departmental grant from Research to Prevent Blindness.
7. References
- Ayton LN, Blamey PJ, Guymer RH, Luu CD, Nayagam D. a. X., Sinclair NC, et al. , 2014. First-in-Human Trial of a Novel Suprachoroidal Retinal Prosthesis. PLoS ONE, 9(12), p.e115239. [DOI] [PMC free article] [PubMed] [Google Scholar]
- Baden T, Esposti F, Nikolaev A & Lagnado L, 2011. Spikes in retinal bipolar cells phase-lock to visual stimuli with millisecond precision. Current Biology, 21(22), pp.1859–1869. [DOI] [PMC free article] [PubMed] [Google Scholar]
- Behrend MR, 2009. Viewing the picture we paint. PhD Thesis, University of Southern California, (May). [Google Scholar]
- Behrend MR, Ahuja AK, Humayun MS, Chow RH & Weiland JD, 2011. Resolution of the epiretinal prosthesis is not limited by electrode size. IEEE Transactions on Neural Systems and Rehabilitation Engineering, 19(4), pp.436–442. [DOI] [PMC free article] [PubMed] [Google Scholar]
- Boinagrov D, Pangratz-Fuehrer S, Suh B, Mathieson K, Naik N & Palanker D, 2012. Upper threshold of extracellular neural stimulation. Journal of Neurophysiology, 108(12), pp.3233–3238. [DOI] [PMC free article] [PubMed] [Google Scholar]
- Bourinet E, Charnet P, Tomlinson W, Stea A, Snutch T & Nargeot J, 1994. Voltage-dependent facilitation of a neuronal alpha 1C L-type calcium channel. The EMBO Journal, 13(21), p.5032. [DOI] [PMC free article] [PubMed] [Google Scholar]
- Cameron MA, Suaning GJ, Lovell NH & Morley JW, 2013. Electrical Stimulation of Inner Retinal Neurons in Wild-Type and Retinally Degenerate (rd/rd) Mice. PLoS ONE, 8(7), pp.1–12. [DOI] [PMC free article] [PubMed] [Google Scholar]
- Chavez AE, Grimes WN & Diamond JS, 2010. Mechanisms Underlying Lateral GABAergic Feedback onto Rod Bipolar Cells in Rat Retina. Journal of Neuroscience, 30(6), pp.2330–2339. [DOI] [PMC free article] [PubMed] [Google Scholar]
- Cho A, Ratliff C, Sampath A & Weiland J, 2016. Changes in ganglion cell physiology during retinal degeneration influence excitability by prosthetic electrodes. Journal of Neural Engineering, 13(2), p.025001. [DOI] [PMC free article] [PubMed] [Google Scholar]
- Eckert R & Chad JE, 1984. Inactivation of Ca channels. Progress in Biophysics and Molecular Biology, 44(3), pp.215–267. [DOI] [PubMed] [Google Scholar]
- Eggers ED & Lukasiewicz PD, 2010. Interneuron circuits tune inhibition in retinal bipolar cells. Journal of neurophysiology, 103(1), pp.25–37. [DOI] [PMC free article] [PubMed] [Google Scholar]
- Eggers ED & Lukasiewicz PD, 2011. Multiple pathways of inhibition shape bipolar cell responses in the retina. Visual neuroscience, 28(1), pp.95–108. [DOI] [PMC free article] [PubMed] [Google Scholar]
- Eickenscheidt M, Jenkner M, Thewes R, Fromherz P & Zeck G, 2012. Electrical stimulation of retinal neurons in epiretinal and subretinal configuration using a multicapacitor array. Journal of Neurophysiology, 107(10), pp.2742–2755. [DOI] [PubMed] [Google Scholar]
- Feigenspan A & Babai N, 2015. Functional properties of spontaneous excitatory currents and encoding of light/dark transitions in horizontal cells of the mouse retina. The European journal of neuroscience, 42(9), pp.2615–32. [DOI] [PubMed] [Google Scholar]
- Frech MJ & Backus KH, 2004. Characterization of inhibitory postsynaptic currents in rod bipolar cells of the mouse retina. Visual neuroscience, 21, pp.645–652. [DOI] [PubMed] [Google Scholar]
- Freeman DK & Fried SI, 2011. Multiple components of ganglion cell desensitization in response to prosthetic stimulation. Journal of neural engineering, 8, p.016008. [DOI] [PMC free article] [PubMed] [Google Scholar]
- Freeman DK, Rizzo JF & Fried SI, 2011. Encoding visual information in retinal ganglion cells with prosthetic stimulation. Journal of neural engineering, 8(3), p.035005. [DOI] [PMC free article] [PubMed] [Google Scholar]
- Gargini C, Terzibasi E, Mazzoni F & Strettoi E, 2007. Retinal organization in the retinal degeneration 10 (rd10) mutant mouse: A morphological and ERG study. Journal of Comparative Neurology, 500(2), pp.222–238. [DOI] [PMC free article] [PubMed] [Google Scholar]
- von Gersdorff H & Matthews G, 1996. Calcium-dependent inactivation of calcium current in synaptic terminals of retinal bipolar neurons. The Journal of neuroscience : the official journal of the Society for Neuroscience, 16(1), pp.115–122. [DOI] [PMC free article] [PubMed] [Google Scholar]
- Gomis a, Burrone J & Lagnado L, 1999. Two actions of calcium regulate the supply of releasable vesicles at the ribbon synapse of retinal bipolar cells. The Journal of neuroscience : the official journal of the Society for Neuroscience, 19(15), pp.6309–6317. [DOI] [PMC free article] [PubMed] [Google Scholar]
- Gong S, Zheng C, Doughty ML, Losos K, Didkovsky N, Schambra UB, et al. , 2003. A gene expression atlas of the central nervous system based on bacterial artificial chromosomes. Nature, 425, pp.917–925. [DOI] [PubMed] [Google Scholar]
- Goo YS, Ye JH, Lee S, Nam Y, Ryu SB & Kim KH, 2011. Retinal ganglion cell responses to voltage and current stimulation in wild-type and rd1 mouse retinas. Journal of Neural Engineering, 8(3), p.035003. [DOI] [PubMed] [Google Scholar]
- Greenberg RJ, Velte TJ, Humayun MS, Scarlatis GN & de Juan E, 1999. A computational model of electrical stimulation of the retinal ganglion cell. IEEE transactions on bio-medical engineering, 46(5), pp.505–514. [DOI] [PubMed] [Google Scholar]
- Hartveit E, 1999. Reciprocal synaptic interactions between rod bipolar cells and amacrine cells in the rat retina. Journal of neurophysiology, 81(6), pp.2923–2936. [DOI] [PubMed] [Google Scholar]
- Huang L, Max M, Margolskee RF, Su H, Masland RH & Euler T, 2003. G protein subunit Gɣ13 is coexpressed with Gαo, Gβ3, and Gβ4 in retinal ON bipolar cells. Journal of Comparative Neurology, 455(1), pp.1–10. [DOI] [PubMed] [Google Scholar]
- Humayun MS, Dorn JD, Da Cruz L, Dagnelie G, Sahel JA, Stanga PE, et al. , 2012. Interim results from the international trial of second sight’s visual prosthesis. Ophthalmology, 119(4), pp.779–788. [DOI] [PMC free article] [PubMed] [Google Scholar]
- Humayun MS, de Juan E Jr, Dagnelie G, Greenberg RJ, Propst RH & Phillips DH, 1996. Visual Perception Elicited by Electrical Stimulation of Retina in Blind Humans. Archives of Ophthalmology, 114(1), p.40. [DOI] [PubMed] [Google Scholar]
- Im M & Fried SI, 2015. Indirect activation elicits strong correlations between light and electrical responses in ON but not OFF retinal ganglion cells. The Journal of Physiology, 593(16), pp.3577–3596. [DOI] [PMC free article] [PubMed] [Google Scholar]
- Im M & Fried SI, 2016. Temporal properties of network-mediated responses to repetitive stimuli are dependent upon retinal ganglion cell type. Journal of Neural Engineering, 13(2), p.025002. [DOI] [PMC free article] [PubMed] [Google Scholar]
- Jensen RJ & Rizzo JF, 2008. Activation of retinal ganglion cells in wild-type and rd1 mice through electrical stimulation of the retinal neural network. Vision Research, 48(14), pp.1562–1568. [DOI] [PubMed] [Google Scholar]
- Jensen RJ & Rizzo JF, 2007. Responses of ganglion cells to repetitive electrical stimulation of the retina. Journal of neural engineering, 4(1), pp.S1–S6. [DOI] [PubMed] [Google Scholar]
- Jensen RJ, Ziv OR & Rizzo JF, 2005. Responses of rabbit retinal ganglion cells to electrical stimulation with an epiretinal electrode. Journal of neural engineering, 2(1), pp.S16–S21. [DOI] [PubMed] [Google Scholar]
- Jensen RJ, Ziv OR & Rizzo JF, 2005. Thresholds for Activation of Rabbit Retinal Ganglion Cells with Relatively Large, Extracellular Microelectrodes. Investigative Opthalmology & Visual Science, 46(4), p.1486. [DOI] [PubMed] [Google Scholar]
- Lapicque L, 1931. Has the muscular substance a longer chronaxie than the nervous substance?1. The Journal of Physiology, 73(2), pp.189–214. [DOI] [PMC free article] [PubMed] [Google Scholar]
- Margalit E, Babai N, Luo J & Thoreson WB, 2011. Inner and outer retinal mechanisms engaged by epiretinal stimulation in normal and rd mice. Visual neuroscience, 28, pp.145–154. [DOI] [PMC free article] [PubMed] [Google Scholar]
- Margalit E & Thoreson WB, 2006. Inner retinal mechanisms engaged by retinal electrical stimulation. Investigative Ophthalmology and Visual Science, 47(6), pp.2606–2612. [DOI] [PMC free article] [PubMed] [Google Scholar]
- Mennerick S, Zenisek D & Matthews G, 1997. Static and dynamic membrane properties of large-terminal bipolar cells from goldfish retina: experimental test of a compartment model. Journal of Neurophysiology, 78(1), pp.51–62. [DOI] [PubMed] [Google Scholar]
- Nanduri D, 2011. Prosthetic Vision in Blind Human Patients: Predicting the Percepts of Epiretinal Stimulation. University of Southern California. [Google Scholar]
- Nanduri D, Fine I, Horsager A, Boynton GM, Humayun MS, Greenberg RJ, et al. , 2012. Frequency and amplitude modulation have different effects on the percepts elicited by retinal stimulation. Investigative Ophthalmology and Visual Science, 53(1), pp.205–214. [DOI] [PMC free article] [PubMed] [Google Scholar]
- Neher E, 1992. Correction for liquid junction potentials in patch clamp experiments. Methods in enzymology, 207(1991), pp.123–131. [DOI] [PubMed] [Google Scholar]
- Palmer MJ, 2006. Modulation of Ca(2+)-activated K+ currents and Ca(2+)-dependent action potentials by exocytosis in goldfish bipolar cell terminals. The Journal of physiology, 572(Pt 3), pp.747–762. [DOI] [PMC free article] [PubMed] [Google Scholar]
- Pérez Fornos A, Sommerhalder J, da Cruz L, Sahel JA, Mohand-Said S, Hafezi F, et al. , 2012. Temporal Properties of Visual Perception on Electrical Stimulation of the Retina. Investigative Ophthalmology & Visual Science, 53(6), pp.2720–2731. [DOI] [PubMed] [Google Scholar]
- Petrossians A, Davuluri N, Whalen JJ, Mansfeld F & Weiland JD, 2014. Improved Biphasic Pulsing Power Efficiency with Pt-Ir Coated Microelectrodes. MRS Proceedings, 1621, pp.249–257. [Google Scholar]
- Petrossians A, Whalen JJ, Weiland JD & Mansfeld F, 2011. Electrodeposition and Characterization of Thin-Film Platinum-Iridium Alloys for Biological Interfaces [J. Electrochem. Soc., 158, D269 (2011)]. Journal of The Electrochemical Society, 158(6), p.S15. [Google Scholar]
- Protti D. a & Llano I, 1998. Calcium currents and calcium signaling in rod bipolar cells of rat retinal slices. The Journal of neuroscience : the official journal of the Society for Neuroscience, 18(10), pp.3715–3724. [DOI] [PMC free article] [PubMed] [Google Scholar]
- Ray A, Sun GJ, Chan L, Grzywacz NM, Weiland J & Lee E-J, 2010. Morphological alterations in retinal neurons in the S334ter-line3 transgenic rat. Cell and Tissue Research, 339(3), pp.481–491. [DOI] [PubMed] [Google Scholar]
- Sekhar S, Jalligampala A, Zrenner E & Rathbun DL, 2016. Tickling the retina: integration of subthreshold electrical pulses can activate retinal neurons. Journal of Neural Engineering, 13(4), p.046004. [DOI] [PubMed] [Google Scholar]
- Sekirnjak C, Hottowy P, Sher A, Dabrowski W, Litke AM & Chichilnisky EJ, 2006. Electrical stimulation of mammalian retinal ganglion cells with multielectrode arrays. Journal of neurophysiology, 95(6), pp.3311–3327. [DOI] [PubMed] [Google Scholar]
- Stingl K, Bartz-Schmidt KU, Besch D, Chee CK, Cottriall CL, Gekeler F, et al. , 2015. Subretinal Visual Implant Alpha IMS – Clinical trial interim report. Vision Research, 111, pp.149–160. [DOI] [PubMed] [Google Scholar]
- Tamás G, Buhl EH & Somogyi P, 1997. Fast IPSPs elicited via multiple synaptic release sites by different types of GABAergic neurone in the cat visual cortex. The Journal of physiology, 500 ( Pt 3(1997), pp.715–38. [DOI] [PMC free article] [PubMed] [Google Scholar]
- Trenholm S, Borowska J, Zhang J, Hoggarth A, Johnson K, Barnes S, et al. , 2012. Intrinsic oscillatory activity arising within the electrically coupled AII amacrine-ON cone bipolar cell network is driven by voltage-gated Na + channels. The Journal of Physiology, 590(10), pp.2501–2517. [DOI] [PMC free article] [PubMed] [Google Scholar]
- Tsai D, Morley JW, Suaning GJ & Lovell NH, 2009. Direct Activation and Temporal Response Properties of Rabbit Retinal Ganglion Cells Following Subretinal Stimulation. , pp.2982–2993. [DOI] [PubMed] [Google Scholar]
- Tsai D, Morley JW, Suaning GJ & Lovell NH, 2011. Responses of starburst amacrine cells to prosthetic stimulation of the retina. Proceedings of the Annual International Conference of the IEEE Engineering in Medicine and Biology Society, EMBS, pp.1053–1056. [DOI] [PubMed] [Google Scholar]
- Vickers E, Kim M-H, Vigh J & von Gersdorff H, 2012. Paired-Pulse Plasticity in the Strength and Latency of Light-Evoked Lateral Inhibition to Retinal Bipolar Cell Terminals. Journal of Neuroscience, 32(34), pp.11688–11699. [DOI] [PMC free article] [PubMed] [Google Scholar]
- Vigh J, Vickers E & von Gersdorff H, 2011. Light-evoked lateral GABAergic inhibition at single bipolar cell synaptic terminals is driven by distinct retinal microcircuits. J Neurosci, 31(44), pp.15884–15893. [DOI] [PMC free article] [PubMed] [Google Scholar]
- Walston ST, Chang Y-C, Weiland JD & Chow RH, 2017. Method to Remove Photoreceptors from Wholemount Retina in vitro. Journal of Neurophysiology, p.jn.00578.2017. [DOI] [PMC free article] [PubMed] [Google Scholar]
- Weiland JD, Walston ST & Humayun MS, 2016. Electrical Stimulation of the Retina to Produce Artificial Vision. Annual Review of Vision Science, 2(1), pp.273–294. [DOI] [PubMed] [Google Scholar]
- Weitz AC, Behrend MR, Ahuja AK, Christopher P, Wei J, Wuyyuru V, et al. , 2014. Interphase gap as a means to reduce electrical stimulation thresholds for epiretinal prostheses. Journal of neural engineering, 11(1), p.016007. [DOI] [PMC free article] [PubMed] [Google Scholar]
- Weitz AC, Nanduri D, Behrend MR, Gonzalez-Calle A, Greenberg RJ, Humayun MS, et al. , 2015. Improving the spatial resolution of epiretinal implants by increasing stimulus pulse duration. Science Translational Medicine, 7(318), pp.318ra203–318ra203. [DOI] [PMC free article] [PubMed] [Google Scholar]
- Williams SR & Stuart GJ, 2002. Dependence of EPSP efficacy on synapse location in neocortical pyramidal neurons. Science (New York, N.Y.), 295(5561), pp.1907–10. [DOI] [PubMed] [Google Scholar]
- Zenisek D & Matthews G, 1998. Calcium action potentials in retinal bipolar neurons. Visual neuroscience, 15, pp.69–75. [DOI] [PubMed] [Google Scholar]
- Zrenner E, Bartz-Schmidt KU, Benav H, Besch D, Bruckmann A, Gabel V-P, et al. , 2011. Subretinal electronic chips allow blind patients to read letters and combine them to words. Proceedings of the Royal Society B: Biological Sciences, 278(1711), pp.1489–1497. [DOI] [PMC free article] [PubMed] [Google Scholar]
- Zucker RS & Regehr WG, 2002. Short-Term Synaptic Plasticity. Annual Review of Physiology, 64(1), pp.355–405. [DOI] [PubMed] [Google Scholar]
- Zühlke RD, Pitt GS, Deisseroth K, Tsien RW & Reuter H, 1999. Calmodulin supports both inactivation and facilitation of L-type calcium channels. Nature, 399(6732), pp.159–162. [DOI] [PubMed] [Google Scholar]


