CRISPR-Cas base editor technology enables targeted nucleotide alterations and is being rapidly deployed for research and potential therapeutic applications1,2. The most widely used base editors induce DNA cytosine (C) deamination with rat APOBEC1 (rAPOBEC1) enzyme, which is targeted by a linked Cas protein-guide RNA (gRNA) complex3,4. Previous studies of cytosine base editor (CBE) specificity have identified off-target DNA edits in human cells5,6. Here we show that a CBE with rAPOBEC1 can cause extensive transcriptome-wide RNA cytosine deamination in human cells, inducing tens of thousands of C-to-uracil (U) edits with frequencies ranging from 0.07% to 100% in 38% - 58% of expressed genes. CBE-induced RNA edits occur in both protein-coding and non-protein-coding sequences and generate missense, nonsense, splice site, 5’ UTR, and 3’ UTR mutations. We engineered two CBE variants bearing rAPOBEC1 mutations that substantially decrease the numbers of RNA edits (reductions of >390-fold and >3,800-fold) in human cells. These variants also showed more precise on-target DNA editing and, with the majority of gRNAs tested, editing efficiencies comparable to those observed with wild-type CBE. Finally, we show that recently described adenine base editors (ABEs) can also induce transcriptome-wide RNA edits. These results have important implications for the research and therapeutic uses of base editors, illustrate the feasibility of engineering improved variants with reduced RNA editing activities, and suggest the need to more fully define and characterize the RNA off-target effects of deaminase enzymes in base editor platforms.
rAPOBEC1, which is present in the widely used BE33 and BE44 CBEs, is well known as a DNA cytosine deaminase7,8 but the earliest studies of this enzyme more than 25 years ago actually initially characterized its RNA cytosine deaminase activity9,10 (Fig. 1a). Subsequent work revealed endogenous expression or overexpression of APOBEC1 can lead to modification of Cs in dozens of other transcripts beyond APOB and in multiple cell types11–14. However, although CBEs containing rAPOBEC1 have now been used to edit DNA sequences in a variety of different organisms and cell types1, the field has not, to our knowledge, focused on whether these editors might also cause C-to-U changes in RNA (Fig. 1a).
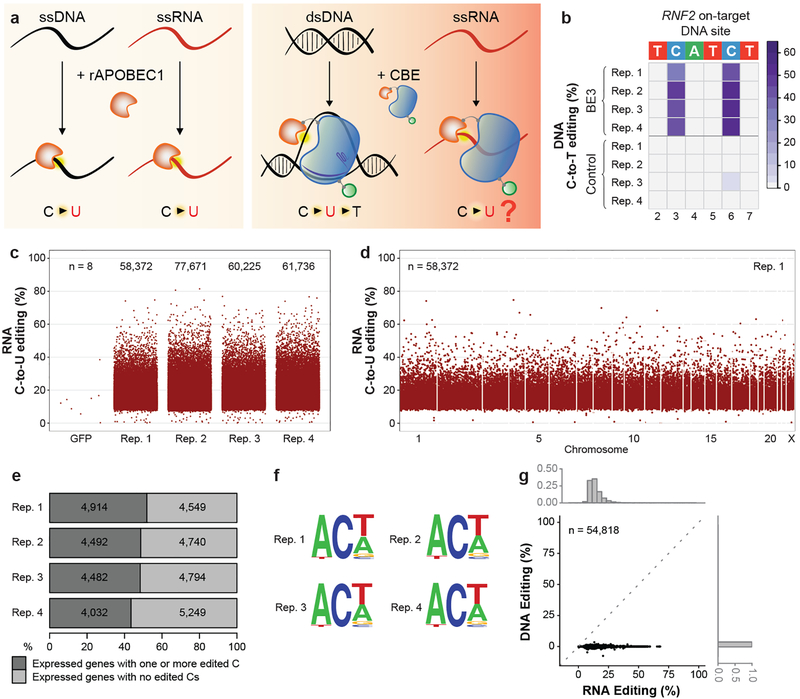
Figure 1. Transcriptome-wide off-target C-to-U RNA editing induced by BE3 in human liver-derived HepG2 cells.
(a) Schematic of known rat APOBEC1 (rAPOBEC1) enzymatic activities (left panel) and known and unknown activities of a CBE harboring rAPOBEC1 (right panel). rAPOBEC1 = orange shape, nCas9 = blue shape, gRNA = violet line, UGI = green circle. Yellow halos depict cytosine deamination. (b) Heat map showing on-target efficiencies of BE3 and nickase Cas9(nCas9)-UGI-NLS (Control) within the editing window of RNF2 site 1 (bases numbered with 1 as the most PAM distal). In this (and all main figures), C12 in the spacer is not shown because of its relatively low editing efficiency but comprehensive quantitation of edit efficiencies of all spacer cytosines are in Extended Data Fig. 1a. (c) Jitter plots showing efficiencies of C-to-U editing (y-axis) from RNA-seq experiments with BE3 expression or a GFP negative control (Methods). n = total number of modified cytosines. See Methods for details about which edited cytosines are depicted in these plots. (d) Manhattan plot of modified cytosines across the transcriptome for replicate 1 from (c). n = total number of modified cytosines. (e) Percentages of expressed genes in each RNA-seq replicate with at least one edited cytosine. Numbers of expressed genes are shown. (f) Sequence logos from edited cytosines identified in each RNA-seq replicate. Generated RNA-seq data using cDNA, thus every T should be considered a U in RNA. (g) Scatterplot correlating RNA editing rates (%, x-axis) of 54,818 cytosines edited by BE3 with DNA editing rates (%, y-axis) as determined by WES (n=3 biologically independent samples, pooled data). Histograms depict fractions of edited cytosines on RNA (upper x-axis) or DNA (right y-axis). Rep. = Replicate; ss = single-stranded; ds = double-stranded.
To test whether CBEs might also deaminate RNA cytosines, we examined the activity of BE3 in human liver-derived HepG2 cells. We co-transfected HepG2 cells with plasmids encoding BE3 or a negative control nickase Cas9 (nCas9)-UGI-NLS fusion (i.e., BE3 without rAPOBEC1) and a gRNA targeted to a human RNF2 gene site (Methods). Because HepG2 cells are not efficient for transfection (data not shown), we assessed genomic DNA and total RNA from FACS-sorted cells with the highest 5% of GFP signal (BE3 and nCas9-UGI-NLS are encoded on our plasmids as co-translation fusions to EGFP; Methods). Quadruplicate experiments confirmed efficient on-target DNA editing by BE3 at the RNF2 site (mean frequencies of 41% and 50% at positions C3 and C6, respectively; Fig. 1b, Extended Data Fig. 1a, and Supplementary Table 1). To assess RNA editing, we used targeted RNA amplicon sequencing (Methods) to examine cytosines in the human APOB transcript (at position 6666 and other positions previously shown to be deaminated by APOBEC113–16). This revealed editing by BE3 at many of these RNA cytosines, with the most efficient editing observed at C6666 (Extended Data Fig. 1b and Supplementary Table 1). Targeted DNA amplicon sequencing of the genomic APOB locus confirmed that C-to-U RNA alterations were not due to DNA edits (Extended Data Fig. 1b and Supplementary Table 1).
We assessed transcriptome-wide RNA base editing by BE3 in these same transfected HepG2 cells using RNA-seq (~70–100 million reads/library) performed with total RNA. Utilizing GATK Best Practices for variant calling and further downstream filtering, we identified RNA base positions altered in cells expressing BE3 compared to control cells expressing nCas9-UGI-NLS (Methods). This unbiased analysis showed the vast majority (99.986% to 99.995%) of alterations were C-to-U changes (Extended Data Table 1), with tens of thousands of such edits observed in all four replicates and very few in negative control cells expressing only GFP (Fig. 1c, Extended Data Fig. 1c, and Supplementary Table 2). C-to-U alterations were induced with frequencies ranging from 0.07% to 81.48% (mean of 16.42% with 95% CI 16.40–16.45%) (Fig. 1c, Extended Data Fig. 1c, and Supplementary Table 2) and were distributed throughout the transcriptome (Fig. 1d, Extended Data Fig. 1d, and Supplementary Table 2). Strikingly, 43 to 52% of the genes detected in these RNA-seq experiments had at least one C-to-U edit (Fig. 1e). Alterations were found in coding sequence (with a mean of 19.1% of all C edits creating missense or nonsense mutations) and non-coding sequence (with a substantial percentage in 3’ UTRs but also some in splice sites and 5’ UTRs) (Extended Data Fig. 1e and Supplementary Table 3). 36% of edited C positions were found in three or four of the replicates and these bases generally showed a higher range of editing frequencies than those found in only one or two replicates (Extended Data Fig. 1f), suggesting that BE3 is consistently editing particular cytosines. This hypothesis is further supported by the observation that edited RNA cytosines preferentially lie within a consensus motif ACW (W = A or U) in all four replicates (Fig. 1f), matching a sequence previously identified with wild-type APOBEC1 enzyme7,12. Importantly, using whole-exome sequencing (WES) that captures both exons and UTRs, we were able to sequence with 100X coverage (in pooled triplicates) 49% of cytosines identified as edited on RNA and found that 98.48% of these showed no evidence of DNA editing (Fig. 1g; Supplementary Table 4), confirming that the edits observed in the RNA-seq experiments are not caused by editing of corresponding DNA sequences.
To test whether transcriptome-wide RNA editing can also occur in a non-liver human cell line, we examined BE3 with two gRNAs (targeted to sites in the human RNF2 and EMX1 genes) in human HEK293T cells. As expected, we found efficient on-target DNA editing by BE3 with the RNF2 and EMX1 gRNAs each performed in triplicate (Extended Data Figs. 2a and 2b, and Supplementary Table 5). RNA-seq experiments again revealed tens of thousands of C-to-U edits induced by BE3 with each gRNA in all replicates with editing efficiencies ranging from 0.07% to 66.7% (mean of 14.22% with 95% CI 14.20 – 14.24%) (Extended Data Figs. 2c and 2d, Extended Data Table 1, and Supplementary Tables 6 and 7). Edits were distributed transcriptome-wide in both coding and non-coding (Extended Data Fig. 2e, Extended Data Fig. 3a, and Supplementary Tables 8 and 9) with 38–52% and 47–51% of expressed genes having at least one C-to-U edit for the RNF2 and EMX1 gRNAs, respectively (Extended Data Fig. 3b). A substantial percentage of edited cytosines were found in two or three of the replicates for each gRNA (31% and 34% for RNF2 and EMX1 gRNAs, respectively) (Extended Data Fig. 3c). RNA edits again occurred within a consensus motif of the form ACW (Extended Data Fig. 3d) and a large fraction of all cytosines edited were observed with both the RNF2 and EMX1 gRNAs (Extended Data Fig. 3e).
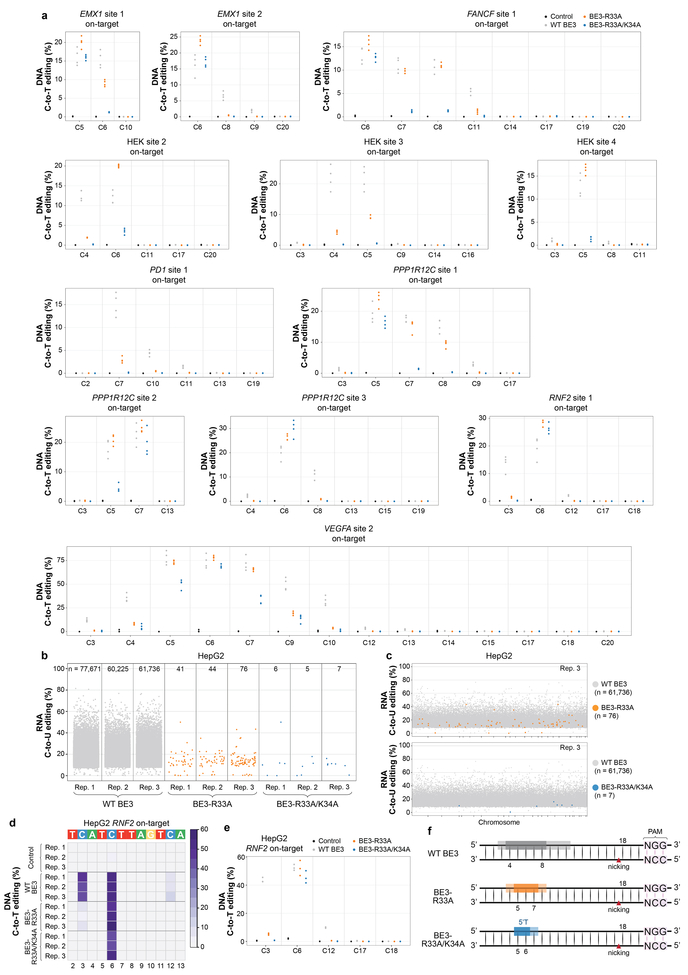
To examine the dose-dependence of BE3-mediated RNA editing, we transfected HEK293T cells and sorted for cells with the highest 5% of GFP signal. For these experiments, we assessed BE3 with three different gRNAs: the RNF2 and EMX1 gRNAs and a third targeted to a site that does not occur in the human genome (non-targeted or NT gRNA). We observed higher efficiency on-target DNA editing by BE3 with the RNF2 and EMX1 gRNAs (Extended Data Figs. 4a and 4b, and Supplementary Table 10) relative to the previous HEK293T experiments described above (Extended Data Figs. 2a and 2b). In addition, BE3 with the RNF2, EMX1, and NT gRNAs also induced higher numbers of C-to-U edits (means of 149,973; 124,428; and 145,028, respectively) (Extended Data Fig. 4c, Extended Data Table 1, and Supplementary Tables 11 – 13) at higher mean frequencies throughout the transcriptome (26%, 27%, and 25%, respectively) (Extended Data Figs. 4d and 4e, and Supplementary Tables 11 - 13) and with a greater percentage and higher absolute number of edits occurring in coding sequences (Extended Data Fig. 5a and Supplementary Tables 14 – 16). A higher percentage of expressed genes had at least one or more C-to-U edit: means of 58%, 51%, and 58% for the RNF2, EMX1, and NT gRNA experiments, respectively (Extended Data Fig. 5b). As before, edits occurred within a consensus motif of the form ACW in all replicates (Extended Data Fig. 5c). A large fraction of edited cytosines were observed with all three gRNAs (including the NT gRNA) (Extended Data Fig. 5d) and replicates performed with the same gRNA do not seem to share more off-targets than those performed with different gRNAs (Extended Data Fig. 5e), again suggesting that RNA edits induced by BE3 are gRNA-independent. Using WES, we sequenced 60% of the cytosines at 100X coverage (pooled data from triplicates) edited in RNA (from the experiment with the RNF2 gRNA) and confirmed that 98.52% of these cytosines showed no DNA editing (Extended Data Fig. 5f and Supplementary Table 17).
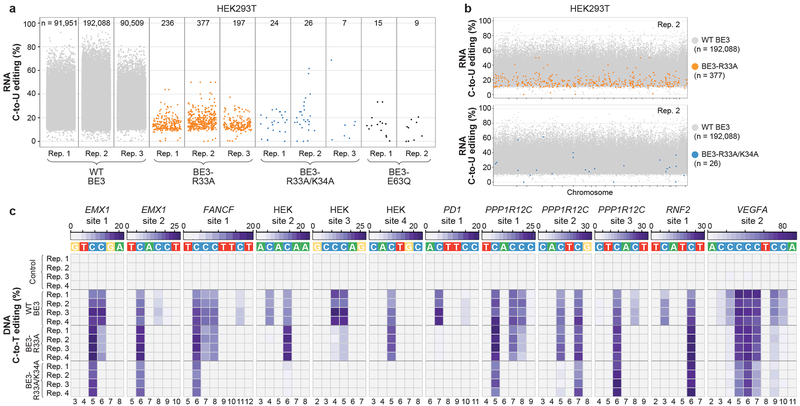
To engineer SElective Curbing of Unwanted RNA Editing (SECURE) variants that would show reduced RNA editing but still possess efficient on-target DNA base editing activities, we screened 16 BE3 editors harboring various rAPOBEC1 mutations previously reported to reduce RNA C-to-U editing17–21. We identified two variants (BE3-R33A and BE3-R33A/K34A) that had on-target DNA editing efficiencies comparable to wild-type BE3 (data not shown) but that also showed substantially reduced RNA editing activities even when highly expressed in HEK293T cells (Extended Data Fig. 6a, Extended Data Table 1, and Supplementary Table 18). To more rigorously characterize RNA editing by these two variants, we performed RNA-seq experiments with the RNF2 gRNA using transfected HEK293T cells sorted for high-level expression of wild-type BE3, BE3-R33A, BE3-R33A/K34A, or a catalytically impaired BE3-E63Q mutant18. For these studies, we used high expression conditions (top 5% sorting) to enable the most sensitive detection of any residual RNA editing by these variants. We observed dramatic reductions in the number of transcriptome-wide C-to-U edits with BE3-R33A inducing only hundreds and BE3-R33A/K34A inducing 26 or fewer of such edits (Figs. 2a and 2b, Extended Data Table 1, and Supplementary Tables 19 - 22). The number of edits observed with BE3-R33A/K34A were similar to the baseline number seen with the catalytically impaired BE3-E63Q mutant (Fig. 2a). On-target DNA editing efficiency of the variants was comparable to WT BE3 with the RNF2 gRNA in HEK293T cells (Extended Data Figs. 6b and 6c and Supplementary Table 23).
Figure 2. SECURE-BE3 variants exhibit substantially reduced RNA editing with comparable but more precise DNA editing activities in HEK293T cells.
(a) Jitter plots from RNA-seq experiments in HEK293T cells showing RNA cytosines modified by expression of wild-type (WT) BE3, BE3-R33A, BE3-R33A/K34A, or BE3-E63Q. Y-axis represents the efficiencies of C-to-U RNA editing. n = total number of modified cytosines observed. (b) Manhattan plots showing the distribution of modified cytosines induced by BE3-R33A and BE3-R33A/K34A from replicate 2 in (a) overlaid on modified cytosines induced by WT BE3 (note that the WT BE3 data is the same in the top and bottom plots). (c) Heat maps of on-target DNA base editing efficiencies of WT BE3, BE3-R33A, BE3-R33A/K34A, and nCas9-UGI-NLS (Control) in HEK293T cells with 12 different gRNAs (cells transfected and harvested without sorting). Bases shown are within the editing window of the on-target site (numbered with 1 as the most PAM distal position).
More extensive characterization of BE3-R33A and BE3-R33A/K34A with 12 gRNAs designed for various human genes in HEK293T cells revealed that these variants generally edited on-target sites with efficiencies at least comparable to wild-type BE3 but with higher precision (Fig. 2c, Extended Data Fig. 7a and Supplementary Table 24). These experiments were performed without sorting for GFP expression so that DNA editing activities were assessed without the benefit of higher BE3 variant expression used in the RNA-seq studies described above. Comparable or sometimes higher efficiencies of base editing were observed at 10 of the 12 sites with BE3-R33A and at 8 of the 12 sites with BE3-R33A/K34A. The BE3-R33A variant showed a narrowed editing window with maximum editing at cytosines in spacer positions 5–7 (weaker on C4 and C8) while the BE3-R33A/K34A variant shows an even more restricted editing window (maximum editing on C5–6, weaker editing on C7). Also, our data suggest a relatively stringent 5’T requirement for the BE3-R33A/K34A variant. (Fig. 2c, Extended Data Fig. 7a and Supplementary Table 24). Testing of BE3-R33A and BE3-R33A/K34A with the RNF2 gRNA in HepG2 cells also demonstrated dramatically reduced numbers of RNA edits throughout the transcriptome (Extended Data Figs. 7b and 7c, Extended Data Table 1, and Supplementary Tables 25 – 27) but on-target DNA editing rates similar to those of wild-type BE3 with both variants (Extended Data Figs. 7d and 7e and Supplementary Table 28). A summary of the altered precision observed with the two SECURE variants is provided in Extended Fig. 7f.
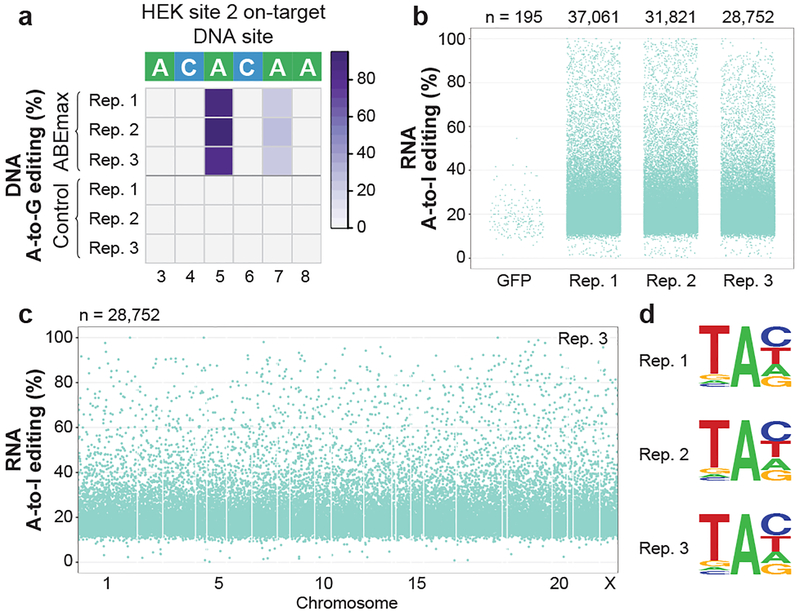
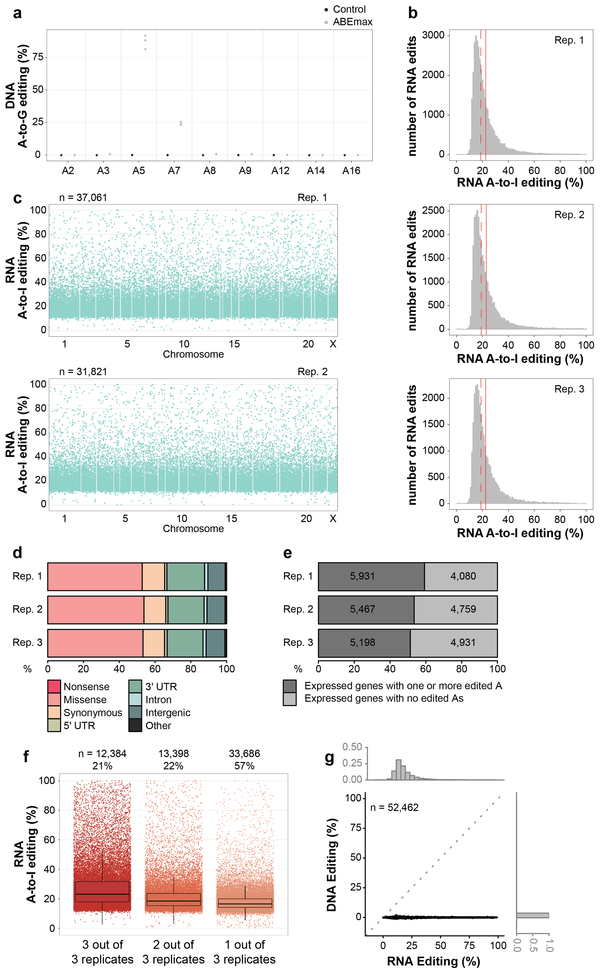
Although CBEs with rAPOBEC1 are now widely used, we wondered whether recently described adenine base editors (ABEs) might also induce RNA edits. ABEs induce targeted adenosine to inosine (A-to-I) DNA alterations and consist of nCas9 fused to a linked heterodimer of E. coli TadA adenosine deaminases (one wild-type and one evolved to deaminate A-to-I in DNA22). Wild-type E.coli TadA normally deaminates adenine 34 (A34) in E.coli tRNAArg2 23,24 but the TadA variant present in ABEs was not specifically evolved for loss of RNA editing activity22. We co-transfected HEK293T cells in triplicate with plasmids encoding ABEmax (GenScript codon-optimized ABE7.10 with bipartite NLSs at the N and C termini25) or a negative control (NLS-nCas9-NLS; i.e., ABEmax lacking TadA domains) and the HEK site 2 gRNA (Methods). In cells sorted for the top 5% of GFP expression, we observed efficient on-target DNA adenine editing at HEK site 2 (mean frequencies of 87% at A5 and 24% at A7; Fig. 3a, Extended Data Fig. 8a, and Supplementary Table 29). RNA-seq analysis revealed tens of thousands of RNA base positions altered in cells expressing ABEmax compared to matched negative control cells expressing NLS-nCas9-NLS, with nearly all (99.76% to 99.83%) being A-to-G edits on cDNA that was reverse transcribed from RNA (which we presume result from A-to-I alterations on RNA) (Extended Data Table 1 and Supplementary Table 30). Frequencies of these adenine edits ranged from 0.1% to 100% (mean of 22.7% with 95% CI 22.6–22.8%) (Fig. 3b, Extended Data Fig. 8b, and Supplementary Table 30) and were distributed throughout the transcriptome (Fig. 3c, Extended Data Fig. 8c, and Supplementary Table 30). RNA edits were found in coding and non-coding sequences (Extended Data Fig. 8d and Supplementary Table 31). Among genes with detectable RNA transcripts, 51 to 59% had at least one adenine edit (Extended Data Fig. 8e). 43% of edited adenine positions were found in two or three replicates and these bases showed higher mean editing frequencies than those found in only one replicate (Extended Data Fig. 8f). In addition, edited adenines preferentially lie within a consensus UA motif (Fig. 3d) that resembles the tRNA substrate of wild-type E. coli TadA. Using WES, we were able to sequence at 100X coverage (pooled data from triplicates) 88% of the adenines edited on RNA and found that 95.39% of these were not edited on DNA (Extended Data Fig. 8g, Supplementary Table 32).
Figure 3. Adenine base editor ABEmax induces transcriptome-wide off-target A-to-I RNA editing in HEK293T cells.
(a) Heat map of on-target DNA base editing efficiencies of ABEmax and NLS-nCas9-NLS (Control) in HEK293T cells with the HEK site 2 gRNA. Bases shown are within the editing window of the on-target site (numbered with 1 as the most PAM distal position). (b) Jitter plots derived from RNA-seq experiments showing RNA adenines modified by ABEmax expression with the HEK site 2 gRNA or a GFP control (Methods). Y-axis represents the efficiencies of A-to-I RNA editing. n = total number of modified adenines observed. (c) Manhattan plot showing the distribution of modified adenines across the transcriptome for replicate 3 from (b). n = total number of modified adenines observed. (d) Sequence logos derived from edited adenines in each RNA-seq replicate. Analysis done using RNA-seq data generated from cDNA, thus every T depicted should be considered a U in RNA.
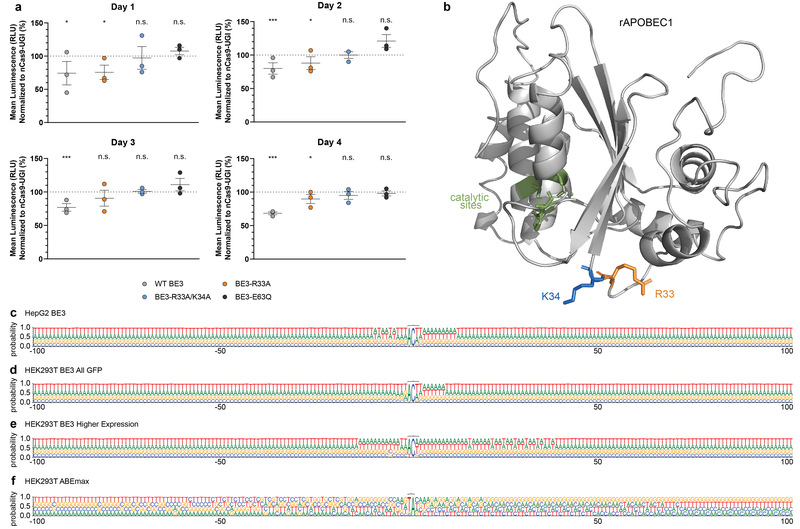
The observation of extensive RNA edits by both cytosine and adenine base editors has important implications for research and therapeutic applications of these technologies. Confounding effects of unwanted RNA editing will need to be accounted for in research studies, especially if stable base editor expression (even in the absence of a gRNA) is used. For human therapeutic applications, the duration and level of BE expression should be kept to the minimums needed. Our data suggest that safety assessments for human therapeutics may need to include an analysis of the potential functional consequences of transcriptome-wide RNA edits. The short timeframe of our transient transfection experiments did not permit us to assess the longer-term functional consequences of widespread RNA editing but initial in silico and experimental analyses we have performed suggest that some edits may have phenotypic impacts on cells (Supplementary Discussion, Supplementary Methods, and Extended Data Fig. 9a).
The SECURE APOBEC1-based CBE variants provide an important proof-of-principle that unwanted RNA editing can be preferentially reduced. No structural information is currently available for rAPOBEC1 but a predicted model we generated suggests that the amino acid positions mutated in our SECURE variants do not lie directly adjacent to the deaminase catalytic residues in three-dimensional space (Extended Data Fig. 9b). The higher precision of on-target DNA editing observed with our SECURE variants reduces targeting range, a limitation that can likely be overcome by using engineered Cas9s with altered PAM recognition specificities. In addition, we expressed the SECURE-BE3 variants from plasmids and it will therefore be important in future experiments to assess their activities when delivered as RNA or ribonucleoprotein complexes to other cell types such as primary cells. Another important question to address is whether SECURE variants might also be engineered for ABEs. In sum, the work described here shows that base editor off-target effects can be more multi-dimensional than those generated by gene-editing nucleases and illustrates how such effects can be defined and minimized for research and therapeutic applications.
Methods:
Molecular cloning.
Expression plasmids were constructed using isothermal assembly (or “Gibson Assembly”, NEB), cloning PCR amplified DNA sequences with matching overlaps into a CAG expression vector for BE3 constructs (AgeI/NotI/EcoRV digest of SQT817, Addgene #53373)26 or a CMV expression vector (AgeI/NotI digest of pCMV-BE1, Addgene #73019) for ABEmax-derived constructs. PCR was conducted using Phusion High-Fidelity DNA Polymerase (NEB). Templates for BE3 cloning PCRs were pCMV-BE3 (Addgene #73021) and pCMV-BE3-P2A-EGFP (BPK4335). pCMV-ABEmax-P2A-EGFP (Addgene #112101) was the only ABE plasmid used as a template. Cas9 gRNAs were cloned into the pUC19-based entry vector BPK1520 (Addgene #65777, BsmBI digest) under control of a U6 promoter. Plasmids for transfection were prepared with QIAGEN Plasmid Maxi and Plus Maxi kits (Qiagen). A list of all cloned CBE and ABE constructs and controls with nucleotide and amino acid sequences can be found in Supplementary Table 33. Guide RNA oligonucleotides used in this study are listed in Supplementary Table 34.
Human cell culture.
HEK293T cells (ATCC CRL-3216) were cultured and passaged in Dulbecco’s Modified Eagle Medium (DMEM, Gibco) supplemented with 10% (v/v) fetal bovine serum (FBS, Gibco) and 1% (v/v) penicillin-streptomycin (Gibco). Cells were passaged at ~80% confluency every 2–3 days to maintain an actively growing population and avoid anoxic conditions. HepG2 cells (ATCC HB-8065) were cultured and passaged in Eagle’s Minimum Essential Medium (EMEM, ATCC) supplemented with 10% (v/v) FBS and 0.5% penicillin-streptomycin. Cells were passaged at ~80% confluency every 3–4 days. Both cell lines were used for experiments until passage 20 for HEK293T and passage 12 for HepG2, and both cell lines were maintained at 37°C with 5% CO2. Cells were authenticated via STR profiling by the supplier (ATCC). Supernatant of cell media was analyzed bi-weekly using MycoAlert PLUS (Lonza) and cells continuously tested negative.
Cell transfections.
HEK293T (6–7×10⁶ cells) or HepG2 (15×106 cells) cells were seeded into 150mm TC-Treated Culture Dishes (Corning) 20–24h prior to transfection to yield ~60–80% confluency on the day of transfection. Cells were then transfected with 37.5μg base editor or negative control (nCas9(D10A)-UGI-NLS(SV40) or bpNLS-32AA linker-nCas9(D10A)-bpNLS) plasmid fused to P2A-EGFP, 12.5μg guide RNA expression plasmid, and 150μL TransIT-293 (for HEK293T, Mirus) or transfeX (for HepG2, ATCC) according to the manufacturer’s protocols. To ensure maximal correlation of negative controls to BE overexpression, for every CBE experiment, cells were transfected and sorted with nCas9-UGI-NLS-P2A-EGFP (BE3 without rAPOBEC1 and XTEN linker as negative control) in parallel. For ABE experiments, cells were transfected and sorted in parallel with bpNLS-32AA linker-nCas9-bpNLS-P2A-EGFP (ABEmax without TadA-dimer; GenScript codon-optimized as previously described25). The GFP controls (Figs. 1d and 3b; encoding P2A-EGFP; plasmid-size adjusted transfection dose of 22μg) were transfected without a matching nCas9-UGI-NLS-P2A-EGFP control. Each CBE and ABE replicate was processed in parallel with a respective nCas9 control experiment for direct comparison during downstream analysis. Only for the experiments shown in the SECURE-BE3 variant screen (Extended Data Fig. 6a) cells were transfected on three consecutive days (3 conditions/day). For experiments shown in Fig. 2a and Extended Data Fig. 7b, SECURE-CBE variants were transfected on the same day with matching nCas9-UGI-NLS-P2A-EGFP and BE3-P2A-EGFP controls. Before sorting, cells were incubated for 36–40h post-transfection. This length of time was chosen because preliminary experiments in which we transiently transfected plasmid encoding rAPOBEC1 into HepG2 cells showed the highest level of RNA editing at the APOB C6666 nucleotide at 24–48 hours with progressively decreasing levels of editing at the 72 and 96 hour timepoints (data not shown). For experiments validating DNA on-target activity of SECURE variants, 1.5×10⁴ HEK293T cells were seeded into 96-well Flat Bottom Cell Culture plates (Corning) and transfected 24h after seeding with 220ng DNA (165ng base editor or negative control plasmid and 55ng gRNA expression plasmid) and 0.66μL TransIT-293. Cells were incubated for 72h post-transfection before gDNA was harvested.
Fluorescence-activated cell sorting (FACS).
HEK293T cells were washed with Phosphate Buffer Saline (PBS, Corning) and HepG2 cells with 0.25% Trypsin-EDTA Solution (ATCC) 36–40h after transfection. 0.05% Trypsin-EDTA (Gibco) was added to detach both cell types. Cells were prepared for sorting by diluting with PBS supplemented with 10% (v/v) FBS and filtering through 35μm cell strainer caps (Corning). Flow cytometry was carried out on a FACSAria II (BD Biosciences) using FACSDiva version 6.1.3 (BD Biosciences). Cells were gated on their population via forward/sideward scatter after doublet exclusion (Supplementary Note). Cells treated with base editor were flow-sorted for all GFP-positive cells and/or top 5% of gated cells (% parent) with the highest GFP (FITC) signal into pre-chilled FBS. Cells treated with nCas9-UGI-NLS-P2A-EGFP (BE3 control), bpNLS-32AA linker-nCas9-bpNLS-P2A-EGFP (ABEmax control), were sorted for all GFP-positive cells and/or 5% of cells with a mean fluorescence intensity (MFI or geometric mean in FACSDiva software) matching the MFI of top 5% GFP signal in BE3- or ABEmax-transfected cells that were assayed on the same day. GFP controls (Figs. 1d and 3b; P2A-EGFP) were MFI-matched to top 5% GFP signal of BE3-P2A-EGFP expressing cells from the same day. The negative control-transfected cells were MFI-matched because the negative control plasmids are smaller than BE3 and ABEmax plasmids, yielding higher transfection efficiency and overall higher GFP/FITC signal. nCas9 controls and BE experiments were sorted on the same day, except for the SECURE-BE3 variant screen (Extended Data Fig. 6a), where cells were sorted for top 5% of GFP signal (% total) and samples were sorted in three consecutive days (3 conditions/day, in the order that is displayed in the figure). For each experiment, at least 5–8×10⁵ cells were sorted for genomic DNA (gDNA) and RNA extraction.
RNA and DNA extraction & reverse transcription.
After sorting (~40–44h post transfection), cells were split into subsets for gDNA (usually at least 1–3×10⁵ cells) or RNA (usually 3–6×10⁵ cells) extraction and centrifuged at 175g for 8 minutes. For DNA extraction, cell pellets were lysed with 175μL freshly prepared DNA lysis buffer (100mM Tris HCl pH 8.0, 200mM NaCl, 5mM EDTA, 0.05% SDS, adapted from Laird et al, 199127), supplemented with 5μL 1M DTT (Sigma) and 20 μL Proteinase K (NEB; 200 μL total volume of lysis buffer mix per condition). After 12–24h of lysis at 55°C and 500RPM, gDNA was extracted using 0.7–2x paramagnetic beads which were prepared similar to as described in Rohland & Reich, 2012 (GE Healthcare Sera-Mag SpeedBeads from Fisher Scientific, washed in 0.1x TE and suspended in 20% PEG-8000 (w/v), 1.5M NaCl, 10mM Tris-HCl pH 8, 1mM EDTA pH 8, and 0.05% Tween20)28. The lysate-beads mélange was mixed rigorously, incubated for 5 minutes, separated on a magnetic plate and washed 3 times with 70% EtOH (washing is performed while the plate is off the magnet). After drying for 5 minutes, the DNA was eluted in 30–100μL elution buffer. For RNA extraction, cell pellets were resuspended in 350μL RNA lysis buffer LBP (Macherey-Nagel) and either processed subsequently or stored at −80°C. RNA was extracted using the NucleoSpin RNA Plus kit (Macherey-Nagel) following the manufacturer’s instructions. For HEK293T DNA on-target experiments without sorting (96-well format), 50μL freshly prepared DNA lysis buffer mix (including DTT and Proteinase K, as described above) was added directly into each well after washing with 100uL PBS. Reverse transcription (RT) was performed using the High Capacity RNA-to-cDNA kit (Thermo Fisher) following the manufacturer’s instructions.
Next-generation sequencing of DNA and RNA amplicons.
Next-generation sequencing (NGS) of gDNA or cDNA was performed as described previously3,22. Genomic or transcriptomic sites of interest were amplified by PCR using gene-specific primers flanking the target sequence and containing appropriate Illumina forward and reverse adapter sequences (PCR1; all primers and NGS amplicons for all genomic sites are listed in Supplementary Table 34). Specifically, for each 50μL PCR reaction, 5–20ng extracted genomic DNA or 2μL of 1:10 diluted cDNA, 2.5μL of each 10μM forward and reverse primers, 5μL of 2mM dNTP, 10μL 5x Phusion HF Buffer, and 0.5μL Phusion High-Fidelity DNA Polymerase (NEB) were added. PCR1 reactions were carried out as follows: 98°C for 2min, then 30 cycles of (98°C for 10s, appropriate annealing temperature for desired primer pairs for 12–15s, 72°C for 12–15s), and a final 72°C extension for 10min. PCR products were verified by running on a High-Resolution or Fast Analysis QIAxcel automated electrophoresis device (Qiagen) and cleaned with paramagnetic beads (0.6–0.7x beads-to-sample ratio). In a secondary “barcoding” PCR (PCR2), the amplicons were indexed with primer pairs containing unique Illumina barcodes (analogous to TruSeq CD indexes, formerly known as TruSeq HT). Specifically, for each 50μL barcoding PCR reaction, 50–200ng DNA input from the purified PCR product (PCR1), 2.5μL of 10μM forward and reverse barcoding primers, 5μL of 2mM dNTP, 10μL 5x Phusion HF Buffer, and 0.5μL Phusion High-Fidelity DNA Polymerase were added. PCR2 reactions were carried out as follows: 98°C for 2min, then 5–10 cycles of (98°C for 10s, 65°C for 30s, 72°C for 30s), and a final 72°C extension for 10min. PCR products were verified on a QIAxcel capillary electrophoresis machine (Qiagen) and cleaned with paramagnetic beads (0.6–0.7x beads-to-sample ratio), eluting the final product in 30μL of 1x TE buffer. DNA concentration was quantified with the QuantiFluor dsDNA System (Promega) and Synergy HT microplate reader (BioTek) at 485/528nm. Libraries were pooled and pools quantified with qPCR using the NEBNext Library Quant Kit for Illumina (NEB). Amplicon libraries were sequenced paired-end (PE) 2×150 on the Illumina MiSeq machine using 300-cycle MiSeq Reagent Kit v2 or Micro Kit v2 (Illumina) according to the manufacturer’s protocol. Sequencing reads were demultiplexed in MiSeq Reporter (Illumina) and analyzed using a batch version of the software CRISPResso 2 (release 20180918). Please see On-target DNA amplicon sequencing analysis below for further details.
RNA-seq experiments.
RNA library preparation was performed with the TruSeq Stranded Total RNA Library Prep Gold kit (Illumina) with initial input of ~500ng of extracted RNA per sample, using SuperScript III (Invitrogen) for first-strand synthesis. Ribosomal RNA (rRNA) depletion was confirmed after the initial rRNA removal step by fluorometric quantitation using the Qubit RNA HS Assay Kit (Invitrogen). IDT for Illumina TruSeq RNA UD Indexes (96 indexes) were used to barcode each library with unique dual indexes to mitigate index hopping. RNA-seq libraries were examined on a High-resolution QIAxcel (Qiagen) and pooled based on qPCR quantification with the KAPA Library Quantification Kit Illumina (KAPA Biosystems) or the NEBNext Library Quant Kit for Illumina (NEB). RNA-seq libraries were sequenced on an Illumina HiSeq 2500 machine in High Output mode, paired-end (PE) 2×76, or on an Illumina NextSeq 500 (PE 2×150), using a 500/550 Mid Output cartridge (data shown in Extended Data Fig. 6a; performed at MGH Molecular Profiling Laboratory). HiSeq runs (all remaining RNA-seq data) were performed by the Broad Institute of Harvard and MIT (Cambridge, MA).
RNA sequence variant calling and quality control.
Illumina paired-end fastq sequencing reads were processed following GATK best practices for RNA-seq variant calling29,30. Briefly, reads were aligned to the human hg38 reference genome with STAR version 2.6.0c31 and RNA base-editing variants were called using HaplotypeCaller (GATK version 3.8), and empirical editing efficiencies were established on PCR-deduplicated (Picard version 2.7.1; http://broadinstitute.github.io/picard/) aligned reads. Known variants in dbSNP version 138 were used during base quality recalibration. From all called variants, downstream analyses focused solely on single-nucleotide variants (SNVs) over canonical (1–22, X, Y and M) chromosomes. To quantify the per-base nucleotide abundances per variant, we ran bam-readcount version 0.8.0 (https://github.com/genome/bam-readcount) on the “analysis-ready” BAM file from the final output of the GATK pipeline. Furthermore, we assessed possible low-quality libraries or contamination by assessing 1) possible genomic DNA (gDNA) contamination; 2) abundance of rRNA; 3) contamination of mycoplasma in the cell line data. For (1), we accessed rates of possible gDNA contamination based on the ratio of reads mapping to the annotated transcriptome (hg38 GTF file) compared to all mapped genomic regions. Next, for (2), the abundance of rRNA was estimated by overlapping regions of rRNA from the UCSC hg38 annotation as a ratio of all reads remaining from the GATK pipeline. Finally, for (3), potential mycoplasma contamination was assessed my mapping reads with bowtie2 version 2.3.132 to four mycoplasma genomes obtained from NCBI -- Mycoplasma hominis ATCC 23114 (NC_013511.1), M. hyorhinis MCLD (NC_017519.1), Mycoplasma fermentans M64 (NC_014921.1) and Acholeplasma laidlawii PG-8A (NC_010163.1) that were previously reported to be common contaminants in cell lines33.
RNA sequence variant filtering.
Variant loci in base-editor (BE) overexpression experiments were filtered to exclude sites without high confidence reference genotype calls in the control experiment. The read coverage for a given SNV in a control experiment should be > 90th percentile of the read coverage across all SNVs in the corresponding overexpression experiment. Additionally, these loci were required to have a consensus of at least 99% of reads containing the reference allele in the control experiment. RNA edits in GFP compared to nCas9 controls were filtered to include only loci with 10 or more reads and with greater than 0% reads containing alternate allele. Base edits labeled as C-to-U comprise C-to-U edits called on the positive strand as well as G-to-A edits sourced from the negative strand. Base edits labeled as A-to-I comprise A-to-I edits called on the positive strand as well as T-to-C edits sourced from the negative strand. Edits considered for Venn diagrams were further filtered to only include those with read depths of more than 100. Results obtained with our pipeline may underestimate the actual number of RNA edits occurring in cells because of the high stringency of our variant calling pipeline and potential underrepresentation of intronic and intergenic RNA in our experiments.
RNA sequence variant effect prediction.
The effect of identified variants was determined using the Variant Effect Predictor (VEP) version 92.5 tool from Ensembl34 with default parameters and option “--pick” to filter for one consequence per variant (http://useast.ensembl.org/info/docs/tools/vep/index.html). VEP was run using the GRCh38.p12 reference human genome, Polyphen version 2.2.2, Sift version 5.2.2, COSMIC version 83, 1000genomes version phase3, ESP version V2-SSA137, gnomAD version 170228, GENCODE version 28, genebuild version 2014–07, HGMD-PUBLIC version 20174, regbuild version 16, ClinVar version 201802, and dbSNP version 150. The intergenic category in barplot figures also includes up- and down-stream gene variants.
Quantification of gene expression.
Gene expression was inferred from STAR “--quantMode GeneCounts” quantifications using UCSC annotations and is reported in transcripts per million (TPM) units. We defined expressed genes as those with 10 TPM or more.
On-target DNA amplicon sequencing analysis.
Analysis of on-target amplicon sequencing was performed with CRISPResso2 version 20180918 in batch mode (http://crispresso2.pinellolab.org/ and https://www.biorxiv.org/content/early/2018/08/15/392217), with options “-p 10 --base_editor_output”. The main figures display percentage of C-to-T or A-to-G edits, zoomed in to the regions of interest, with other potentially occurring editing events not displayed. The grey background represents editing frequencies < 2%. Raw data are provided in the Supplementary Tables.
Generation of sequence motifs.
Sequence motifs were generated with WebLogo version 2.835 To generate extended 100-bp sequence logo (Extended Data Figs. 9c –9f), WebLogo version 3.6.035 was used.
Whole exome sequencing (WES)
Exome sequence enrichment was performed using Agilent SureSelect following the manufacturer’s protocol (Agilent Technologies, Santa Clara, CA). Libraries were prepared using the SureSelect QXT transposase-based method, followed by enrichment with biotinylated RNA oligomers that were contained within the SureSelect v5+UTR capture pool. WES libraries were sequenced on an Illumina NovaSeq S1 flow cell. All library preparations and sequencing runs were performed by the Clinical Genomics Center of the Oklahoma Medical Research Foundation (Oklahoma City, OK).
Whole exome sequencing analysis
Each exome library was processed using GATK Best Practices29,30, including paired-end alignment, PCR duplicate removal, indel realignment, and base quality recalibration. Per base, per nucleotide quantifications for each library was inferred using bam-readcount. A set of RNA edits per experiment was determined by using the union of high-quality edits from the three biological replicate libraries for each condition. Pooled RNA editing and DNA editing rates were determined per single-nucleotide by taking the ratio of the total edited alleles over the total alleles at a given position. For scatterplots, the background rates of C-to-T or A-to-G alterations in the control sample were subtracted from base editor-treated sample to compute the DNA editing rate attributable to the base editor; in these same scatterplots, note that we only call RNA edits in BE-treated samples that do not appear in their corresponding control samples (nCas9-UGI-NLS for CBE or NLS-nCas9-NLS for ABE) as processed by our filtering pipeline (see RNA sequence variant filtering methods above) and thus background rates of RNA editing are already accounted for in the depiction of these data.
Extended Data
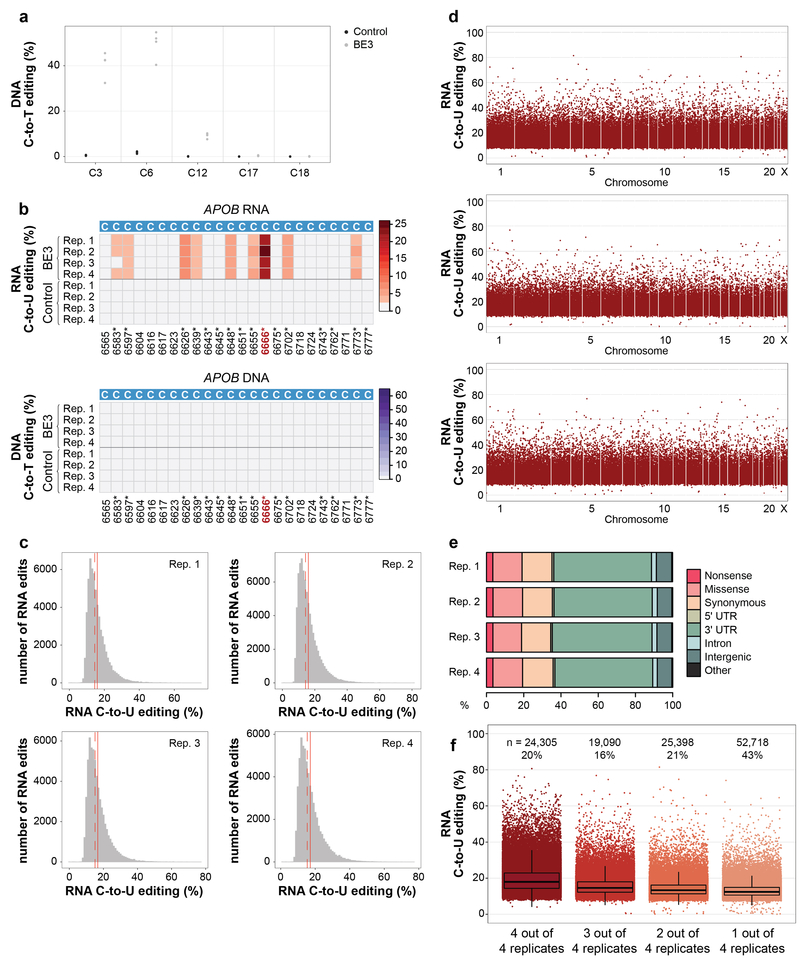
Extended Data Figure 1. Additional data and analysis for transcriptome-wide off-target C-to-U RNA editing induced by BE3 in human HepG2 cells.
(a) Dot plot of RNF2 on-target DNA editing data shown in Fig. 1b, depicting editing frequencies for all cytosines across the spacer sequence. (b) Heat maps showing RNA and DNA editing efficiencies of BE3 and Control on cytosines in human APOB. Numbering indicates nucleotide positions in the APOB transcript with asterisks by those previously shown to be modified by APOBEC1. (c) Histograms showing numbers of RNA edited cytosines (y-axis) with RNA C-to-U editing frequencies (x-axis) for the four replicates shown in Fig. 1c. Dashed red line shows the median, solid red line represents the mean. (d) Manhattan plots of data for replicates 2, 3, and 4 from Fig. 1c showing the distribution of modified cytosines across the transcriptome. n = total number of modified cytosines observed. (e) Percentages of different predicted effects and locations of edited cytosines in each RNA-seq replicate. (f) Jitter plots of cytosines modified by BE3 expression with the RNF2 gRNA categorized by their presence in 4, 3, 2 or 1 of the replicate RNA-seq experiments performed in HepG2 cells (n=4 biologically independent samples, same as in Fig. 1c). The box spans the interquartile range (first to third quartiles), with the band inside the box depicting the median (second quartile). The whiskers extend to the ±1.5 * interquartile range. n = total number of modified cytosines present in each category. The percentage of all modified cytosines in each category is also shown. UTR = untranslated region.
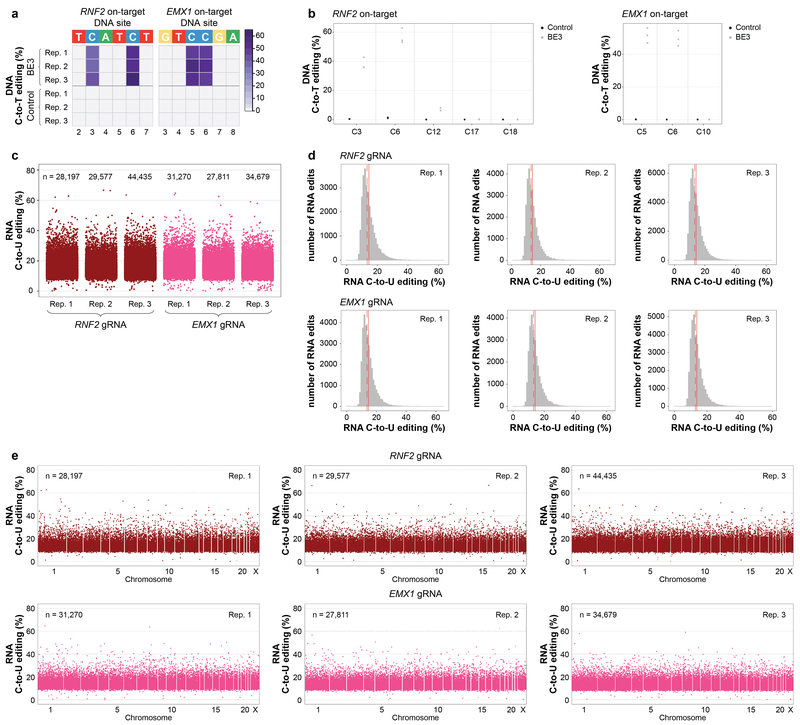
Extended Data Figure 2. BE3 expression with two different gRNAs induces transcriptome-wide off-target RNA editing in HEK293T cells.
(a) Heat maps of on-target DNA base editing efficiencies of BE3 and nCas9-UGI-NLS (Control) in HEK293T cells (all GFP sorting) determined in triplicate with the RNF2 or EMX1 gRNA. Bases shown are within the editing window of the on-target spacer sequence (numbering is at the bottom with 1 being the most PAM distal spacer position). (b) Dot plots of RNF2 and EMX1 on-target DNA editing data shown in (a), depicting editing frequencies for all cytosines across the spacer sequence. (c) Jitter plots derived from RNA-seq experiments showing RNA cytosines modified by BE3 expression with the RNF2 or EMX1 gRNA. Y-axis represents the efficiencies of C-to-U editing. n = total number of modified cytosines observed in each replicate. (d) Histograms showing numbers of RNA edited cytosines (y-axis) with RNA C-to-U editing frequencies (x-axis) for the experiments shown in (c). Dashed red line shows the median, solid red line represents the mean. (e) Manhattan plots of data shown in (c) depicting the distribution of modified cytosines across the transcriptome. n = total number of modified cytosines observed.
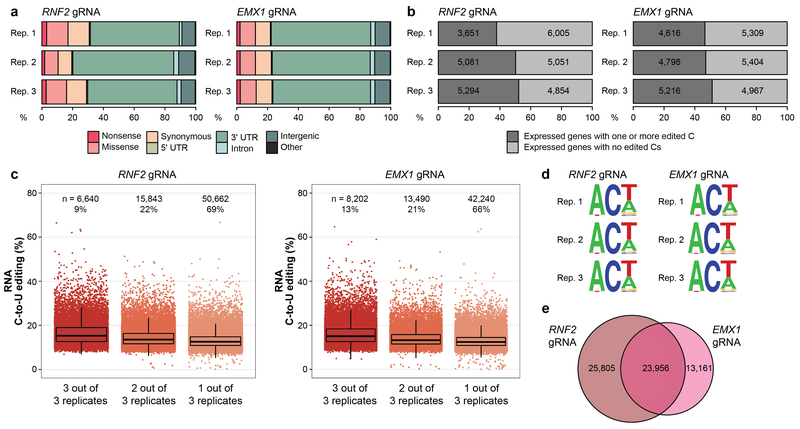
Extended Data Figure 3. Additional analysis of data showing transcriptome-wide off-target RNA editing in HEK293T cells by BE3 with two different gRNAs.
(a) Percentages of different predicted effects and locations of edited cytosines in each RNA-seq replicate from Extended Data Fig. 2c. (b) Percentages (x-axis) and numbers (shown inside the bars) of expressed genes in each RNA-seq replicate from same dataset as described in (a) that show at least one edited cytosine. (c) Jitter plots of cytosines modified by BE3 expression with the RNF2 or the EMX1 gRNA categorized by their presence in 3, 2 or 1 of the replicate RNA-seq experiments performed in HEK293T cells (n=3 biologically independent samples, same as Extended Data Fig. 2c). Box, whiskers and n are as defined in Extended Data Fig. 1f. The percentage of all modified cytosines in each category is also shown. (d) Sequence logos derived from edited cytosines identified in each RNA-seq replicate. Analysis done using RNA-seq data generated from cDNA, thus every T depicted should be considered a U in actual RNA. (e) Venn diagram showing numbers of cytosines edited with the RNF2 and EMX1 gRNAs. For each gRNA, the number of cytosines represents the union of those identified in the three replicates.
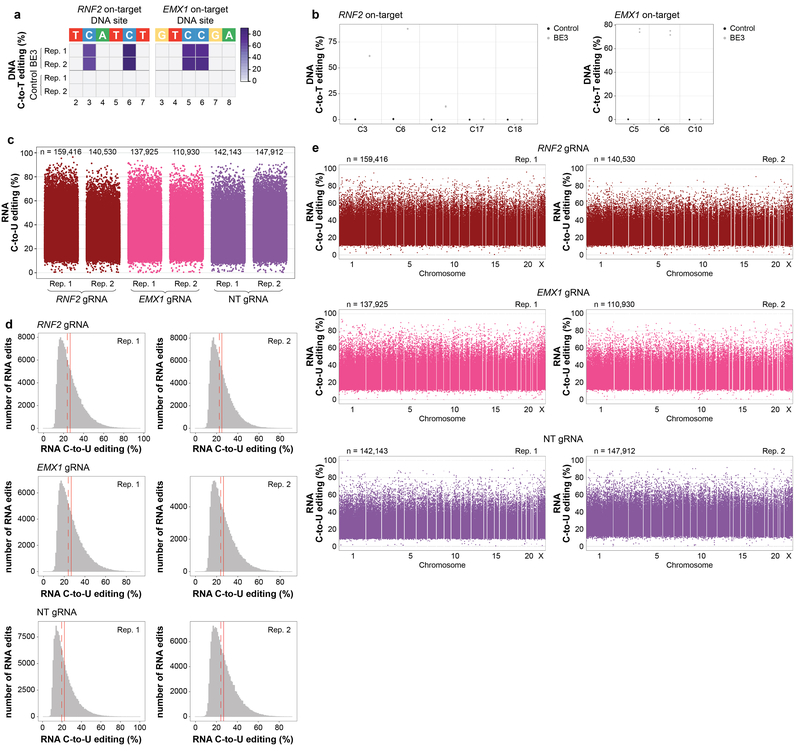
Extended Data Figure 4. Increased BE3 expression induces higher numbers and frequencies of transcriptome-wide RNA cytosine edits in HEK293T cells.
(a) Heat maps of on-target DNA base editing efficiencies of BE3 and nCas9-UGI-NLS (Control) in HEK293T cells (top 5% GFP sorting) determined in duplicate with the RNF2 or EMX1 gRNA. Bases shown are within the editing window of the on-target spacer sequence (numbering is at the bottom with 1 being the most PAM distal spacer position). (b) Dot plots of RNF2 and EMX1 on-target DNA editing data shown in (a), depicting editing frequencies for all cytosines across the spacer sequence. (c) Jitter plots derived from RNA-seq experiments showing RNA cytosines modified by BE3 expression with the RNF2, EMX1, or NT gRNA. Y-axis represents the efficiencies of C-to-U editing. n = total number of modified cytosines observed in each replicate. (d) Histograms showing numbers of RNA edited cytosines (y-axis) with RNA C-to-U editing frequencies (x-axis) for the experiments shown in (c). Dashed red line shows the median, solid red line represents the mean. (e) Manhattan plots of data for both replicates of the RNF2, EMX1, and NT gRNAs from (c) showing the distribution of modified cytosines across the transcriptome. n = total number of modified cytosines.
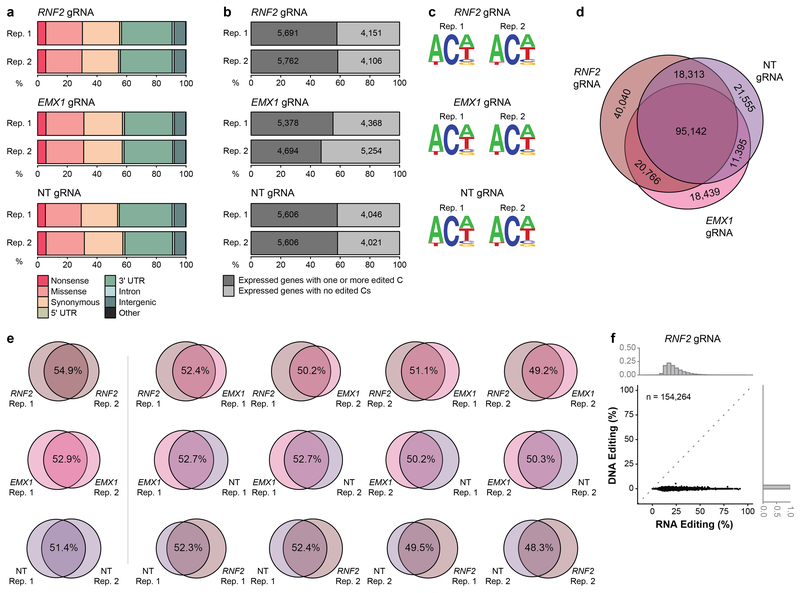
Extended Data Figure 5. Additional data and analysis showing increased BE3 expression induces higher numbers and frequencies of transcriptome-wide RNA cytosine edits in HEK293T cells.
(a) Percentages of different predicted effects and locations of edited cytosines in each RNA-seq replicate from Extended Data Fig. 4c. (b) Percentages (x-axis) and numbers (shown inside the bars) of expressed genes in each RNA-seq replicate that have at least one edited cytosine. (c) Sequence logos derived from edited cytosines identified in each RNA-seq duplicate experiment from Extended Data Fig. 4c for the RNF2, EMX1, and NT gRNAs. Analysis done using RNA-seq data generated from cDNA, thus every T depicted should be considered a U in actual RNA. (d) Venn diagram showing numbers of cytosines edited with the RNF2, EMX1, and NT gRNAs. For each gRNA, the circle encompasses the union of cytosines identified in the two replicates. (e) Venn diagrams showing all possible pairwise comparisons of edited cytosines observed in duplicate experiments performed with the RNF2, EMX1, and NT gRNAs (data derived from the experiments of Extended Data Fig. 4c). (f) Scatter plot correlating RNA editing frequencies (x-axis) of 154,264 cytosines previously shown to be edited by RNA-seq with DNA editing frequencies (y-axis) determined by WES performed with DNA derived from the same experiments (n=3 biologically independent samples, pooled data). Superimposed histograms depict the percentages of cytosines that show various editing rates on RNA (upper x-axis) or DNA (right y-axis).
Extended Data Figure 6. Additional data showing SECURE-BE3 variants induce substantially reduced numbers of RNA edits but possess comparable and more precise DNA editing activities in HEK293T.
(a) Initial screen of the transcriptome-wide RNA editing activities of six BE3 variants harboring various APOBEC1 mutations and expressed at high levels in HEK293T cells (sorting cells with top 5% of GFP signal). Jitter plots of single replicate RNA-seq experiments showing RNA cytosines modified by expression of wild-type (WT) BE3, BE3-E63Q (APOBEC1 catalytic site mutant), BE3-P29F, BE3-P29T, BE3-L182A, BE3-R33A, BE3-K34A, and BE3-R33A/K34A variants. Y-axis represents the efficiencies of C-to-U editing. n = total number of modified cytosines observed in each sample. (b) Heat map of on-target DNA base editing efficiencies of WT BE3, BE3-R33A, BE3-R33A/K34A, and nCas9-UGI-NLS (Control) in HEK293T cells with the RNF2 gRNA (cells from same experiment as presented in Fig. 2a). Bases within the editing window of the on-target spacer sequence are numbered as previously described. Note the inclusion of C12, which is inefficiently edited by WT BE3 in these samples but not edited by the SECURE-BE3 variants, even in the higher expression context. (c) Dot plot for HEK293T on-target data displayed in (b), expanded to include all cytosines across the spacer sequence.
Extended Data Figure 7. Additional data and analysis of the on-target DNA and off-target RNA activities of BE3 and SECURE-BE3 variants.
(a) Dot plots illustrating on-target DNA editing efficiencies of nCas9-UGI-NLS (Control), WT BE3, BE3-R33A, and BE3-R33A/K34A in HEK293T cells on 12 genomic sites. These are the same datasets shown in Fig. 2c, with an expanded depiction that includes all cytosines across the spacer sequence. (b) Jitter plots from RNA-seq experiments in HepG2 cells showing RNA cytosines modified by WT BE3, BE3-R33A and BE3-R33A/K34A. Y-axis represents the efficiencies of C-to-U RNA editing. WT BE3 data are from the same experiments presented in Fig. 1c (Reps. 2–4). n = total number of modified cytosines observed. (c) Manhattan plots of data showing the distribution of modified cytosines induced by BE3-R33A and BE3-R33A/K34A for replicate 3 from (b) overlaid on modified cytosines induced by WT BE3 (note that the WT BE3 data is the same in the top and bottom plots). n = total number of modified cytosines. (d) Heat map of on-target DNA base editing efficiencies of WT BE3, BE3-R33A, BE3-R33A/K34A, and nCas9-UGI-NLS (Control) in HepG2 cells with the RNF2 gRNA (cells from same experiment as presented in Extended Data Fig. 7b). Note that replicates 1, 2, and 3 for WT BE3 and nCas9-UGI-NLS in this panel show the same data presented as replicates 2, 3, and 4 for WT BE3 and nCas9-UGI-NLS in Fig. 1b. Bases within the editing window of the on-target spacer sequence are numbered as previously described. Note again the inclusion of position C12. (e) Dot plot for HepG2 on-target data displayed in (d), expanded to include all cytosines across the spacer sequence. (f) Schematic representation of the editing windows (colored boxes) for WT BE3, BE3-R33A, and BE3-R33A/K34A based on experimental data from Fig. 2c and Extended Data Fig. 7a. Darker colored and more translucent boxes indicate positions generally showing higher and lower C-to-T editing efficiencies, respectively. Increased stringency for a 5’T with BE3-R33A/K34A is also indicated. PAM (NGG) and the nicking site in the DNA backbone are highlighted. Drawings are adapted from Table 1 of ref. 1.
Extended Data Figure 8. Additional data and analysis for transcriptome-wide off-target A-to-I RNA editing induced by ABEmax expression in HEK293T cells.
(a) Dot plot of HEK site 2 on-target DNA editing data shown in Fig. 3a, depicting editing frequencies for all adenines across the spacer sequence. (b) Histograms showing numbers of RNA-edited adenines (y-axis) with RNA A-to-I editing frequencies (x-axis) for three replicates shown in Fig. 3b. Dashed red line shows the median, solid red line represents the mean. (c) Manhattan plots of data for replicates 1 and 2 from Fig. 3b showing the distribution of modified adenines across the transcriptome. (d) Percentages of different predicted effects and locations of edited adenines in each RNA-seq replicate shown in Fig. 3b. (e) Percentages (x-axis) and numbers (inside the bars) of expressed genes in each RNA-seq replicate that show at least one edited adenine. (f) Jitter plots of adenines modified by ABEmax expression with the HEK site 2 gRNA categorized by their presence in 3, 2 or 1 of the replicate RNA-seq experiments shown in Fig. 3b (n=3 biologically independent samples). Box and whiskers are as defined in Extended Data Fig. 1f. n = total number of modified adenines present in each category. The percentage of all modified adenines found in each category is also shown. (g) Scatterplot correlating RNA editing frequencies (x-axis) of 52,462 adenines previously shown to be RNA edited with DNA editing frequencies (y-axis) determined by WES (n=3 biologically independent samples, pooled data). Superimposed histograms depict the percentages of edited adenines on RNA (upper x-axis) or DNA (right y-axis).
Extended Data Figure 9. Impacts of BE3 and SECURE-BE3 variants on cell viability, structural model of rAPOBEC1, and extended sequence logos of off-target RNA edited sites.
(a) Cell viability assay comparing HEK293T cells transfected with plasmid expressing nCas9-UGI-NLS, wild-type (WT) BE3, BE3-R33A, BE3-R33A/K34A, or BE3-E63Q (n=3 biologically independent samples/condition). Each dot represents one biological replicate (and is the mean of three technical replicates). All data points were normalized to the mean luminescence of a nCas9-UGI-NLS control (set to 100%, grey dotted line) that was performed for each biological replicate experiment. The assay was performed on days 1, 2, 3, and 4 post-plating. Mean (longer horizontal line) and standard errors of the mean (shorter horizontal lines) are shown for each set of biological replicates. RLU = relative light unit; n.s.= not significantly decreased compared to matched nCas9 control; * and *** = p < 0.05 and p<0.001 values, respectively, for a significant decrease compared to matched nCas9-UGI control. Statistical significance was determined as described in Supplementary Methods. (b) rAPOBEC1 structural model with locations of catalytic residues and the R33 and K34 positions altered in SECURE variants. A predicted rAPOBEC1 structure is shown that was generated with Protein Homology/analogY Recognition Engine v 2.0 (Phyre2)36 and visualized in PyMOL (v 1.8.2.1). The R33 and K34 residues mutated in the SECURE variants are highlighted in orange and blue respectively. Catalytic site residues (H61, E63, C93 and C96) have been previously described18 and are highlighted in green. (c-f) Extended sequence logos for BE3- and ABEmax-induced RNA editing sites. Sequence logos derived with the nucleotides 100 bp upstream and downstream of the motifs edited in RNA by BE3 (ACW) or ABEmax (UA) are shown. Logos were derived from data for (c) BE3 expression in HepG2 cells (Fig. 1c), (d) BE3 expression in HEK293T cells (all GFP-sorted cells; Extended Data Fig. 2c), (e) higher BE3 expression in HEK293T cells (top 5% GFP-sorted cells; Extended Data Fig. 4c), and (f) ABEmax expression in HEK293T experiments (top 5% GFP-sorted cells; Fig. 3b). Analysis was done using RNA-seq data generated from cDNA, thus every T depicted should be considered a U in actual RNA.
Extended Data Table 1.
Summary of RNA edits observed for all RNA-seq experiments.
| Figures | Cell | BE | gRNA | Sort | Replicate | C-to-U (for CBE) orA-to-l(forABE) | Other | C-to-U orA-to-l (%) |
|---|---|---|---|---|---|---|---|---|
| Fig. 1c | HepG2 | GFP | -- | MFI-matched to top 5% BE3 expression | Rep. 1 | 8 | 46 | 14.815 |
| Fig. 1c | HepG2 | BE3 | RNF2 | Top 5% | Rep. 1 | 58,372 | 8 | 99.986 |
| Fig. 1c & Ext. Data Fig. 7b | Rep. 2 | 77,671 | 7 | 99.991 | ||||
| Rep. 3 | 60,225 | 7 | 99.988 | |||||
| Rep. 4 | 61,736 | 3 | 99.995 | |||||
| Fig. 2a | HEK293T | BE3 | RNF2 | Top 5% | Rep. 1 | 91,951 | 9 | 99.990 |
| Rep. 2 | 192,088 | 6 | 99.997 | |||||
| Rep. 3 | 90,509 | 3 | 99.997 | |||||
| HEK293T | BE3-R33A | RNF2 | Top 5% | Rep. 1 | 236 | 94 | 71.515 | |
| Rep. 2 | 377 | 126 | 74.950 | |||||
| Rep. 3 | 197 | 63 | 75.769 | |||||
| HEK293T | BE3-R33A/K34A | RNF2 | Top 5% | Rep. 1 | 24 | 89 | 21.239 | |
| Rep. 2 | 26 | 128 | 16.883 | |||||
| Rep. 3 | 7 | 47 | 12.963 | |||||
| HEK293T | BE3-E63Q | RNF2 | Top 5% | Rep. 1 | 15 | 51 | 22.727 | |
| Rep. 2 | 9 | 47 | 16.071 | |||||
| Fig. 3b | HEK293T | GFP | -- | MFI-matched to top 5% BE3 expression | Rep. 1 | 195 | 138 | 58.559 |
| Fig. 3b | HEK293T | ABEmax | HEK site 2 | Top 5% | Rep. 1 | 37,061 | 88 | 99.763 |
| Rep. 2 | 31,821 | 67 | 99.790 | |||||
| Rep. 3 | 28,752 | 49 | 99.830 | |||||
| Ext. Data Fig. 2c | HEK293T | BE3 | RNF2 | All GFP | Rep. 1 | 28,197 | 12 | 99.957 |
| Rep. 2 | 29,577 | 28 | 99.905 | |||||
| Rep. 3 | 44,435 | 19 | 99.957 | |||||
| HEK293T | BE3 | EMX1 | All GFP | Rep. 1 | 31,270 | 11 | 99.965 | |
| Rep. 2 | 27,811 | 41 | 99.853 | |||||
| Rep. 3 | 34,679 | 14 | 99.960 | |||||
| Ext. Data Fig. 4c | HEK293T | BE3 | RNF2 | Top 5% | Rep. 1 | 159,416 | 8 | 99.995 |
| Rep. 2 | 140,530 | 11 | 99.992 | |||||
| HEK293T | BE3 | EMX1 | Top 5% | Rep. 1 | 137,925 | 4 | 99.997 | |
| Rep. 2 | 110,930 | 5 | 99.995 | |||||
| HEK293T | BE3 | NT | Top 5% | Rep. 1 | 142,143 | 25 | 99.982 | |
| Rep. 2 | 147,912 | 8 | 99.995 | |||||
| Ext. Data Fig. 6a | HEK293T | BE3 | RNF2 | Top 5% | Screen | 69,623 | 31 | 99.955 |
| BE3-E63Q | 76 | 270 | 21.965 | |||||
| BE3-P29F | 63 | 228 | 21.649 | |||||
| BE3-P29T | 300 | 231 | 56.497 | |||||
| BE3-L182A | 2,128 | 332 | 86.504 | |||||
| BE3-R33A | 435 | 283 | 60.585 | |||||
| BE3-K34A | 5,665 | 196 | 96.656 | |||||
| BE3-R33A/K34A | 63 | 173 | 26.695 | |||||
| Ext. Data Fig. 7b (also includes WT BE3 from Fig. 1c) | HepG2 | BE3-R33A | RNF2 | Top 5% | Rep. 1 | 41 | 54 | 43.158 |
| Rep. 2 | 44 | 30 | 59.459 | |||||
| Rep. 3 | 76 | 32 | 70.370 | |||||
| HepG2 | BE3-R33A/K34A | RNF2 | Top 5% | Rep. 1 | 6 | 35 | 14.634 | |
| Rep. 2 | 5 | 32 | 13.514 | |||||
| Rep. 3 | 7 | 27 | 20.588 |
Supplementary Material
Acknowledgements:
J.K.J., J.G., and R.Z. are supported by the Defense Advanced Research Projects Agency (HR0011-17-2-0042). Support was also provided by the National Institutes of Health (RM1 HG009490 to J.K.J. and J.G. and R35 GM118158 to J.K.J. and M.J.A.). J.K.J. is additionally supported by the Desmond and Ann Heathwood MGH Research Scholar Award. We thank M.M. Kaminski, B.P. Kleinstiver, and K. Petri for discussions, V. Pattanayak for input on the manuscript, and Y.E. Tak, G. Boulay, M.K. Clement, A.A. Sousa, R.T. Walton, M.L. Bobbin, M.V. Maus, and A. Schmidts for technical advice, and P. K. Cabeceiras and O.R. Cervantes for technical assistance. J.K.J. dedicates this paper to the memory of Professor Chong Jin Park.
Footnotes
Supplementary Information is linked to the online version of the paper at www.nature.com/nature.
Competing Interests Statement: J.K.J. has financial interests in Beam Therapeutics, Editas Medicine, Endcadia, Pairwise Plants, Poseida Therapeutics, and Transposagen Biopharmaceuticals. J.K.J.’s interests were reviewed and are managed by Massachusetts General Hospital and Partners HealthCare in accordance with their conflict of interest policies. J.K.J. is a member of the Board of Directors of the American Society of Gene and Cell Therapy. J.G., R.Z., and J.K.J. are co-inventors on patent applications that have been filed by Partners Healthcare/Massachusetts General Hospital on engineered base editor architectures that reduce RNA editing activities.
Code availability statement:
The authors will make all previously unreported custom computer code used in this work available upon reasonable request.
Data Reporting:
Sample sizes were not predetermined with statistical methods. Investigators were not blinded to experimental conditions or outcome assessments.
Data Availability:
Plasmids encoding the most relevant constructs shown in this work, including both SECURE-BE3 variants, have been deposited to Addgene (Addgene IDs 123611–123616).
All RNA-sequencing data used in this study have been deposited in the Gene Expression Omnibus (GEO) repository (National Center for Biotechnology Information). The files are accessible through the GEO Series accession number GSE121668. All WES and targeted amplicon sequencing data have been deposited at the SRA repository at https://www.ncbi.nlm.nih.gov/bioproject/PRJNA497753. All other relevant data are available from the corresponding author on request.
References:
- 1.Rees HA & Liu DR Base editing: precision chemistry on the genome and transcriptome of living cells. Nat Rev Genet 19, 770–788, doi: 10.1038/s41576-018-0059-1 (2018). [DOI] [PMC free article] [PubMed] [Google Scholar]
- 2.Seo H & Kim JS Towards therapeutic base editing. Nat Med 24, 1493–1495, doi: 10.1038/s41591-018-0215-3 (2018). [DOI] [PubMed] [Google Scholar]
- 3.Komor AC, Kim YB, Packer MS, Zuris JA & Liu DR Programmable editing of a target base in genomic DNA without double-stranded DNA cleavage. Nature 533, 420–424, doi: 10.1038/nature17946 (2016). [DOI] [PMC free article] [PubMed] [Google Scholar]
- 4.Komor AC et al. Improved base excision repair inhibition and bacteriophage Mu Gam protein yields C:G-to-T:A base editors with higher efficiency and product purity. Sci Adv 3, eaao4774, doi: 10.1126/sciadv.aao4774 (2017). [DOI] [PMC free article] [PubMed] [Google Scholar]
- 5.Kim D et al. Genome-wide target specificities of CRISPR RNA-guided programmable deaminases. Nat Biotechnol 35, 475–480, doi: 10.1038/nbt.3852 (2017). [DOI] [PubMed] [Google Scholar]
- 6.Zuo E et al. Cytosine base editor generates substantial off-target single-nucleotide variants in mouse embryos. Science, doi: 10.1126/science.aav9973 (2019). [DOI] [PMC free article] [PubMed] [Google Scholar]
- 7.Salter JD, Bennett RP & Smith HC The APOBEC Protein Family: United by Structure, Divergent in Function. Trends Biochem Sci 41, 578–594, doi: 10.1016/j.tibs.2016.05.001 (2016). [DOI] [PMC free article] [PubMed] [Google Scholar]
- 8.Harris RS, Petersen-Mahrt SK & Neuberger MS RNA editing enzyme APOBEC1 and some of its homologs can act as DNA mutators. Mol Cell 10, 1247–1253 (2002). [DOI] [PubMed] [Google Scholar]
- 9.Lau PP, Chen SH, Wang JC & Chan L A 40 kilodalton rat liver nuclear protein binds specifically to apolipoprotein B mRNA around the RNA editing site. Nucleic Acids Res 18, 5817–5821 (1990). [DOI] [PMC free article] [PubMed] [Google Scholar]
- 10.Bostrom K et al. Apolipoprotein B mRNA editing. Direct determination of the edited base and occurrence in non-apolipoprotein B-producing cell lines. J Biol Chem 265, 22446–22452 (1990). [PubMed] [Google Scholar]
- 11.Skuse GR, Cappione AJ, Sowden M, Metheny LJ & Smith HC The neurofibromatosis type I messenger RNA undergoes base-modification RNA editing. Nucleic Acids Res 24, 478–485 (1996). [DOI] [PMC free article] [PubMed] [Google Scholar]
- 12.Rosenberg BR, Hamilton CE, Mwangi MM, Dewell S & Papavasiliou FN Transcriptome-wide sequencing reveals numerous APOBEC1 mRNA-editing targets in transcript 3’ UTRs. Nat Struct Mol Biol 18, 230–236, doi: 10.1038/nsmb.1975 (2011). [DOI] [PMC free article] [PubMed] [Google Scholar]
- 13.Sowden M, Hamm JK & Smith HC Overexpression of APOBEC-1 results in mooring sequence-dependent promiscuous RNA editing. J Biol Chem 271, 3011–3017 (1996). [DOI] [PubMed] [Google Scholar]
- 14.Yamanaka S, Poksay KS, Driscoll DM & Innerarity TL Hyperediting of multiple cytidines of apolipoprotein B mRNA by APOBEC-1 requires auxiliary protein(s) but not a mooring sequence motif. J Biol Chem 271, 11506–11510 (1996). [DOI] [PubMed] [Google Scholar]
- 15.Powell LM et al. A novel form of tissue-specific RNA processing produces apolipoprotein-B48 in intestine. Cell 50, 831–840 (1987). [DOI] [PubMed] [Google Scholar]
- 16.Chen SH et al. Apolipoprotein B-48 is the product of a messenger RNA with an organ-specific in-frame stop codon. Science 238, 363–366 (1987). [DOI] [PubMed] [Google Scholar]
- 17.Yamanaka S, Poksay KS, Balestra ME, Zeng GQ & Innerarity TL Cloning and mutagenesis of the rabbit ApoB mRNA editing protein. A zinc motif is essential for catalytic activity, and noncatalytic auxiliary factor(s) of the editing complex are widely distributed. J Biol Chem 269, 21725–21734 (1994). [PubMed] [Google Scholar]
- 18.Navaratnam N et al. Evolutionary origins of apoB mRNA editing: catalysis by a cytidine deaminase that has acquired a novel RNA-binding motif at its active site. Cell 81, 187–195 (1995). [DOI] [PubMed] [Google Scholar]
- 19.Teng BB et al. Mutational analysis of apolipoprotein B mRNA editing enzyme (APOBEC1). structure-function relationships of RNA editing and dimerization. J Lipid Res 40, 623–635 (1999). [PubMed] [Google Scholar]
- 20.Chen Z et al. Hypermutation induced by APOBEC-1 overexpression can be eliminated. RNA 16, 1040–1052, doi: 10.1261/rna.1863010 (2010). [DOI] [PMC free article] [PubMed] [Google Scholar]
- 21.MacGinnitie AJ, Anant S & Davidson NO Mutagenesis of apobec-1, the catalytic subunit of the mammalian apolipoprotein B mRNA editing enzyme, reveals distinct domains that mediate cytosine nucleoside deaminase, RNA binding, and RNA editing activity. J Biol Chem 270, 14768–14775 (1995). [PubMed] [Google Scholar]
- 22.Gaudelli NM et al. Programmable base editing of A*T to G*C in genomic DNA without DNA cleavage. Nature 551, 464–471, doi: 10.1038/nature24644 (2017). [DOI] [PMC free article] [PubMed] [Google Scholar]
- 23.Wolf J, Gerber AP & Keller W tadA, an essential tRNA-specific adenosine deaminase from Escherichia coli. EMBO J 21, 3841–3851, doi: 10.1093/emboj/cdf362 (2002). [DOI] [PMC free article] [PubMed] [Google Scholar]
- 24.Kim J et al. Structural and kinetic characterization of Escherichia coli TadA, the wobble-specific tRNA deaminase. Biochemistry 45, 6407–6416, doi: 10.1021/bi0522394 (2006). [DOI] [PubMed] [Google Scholar]
- 25.Koblan LW et al. Improving cytidine and adenine base editors by expression optimization and ancestral reconstruction. Nat Biotechnol 36, 843–846, doi: 10.1038/nbt.4172 (2018). [DOI] [PMC free article] [PubMed] [Google Scholar]
- 26.Gibson DG et al. Enzymatic assembly of DNA molecules up to several hundred kilobases. Nat Methods 6, 343–345, doi: 10.1038/nmeth.1318 (2009). [DOI] [PubMed] [Google Scholar]
- 27.Laird PW et al. Simplified mammalian DNA isolation procedure. Nucleic Acids Res 19, 4293 (1991). [DOI] [PMC free article] [PubMed] [Google Scholar]
- 28.Rohland N & Reich D Cost-effective, high-throughput DNA sequencing libraries for multiplexed target capture. Genome Res 22, 939–946, doi: 10.1101/gr.128124.111 (2012). [DOI] [PMC free article] [PubMed] [Google Scholar]
- 29.McKenna A et al. The Genome Analysis Toolkit: a MapReduce framework for analyzing next-generation DNA sequencing data. Genome Res 20, 1297–1303, doi: 10.1101/gr.107524.110 (2010). [DOI] [PMC free article] [PubMed] [Google Scholar]
- 30.DePristo MA et al. A framework for variation discovery and genotyping using next-generation DNA sequencing data. Nat Genet 43, 491–498, doi: 10.1038/ng.806 (2011). [DOI] [PMC free article] [PubMed] [Google Scholar]
- 31.Dobin A et al. STAR: ultrafast universal RNA-seq aligner. Bioinformatics 29, 15–21, doi: 10.1093/bioinformatics/bts635 (2013). [DOI] [PMC free article] [PubMed] [Google Scholar]
- 32.Langmead B & Salzberg SL Fast gapped-read alignment with Bowtie 2. Nat Methods 9, 357–359, doi: 10.1038/nmeth.1923 (2012). [DOI] [PMC free article] [PubMed] [Google Scholar]
- 33.Olarerin-George AO & Hogenesch JB Assessing the prevalence of mycoplasma contamination in cell culture via a survey of NCBI’s RNA-seq archive. Nucleic Acids Res 43, 2535–2542, doi: 10.1093/nar/gkv136 (2015). [DOI] [PMC free article] [PubMed] [Google Scholar]
- 34.McLaren W et al. The Ensembl Variant Effect Predictor. Genome Biol 17, 122, doi: 10.1186/s13059-016-0974-4 (2016). [DOI] [PMC free article] [PubMed] [Google Scholar]
- 35.Crooks GE, Hon G, Chandonia JM & Brenner SE WebLogo: a sequence logo generator. Genome Res 14, 1188–1190, doi: 10.1101/gr.849004 (2004). [DOI] [PMC free article] [PubMed] [Google Scholar]
- 36.Kelley LA, Mezulis S, Yates CM, Wass MN & Sternberg MJ The Phyre2 web portal for protein modeling, prediction and analysis. Nat Protoc 10, 845–858, doi: 10.1038/nprot.2015.053 (2015). [DOI] [PMC free article] [PubMed] [Google Scholar]
Associated Data
This section collects any data citations, data availability statements, or supplementary materials included in this article.


