Mol. Biol. Evol. 36(3):604-612. 2019 doi:10.1093/molbev/msz002
There was a typo of the no value for the datasets from Escherichia coli's respective adaptations to the glycerol medium and lactate medium. The correct value is 4 instead of 3. Additionally, in the adaptation to the lactate medium, na is 4 for the third parallel experiment but 3 in the other parallel experiments. Correct n values were used in the relevant analyses, but were misreported. Furthermore, we discovered coding errors that affected Figure. 3, Figure. 4, and Figure. S3. The corrected figures and associated descriptions are shown below. Figure S3 has been corrected online. Our conclusions are, however, unaltered. We apologize for any inconvenience these errors may have caused.
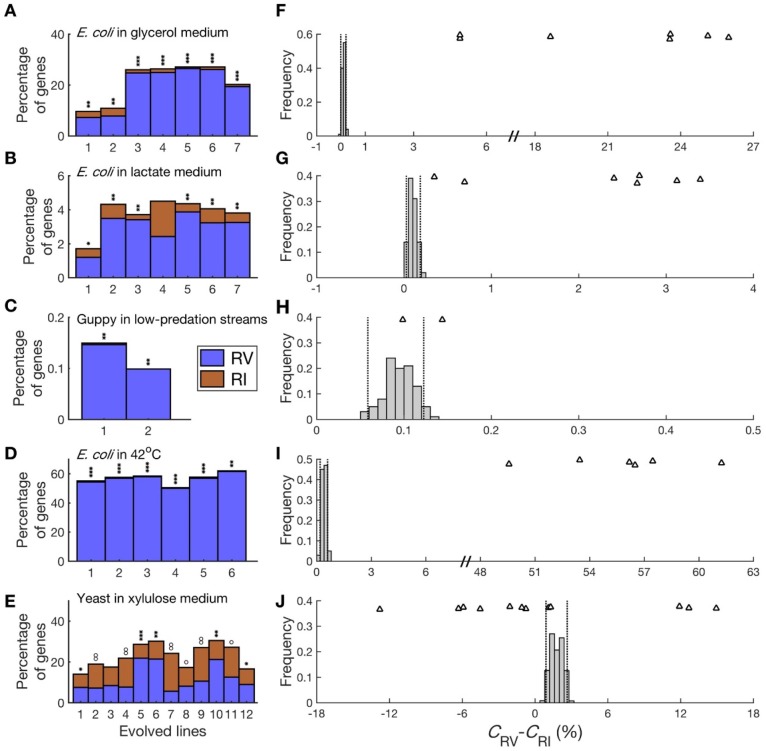
Figure 3.
The figure legend is the same as originally published, with the following addition. In panels (A)-(E), when δ = CRV − CRI > 0: *, P < 0.05; **, P < 10−10; ***, P < 10−100; when δ < 0: o, P < 0.05; oo, P < 10−10; ooo, P < 10−100. The only substantial changes are in panels (E) and (J). In the 12 lines of budding yeast adapting to the xylulose medium, five show a significantly positive δ and six show a significantly negative δ (Fig. 3E). Three values of δ are in the right 2.5% tail of the distribution of δ in 100 simulations, whereas seven values of δ are in the left 2.5% tail (Fig. 3J). Overall, data from four of the five experimental evolution studies support the excess of expression reversion over reinforcement.
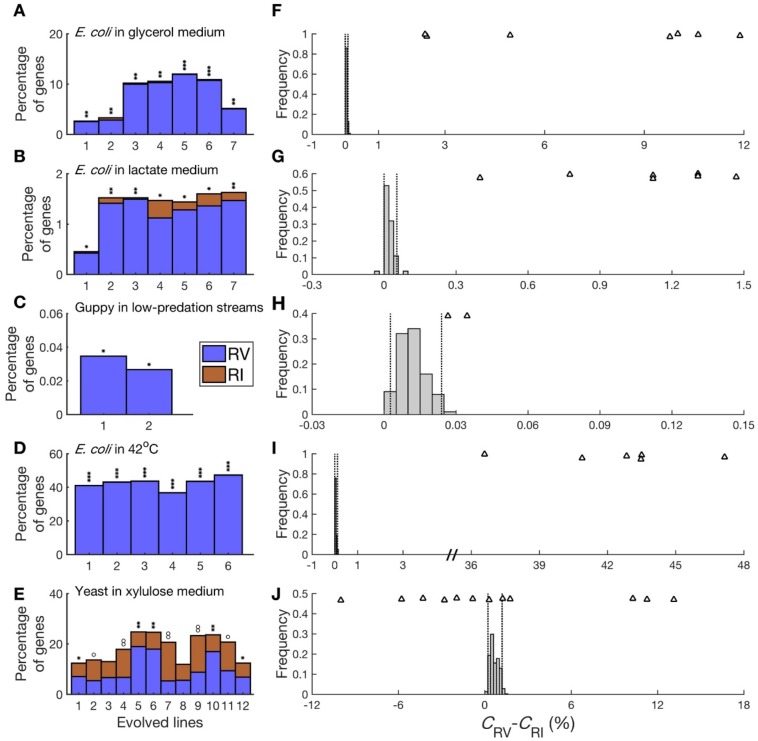
Figure 4.
The figure legend is the same as originally published, with the following addition. In panels (A)-(E), when δ = CRV − CRI > 0: *, P < 0.05; **, P < 10−10; ***, P < 10−100; when δ < 0: o, P < 0.05; oo, P < 10−10; ooo, P < 10−100. The only substantial changes are in panels (E) and (J). In the 12 lines of budding yeast adapting to the xylulose medium, five show a significantly positive δ and five show a significantly negative δ (Fig. 4E). Five values of δ are in the right 2.5% tail of the distribution of δ in 100 simulations, whereas six values of δ are in the left 2.5% tail (Fig. 4J). Overall, data from four of the five experimental evolution studies support the excess of expression reversion over reinforcement.


