

Abstract
A major question in immunology is what role antigen load plays in determining the size of the CD8 immune response. Is the amount of antigen important during recruitment, proliferation, and/or memory formation? Animal studies have shown that antigen is only strictly required early during activation of T cells, but the importance of antigen at later timepoints is unclear. Using data from 24 volunteers infected with the Yellow Fever Vaccine virus (YFV), we analyzed the dependence of T cell proliferation upon viral load. We found that volunteers with high viral load initially have greater T cell responses, but by 28 days post vaccination those with lower viral load are able to ‘catch-up’. Using differential equation modeling we show that this pattern is consistent with viral load only affecting recruitment (i.e. programmed proliferation) as opposed to affecting recruitment and proliferation (i.e. antigen dependent proliferation). A quantitative understanding of the dependence of T cell dynamics on antigen load will be of use to modelers studying not only vaccination, but also cancer immunology and autoimmune disorders.
Keywords: T cell Proliferation, Programmed Proliferation, Yellow Fever Vaccine
1. Introduction
CD8 T cells are an important part of the adaptive immune response, capable of killing both infected cells and tumor cells. Their populations are also highly dynamic. During an infection, antigen specific T cells divide rapidly to mount an immune response of effector cells. The population then contracts leaving behind a population of memory cells to protect against future infection.
Although the dynamics of these response have been well characterized (De Boer et al, 2001; Perelson, 2002; De Boer et al, 2003), key questions remain. What determines the size of the effector and memory populations during an immune response? In particular, how does it depend on the size of infection, i.e the dose of antigen. A qualitative understanding of how T cell behavior depends upon antigen is useful in many contexts: cancer immunology (Moore and Li, 2004; de Pillis et al, 2005; Wilson and Levy, 2012), autoimmune disease (Mahaffy and Edelstein-Keshet, 2007; Khadra et al, 2009; Kim et al, 2009; Jaberi-Douraki et al, 2014), as well as within host disease modeling (Nowak and Bangham, 1996; Ciupe et al, 2006; Terry et al, 2012; Zarnitsyna et al, 2016).
There are two major hypotheses as to the role of antigen load in T cell dynamics: antigen dependent proliferation, in which T cell proliferation rate is dependent upon the current availability of antigen (Antia et al, 1994; Nowak and Bangham, 1996; De Boer and Perelson, 1995, 1998; Antia et al, 2003); and programmed proliferation, in which antigen is required to stimulate only the first division and the remainder are automatic or ‘programmed’ (Antia et al, 2003; Marchingo et al, 2014).
Experimental models of infection in mice have shown that only a short window of antigen exposure is sufficient to generate a T cell response (Mercado et al, 2000; van Stipdonk et al, 2001; Kaech and Ahmed, 2001). However, the size of the response may still depend upon the amount of antigen exposure, depending on when the response is measured and how the antigen level is manipulated (Mercado et al, 2000; Kaech and Ahmed, 2001; Badovinac et al, 2002; Williams and Bevan, 2004). Therefore there is some support for both hypotheses.
There have been few studies of the immune response to changing antigen dose in humans, despite their potentially greater clinical relevance (Davis, 2008). Vaccination of healthy volunteers with the live attenuated yellow fever virus vaccine (YFV) is a useful model system for studying the antigen dose-response in humans (Monath, 2005; Akondy et al, 2009; Edupuganti et al, 2013). Vaccinees undergo a mild infection that can vary in magnitude over five orders of magnitude (Akondy et al, 2015). We have previously reported that the peak viral load, occuring after about 5-7 days, is correlated with the peak number activated T cells, 14 days after vaccination (Akondy et al, 2015).
In this study, we analyze how antigen load affects the T cell response size at different time points after infection.
We find that at early timepoints after vaccination (days 11 and 14) there is a weak but significant dependence of YFV-specific CD8 T cells upon the peak plasma viral load. No correlation is found at later timepoints (days 28 and 90 after vaccination).
In support of point 1, we find that the expansion of the immune response between day 14 and day 28 is significantly negatively correlated with viral load. We refer to this phenomenon as the ‘catch-up’, as the immune response in individuals with lower viral load catches up to that of individuals with higher viral load. The catch-up is primarily not due to saturation of the immune response as the fold change between day 14 and 28 is not correlated with the response size.
The ‘catch-up’ phenomenon is consistent with a model of programmed proliferation, but not antigen dependent proliferation. We demonstrate this with differential equation models of the two hypotheses.
2. Results
2.1. Peak viral load correlates with CD8 response at effector but not memory time points.
Volunteers (NV = 80) vaccinated with YFV as described in Edupuganti et al (2013) and Akondy et al (2015) show great variation in their viral load (Figure 1A), which is recorded on days 1, 3, 5, 7, 9, 11, and 14 after infection. We first asked how differences in viral load contribute to the subsequent CD8 immune response. The CD8 T cell population was measured on days 3, 7, 11 and 14 as a percentage of cells with an activated phenotpye (CD38+, Bcl2+, and Ki67+), which we will refer to as Ki67+ CD8s, and also on days 11, 14, 28 and 90 as a percentage of cells that stain with the NS4B-MHC tetramer, which we will refer to as Tet+ CD8s.
Fig. 1.
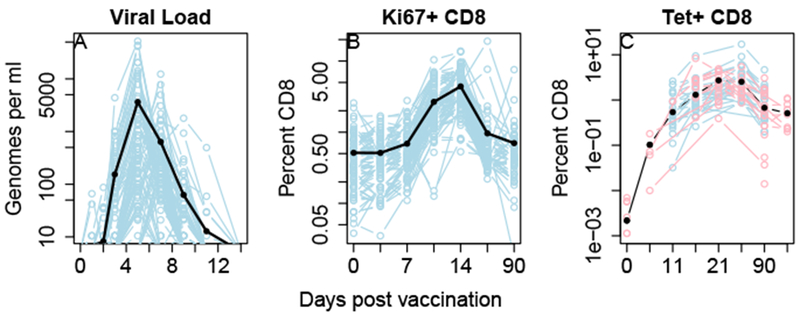
Viral load and CD8 T cell response in individuals infected with the live attenuated yellow fever vaccine. A: YFV infection due to the live attenuated vaccine. B: Percentage of cells in the blood that had an activated (CD38+, Bcl2+, Ki67+) phenotype. C: Percentage of cells that bind to the NS4B tetramer, indicating YFV specificity. Data in blue is from Edupuganti et al (2013) (N=80, 24 of whom have Tet+ data), data in red is unpublished data for which only Tet+ data is available (N=36). The dark black lines, represent the geometric mean, except for the Tet+ data where they represent the fixed effects of a linear model (see methods). Faint lines represent data from invididual volunteers. Panels B and C are plotted on a shifted log scale x=log(50+t).
For each measure of T cell response, we calculate the dependence on the peak viral load, , via linear regression. is the maximum recorded viral load in the ith individual, and typically occurs on either day 5 or 7 after vaccination. We calculate the regression coefficient of the T cell measurement with respect to , then use a two sided t-test to determine whether it is significantly different from zero (Figure 2).
Fig. 2.
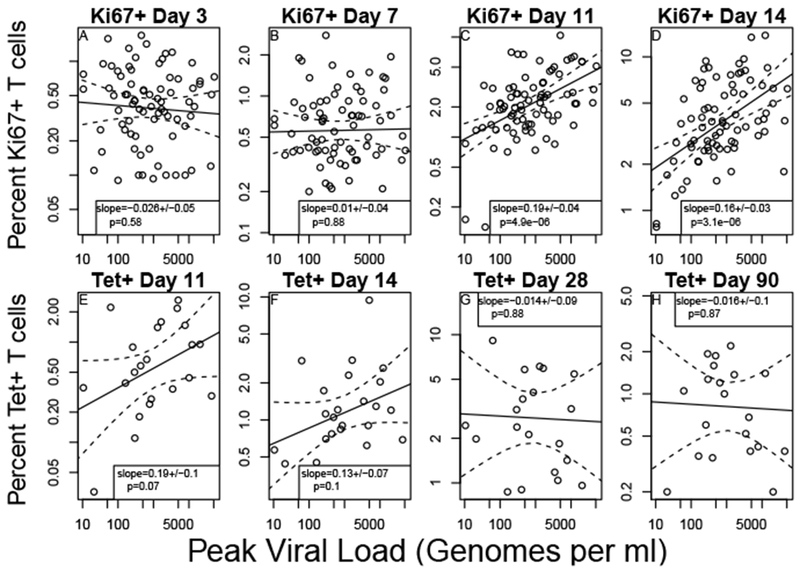
T cell response size after day 28 is not correlated with peak viral load. Relationship between peak viral load and the size of T cell populations after vaccination with the yellow fever vaccine virus. The ‘peak viral load’ is the maximum amount measured on any day in individuals post vaccination and typically occurred on either day 5 or day 7. Panels (A-D) show the correlation of viral load with the ‘effector’ phenotype (i.e. Ki67+, Bcl2+ and CD38+, N=80 individuals) on days 3 (A), 7 (B), 11 (C) and 14 (D) post vaccination. Panels (E-H) show the correlation of viral load with T cells antigen specific T cells that bind the NS4B MHC-tetramer (N=24 individuals) on days 11 (E), 14 (F), 28 (G) and 90 (H). Each panel has the estimate for the regression coefficient and its standard error. The p value is from a two-sided t-test of whether the regression coefficient is significantly different from zero. Dotted lines represent a 95% pointwise confidence interval around the linear fit.
The percentage of Ki67+ T cells correlated with at days 11 and 14 (Figure 2C,D). A 100-fold increase in corresponds to about a 2-fold increase in T cell response. Prior to day 11 there is no strong correlation (Figure 2A,B), likely due to significant numbers of activated T cells that are not part of the YFV-specific response. Once the YFV response becomes large enough to overcome this background population of activated cells, the positive dependence on viral load is strongly significant (p < 10−5 at both day 11 and day 14).
The relationship between Tet+ T cells and is similar to that of Ki67+ T cells at days 11 and 14 (Figure 2E,F). Due to the smaller sample size, this relationship has borderline signficance (p=0.07 at day 11 and p=0.10 at day 14), which should be interpreted with caution due to the 8 comparisons made in this analysis. At both day 28 and 90 there is essentially no relationship betwen Tet+ T cells and (Figure 2G,H).
2.2. Individuals with higher viral load have less CD8 expansion between day 14 and 28
Given the small number of individuals with tetramer staining data, the correlation between viral load and T cell number at days 11 and 14 is of only borderline significance. Therefore it is possible that the number of Tet+ T cells is never related to viral load, and the pattern reported above is only due to statistical noise. If there really is a vanishing dependence of T cell number on viral load, then the change between day 14 and day 28 should correlate negatively with viral load. Figure 3 shows that this is the case with high significance (p < 10−4). This means that individuals with lower viral load ‘catch-up’ to those with higher viral load during this time frame. Taken with the previous results our data suggests that the peak viral load is correlated with the T cell response at day 11 and 14 post vaccination but not at day 28 or day 90.
Fig. 3.
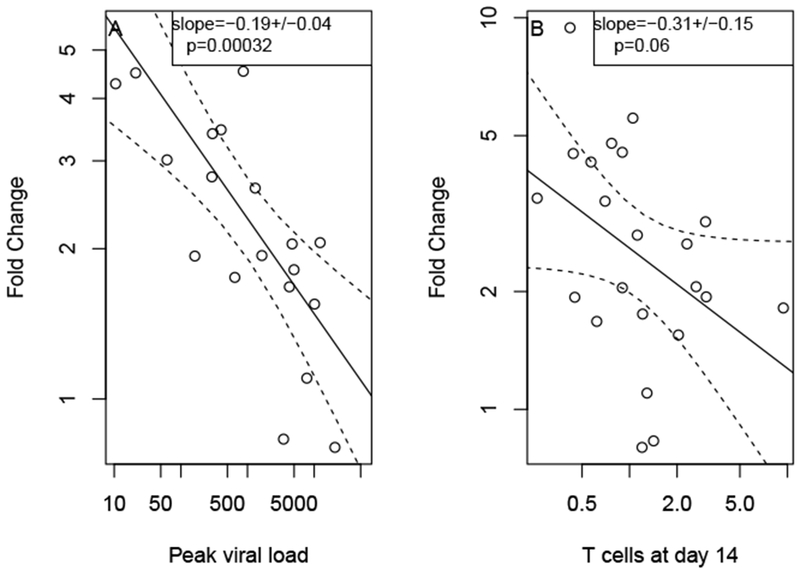
Catch-up of immune response. The fold change in the number of Tet+ T cells is significantly negatively correlated with peak viral load (A). It is also negatively correlated with the number of T cells at day 14 but not significantly. Individuals with low viral load initially have a smaller T cell population, but their response catches up by day 28. Figures represent data from 24 individuals.
One possible explanation of this catch-up is that individuals with higher responses by day 14 see less subsequent expansion due to saturation of the immune response size. In that case we would expect the fold expansion between day 14 and day 28 to be negatively correlated with the immune response at day 14, and therefore also viral load as they are correlated. However, from the single regressions shown in 3 it is unclear whether it is viral load or day 14 immune response which is driving the ‘catch-up’. We therefore perform a multiple regression analysis of the day 14 to day 28 expansion with both and day 14 tetramer as regressors.
Of the models considered, only the programmed proliferation model is qualitatively consistent with the results of this linear regression, as it predicts both the negative dependence on viral load and the lack of dependence on day 14 immune response (Table 1). All variables are log transformed in this analysis. The regression coefficient for virus (−0.21 ± 0.05 p = 2.1 × 10⁻⁴) is unchanged from the single regression and still highly significant by two sided t-test. The regression coefficient for day 14 Tet+ T cells (−0.02 ± 0.13 p = 0.9) was negligible.
Table 1. Predictors of T cell expansion.
Each model of T cell proliferation predicts a different pattern of fold expansion. According to the Antigen-Dependent and Saturation models, there should be either no correlation or a positive correlation between peak viral load and expansion, whereas the Programmed-Proliferation model predicts a negative correlation. A negative correlaion was observed. The Saturation model predicts a negative correlation between T cell number at day 14 and subsequent expansion whereas the other two models predict no correlation. No significant correlation was observed.
| Relationship with day 14-28 expansion | ||
|---|---|---|
| Model | Peak Viral Load | Day 14 T cells |
| Antigen-Dependent | +/0 | 0 |
| Programmed-Proliferation | - | 0 |
| Saturation | +/0 | - |
| Observation | −0.21 ± 0.05 | −0.02 ± 0.13 |
A similar result was found when regressing with day 11 Tet+ or day 14 Ki67+ CD8 T cells. This suggests that the saturation of the immune response is not the underlying cause of the ‘catch-up’ phenomenon. To assess whether this analysis was effected by outliers we perform a bootstrap analysis. Out of 100 random bootstrap resamples, 93 showed a signficant negative correlation between peak viral load and subsequent expansion with a p-value of 0.01 or less, whereas 0 showed a relationship between day 28 T cell number of subsequen expansion with a p-value of .05 or less. Therefore these results are highly robust.
Another potential explanation of the catch up is that antigen presentation during days 14 to 28 may be negatively correlated with observed peak during days 3-9. There was a slight trend towards higher viral peaks occuring earlier (1A and (Akondy et al, 2015; Moore et al, 2018)). Although there was no observable negative correlation between early and late viraemia, by day 14 the virus has dropped to undetectable levels so it cannot be ruled out entirely. Furthermore, the fold change may not represent proliferation, but recruitment of new cells, and the catch-up phenomenon may be due to a delay in the immune response among those with lower viral load. To address these problems, in the next section we develop differential equation models using the full time course of viraemia.
2.3. Programmed proliferation but not antigen dependent proliferation can reproduce these data
We hypothesize that the catch-up mentioned above is inconsistent with antigen dependent proliferation (Figure 4A). If T cell proliferation rate depends upon the level of viral antigen they encounter, then the catch-up will be impossible, even if we incorporate saturation of the immune response. On the other hand, the data should be consistent with programmed proliferation (Figure 4B). The initial dependence on viral load could be due to more rapid recruitment, and the subsequent catch-up in individuals with lower viral load occurs as cells that are recruited later on continue to divide. To test these hypotheses we develop differential equation models of both the programmed proliferation model and antigen dependent proliferation model. We challenged these models to reproduce the basic patterns seen in the data: the mean T cell number and dependence upon max viral load.
Fig. 4. T cell proliferation models.
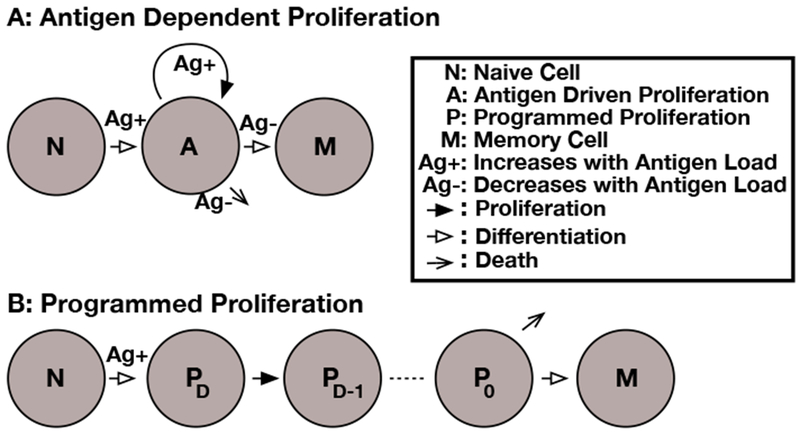
The models of T cell proliferation used in the paper. In all models, the rate of recruitment is dependent on antigen. A: In the antigen dependent proliferation model (3), the rate of cell division is also dependent on antigen levels. The transition to the memory population only occurs when antigen levels drop off. B: In the programmed proliferation model (7), the rate of division and the total number of divisions is fixed at recruitment. Once the preprogrammed number of divisions is complete, the T cell may either die or transition to a memory state.
In the ‘Antigen Dependent proliferation’ model (Figure 4A), which is similar to that described in Antia et al (2005), all T cells start in the naive N class. Upon recruitment all cells enter the antigen dependent class A. When the antigen level drops, cells in the A class start to die or transition to the memory cell population M. Inspection of the data in Figure 1 show that the number of T cells clearly continues to rise after the clearance of viral genomes from the blood. Therefore, we assume that the T cell population responds to the level of viral antigen in lymphatic tissues L rather than the blood. We assume that L tracks V(t) with a decay rate of δ.
| (1) |
letting G = L/α yields the simplified equation
| (2) |
The equations for the antigen dependent proliferation model are below.
| (3) |
The function f gives the dependence of recruitment, proliferation, and differentiation upon viral antigen. As in Antia and Koella (1994) and De Boer et al (2001) we use
| (4) |
where x is a quantity representing viral antigen.
We model saturation of the immune response via competition for antigen between T cells as in (De Boer and Perelson, 1995). We modify the Antigen Dependent model by substitution f(x) for
| (5) |
in (3). This modification means that T cells of the same antigen specificity must compete with each other for antigenic stimulation. Therefore, for a fixed level of G there is a limit to the number of T cells that can be supported, and eventually the response will saturate at a carrying capacity. This carrying capacity still increases linearly with G.
In the programmed proliferation model (Figure 4B), only the initial recruitment step strictly requires antigenic stimulation. Following Marchingo et al (2014), we assume that upon activation T cells transition from the N population to PD, which will undergo D divisions before entering the quiescent P0 population. Not every T cell will make the same number of divisions, each T cell has a probability aD of entering the PD population upon activation where
| (6) |
Here μ and ν are fitted model parameters representing approximately the mean and standard deviation of the number of divisions each recruited cells undergoes. Note that we modify the expression used in Marchingo et al (2014) to ensure that each recruited cells undergoes at least one division. Once dividing cells reach P0, they either die or transition to the M class.
| (7) |
As expected, the programmed proliferation model but not the antigen dependent proliferation model could reproduce the dependence on viral load (Figure 5B), although both could fit the mean dynamics of T cells (Figure 5A). The programmed proliferation model shows an initial dependence on viral load that disappears between day 14 and 28. The antigen dependent proliferation shows a continued dependence upon antigen load even at later timepoints. However it is possible for the antigen dependent model to reproduce the mean T cell numbers on each day (dashed red line in Figure 5A) at the expense of a very poor fit to the dependence on virus (Figure 5B). Adding saturation via competition for antigen does not improve the fit of the antigen dependent model
Fig. 5.
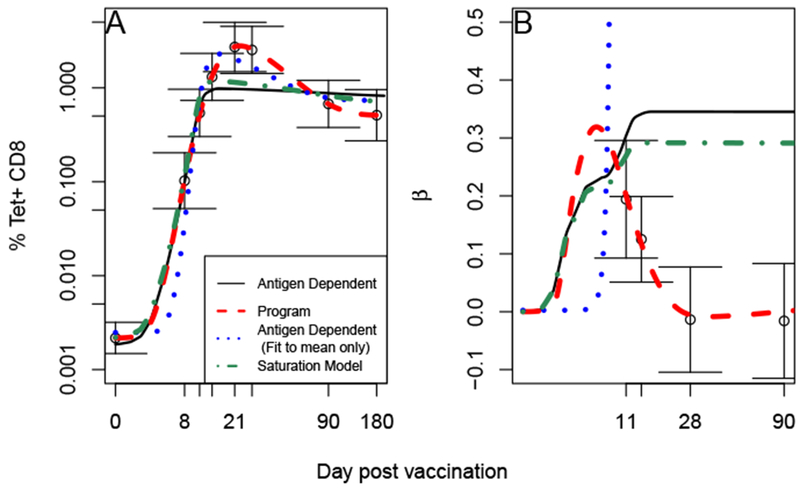
Programmed but not antigen dependent proliferation can match data. We fit each model to the mean Tet+ T cell count (A, see Table 4) and regression coefficient between T cell count and peak viral load (B, see Figure 2) using (16). Error bars represent standard errors. The antigen dependent proliferation model (solid red, (3)) fall outside one standard deviation at some timepoints. However we note that it can reproduce mean T cell count (blue dots). The saturation model (dash-dot green, (5)) also cannot reproduce the data. The program proliferation model (dashed red, (7)) falls within one standard error and is the only one which can reproduce the almost complete decline in T cell dependence upon viral load. Parameters are listed in Table 2
The mean and regression coefficients are only summary statistics of the Tet+ data. As it is possible that the programmed proliferation model may prove to be a poorer fit when comparing to all individual data points, we also tested the ability of each model to reproduce the Tet+ data of each individual. However this was only possible for the subset of individuals with known viral load. In this analysis, the programmed proliferation model proved to be a much better fit to the data than either the antigen dependent (Table 3.
Table 3. Summary of fits.
We use two methods to evaluate the model fits. First we compare the models mean Tet+ number and regression coefficient with to the empirical values (deviance is Λ1). Then we compare the Tet+ expression in each individual to the model prediction by plugging in their individual viral load (deviance is Λ2). The deviation of the model values from the empirical is given by Λ1. The parameter values that minimize Λ1 are given in Table 2.
| Mean/Slope | All points | |||
|---|---|---|---|---|
| Model | Λ1 | AIC1 | Λ2 | AIC2 |
| Antigen Dependent | 27.92 | 41.92 | 89.81 | 271.05 |
| Saturation | 18.56 | 34.56 | 330.81 | 273.05 |
| Programmed | 0.1 | 16.1 | 25.44 | 158.27 |
2.4. Non-exponentially distributed division times does not change outcome
The models considered so far approximate the process of T cell proliferation by assuming that the time between divisions is exponentially distributed. However, this assumption may lead to some cells progressing through the cell cycle faster than is reasonable for this complex and tightly regulated process. To assess the impact that the exponential assumption has on our results, we also consider versions of our T cell proliferation models with a two-step division (the Smith-Martin model) (Smith and Martin, 1973; De Boer et al, 2006; Ganusov et al, 2007). The first step is exponentially distributed while the second step has a fixed length of Δ = 7 hours. We modify (3) and (7) to include the deterministic step via delay differential equations.
In the antigen dependent model, the variable B denotes T cells in the deterministic phase of division.
| (8) |
In the above model we assume that programmed cell death or memory differentiation cannot occur during the deterministic phase.
In the program model, the variables PD,1 and PD,2 represent cells in the stochastic and deterministic phases of division, repectively.
| (9) |
Including non-exponentially distributed division times does not qualitatively change our results. The Antigen Dependent model, even with saturation, still cannot simultaneously reproduce both the T cell mean dynamics and their relationship with peak viral load, whereas the programmed proliferation model can (Figure 6).
Fig. 6.
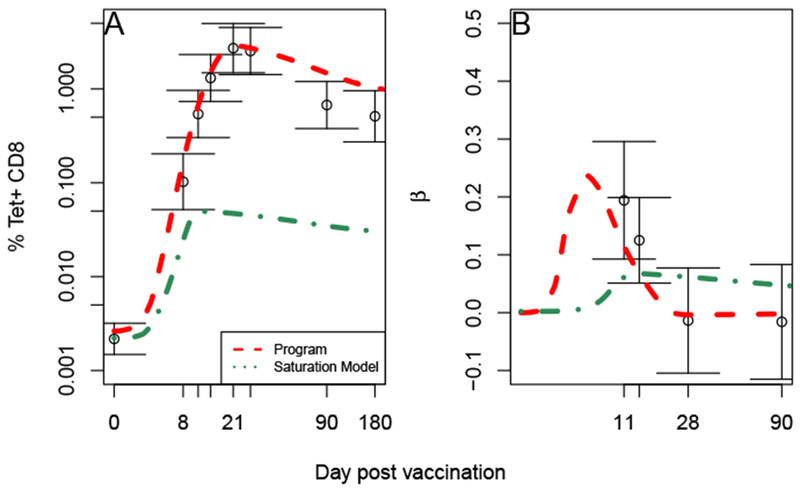
Non-exponentially distributed division times gives a qualitatively similar result. Comparison of each model with mean Tet+ T cell count (A) and regression coefficient between T cell count and peak viral load (B). Error bars represent standard errors. The program proliferation model ((9), dashed red) is a much better fit to the data than the antigen proliferation dependent model with saturation ((8) dash-dot green).
3. Discussion
Using data from individuals vaccinated with the yellow fever vaccine (YFV), we evaluate the relationship between peak viral load and T cell response. We find that individuals with higher peak viral load initially have a greater T cell response, but between days 14 and 28 post vaccination, those with lower peak viral load catch-up. This suggests that the size of the memory population generated in response to YFV is independent of antigen load. Using differential equation models, we show that programmed proliferation but not antigen dependent proliferation is consistent with this independence.
The catch-up phenomenon cannot simply be explained by the saturation of the immune response. A saturation model would still predict a positive correlation between viral load and expansion between days 14 and 28, the opposite of the pattern seen. In addition a differential equation model incorporating saturation could not reproduce the catch-up. However, saturation may still play a role in this system as studies in mice suggest that there is a certain amount of negative feedback in the immune response. For example, increasing precursor number by adoptive transfer of naive cells does not increase the immune response by the same amount (Badovinac et al, 2007; Ford et al, 2007). This effect may be too small to observe in these data because the precursor number in these individuals is unlikely to vary as much in the animal models (Alanio et al, 2010). Negative feedback via competition may also be more important early on, prior to the immune response becoming detectable. This is consistent with the observation that increased competition affects recruitment rate more than proliferation rate (Willis et al, 2006).
The catch-up phenomenon also does not imply that effector and memory responses are uncorrelated on an individual level. In fact it was observed that they are correlated even in the data considered here Akondy et al (2015). Differences between individuals that are independent of viral load may remain stable. For example, a difference in precursor number may lead to differences in T cell numbers at both effector and memory timepoints.
Our conclusions are based on T-cell and viraemia measurements in blood as opposed to lymphoid or other infected tissues. It is possible that individuals with greater viral load generate greater numbers of resident memory T cells that do not show up in a blood test.
Within our study population, the magnitude but not the duration of infection varied significantly. Varying the duration of infection could produce very different results. Such a discrepancy was seen in mice when the duration of infection rather than the inoculum dose was varied (Badovinac et al, 2002; Williams and Bevan, 2004). Furthermore, in response to prolonged antigen stimualation T cells enter an exhausted state with decreased proliferative potential (Wherry, 2011), suggesting that T cells are sensitive to antigenic stimulation at times other than recruitment.
4. Methods
4.1. Linear Interpolation of Viral Data
When simulating the differential equation models we require a continuous function V(t) representing the viral load in each individual. We linearly interpolate between the available measurements. For times after the last available measurement we assume V(t) = 0, which is reasonable considering the virus becomes undetectable by day 14 in all individuals. Therefore, given measurements Vk taken at time tk
| (10) |
4.2. Calculating empirical means and regression coefficients
We compare each model to the empirical mean Tet+ T cell percentage at each timepoint, as well as the empirical regression coefficient with respect to the viral load. We supplement the data in Figure 2 with unpublished data of Tet+ T cells at day 0, 8, 14, 21, 28, 90 and 180 days after vaccination in individuals who did not have their peak viral load recorded. To combine the data sets, we make a linear mixed model of the T cell data. Let Xij be the % NS4b tetramer positive T cells on day j in individual i.
| (11) |
where the Day is a fixed effect and the Individual a random effect. The fixed effects and standard errors are shown in Table 4 and were calculated using the lmer function in the lme4 package for R.
Table 4. Means and standard errors of Tet+ T cells.
Calculated using a mixed effects model (11). The means are the fixed effects for each day as computed by lmer. Mixed effects model based on data from 60 individuals shown in Figure 1C.
| Day | Mean ± Std Err |
|---|---|
| 0 | a0 ± σa0 =−6.13±0.38 |
| 8 | a8 ± σa8 =−2.28±0.68 |
| 11 | a11 ± σa11 =−0.62±0.58 |
| 14 | a14 ± σa14 =0.27±0.58 |
| 21 | a21 ± σa21 =1±0.6 |
| 28 | a28 ± σa28 =0.93±0.58 |
| 90 | a90 ± σa90 =−0.39±0.58 |
| 180 | a180 ± σa180 =−0.67±0.63 |
4.3. Fitting to the mean and regression coefficient
Let be the calculated number of T cells (X) at time t as predicted by model F with parameter values θ and viral load function Vi(t). The viral load function is calculated according to (10) using the measurements from individual i.
For a given model F and set of parameter values θ, we calculate the goodness of fit as follows
Calculate for all individuals with tetramer data available
- Calculate the simulated mean and regression coefficients
(12)
where V* is the empirical peak viral load.(13)
We also consider a residual where we compare each T cell measurement to the value produced by the model.
| (17) |
where ϕj is the set of all participants who have a measurement on day j.
We minimize Λ1 and Λ2 using the nls.lm function in the minpack.lm package in R. The analytical jacobian was supplied for each ODE model to aid convergence and multiple randomized starting parameters were used.
Our two objective values Λ1 and Λ2 produce two different AICs for a given model.
| (18) |
| (19) |
Table 2. Model Parameters.
These are the parameters used to match the mean T cell number at each time point and the regression coefficient with peak virus. Simulations based on these parameter sets are shown in Figure 5. A blank space indicates that the model doesn’t have that parameter. AD=antigen dependent, ADM= antigen dependent model fit only to means, PP=program proliferation, SM=saturation model
| Parameter | Description | AD | ADM | PP | SM |
|---|---|---|---|---|---|
| X0 | Precursor Number | 0.0019 | 0.0025 | 0.0022 | 0.0022 |
| σ | Proliferation Rate | 0.73 | 2 | 0.9 | 0.73 |
| ρ | Recruitment Rate | 13.24 | 0.03 | 10 | 10 |
| ϕ | Virus half max value | 0.1 | 68.34 | 212.84 | 0.01 |
| ϕ2 | T cell saturation constant | 0.055 | |||
| d | Elimination Rate | 0.0024 | 0.04 | 0.036 | 0.0078 |
| k | Memory Differentiation Rate | 0.01 | 0.01 | 0.0055 | 0.01 |
| δ | Antigen Clearance Rate | 3.84 | 0.96 | 3.75 | |
| μD | Mean number of programmed divisions | 9.74 | |||
| Variance in number of divisions | 2.64 |
Acknowledgments
This work was supported by four NIH grants NIH U54GM111274, NIH R01AI110720 (to R. Antia), NIH U19AI11789102 (to R.Antia and R.Ahmed), and U19AI057266 (to R. Ahmed).
Contributor Information
James Moore, Division of Vaccines and Infectious Diseases, Fred Hutchinson Cancer Research Center.
Hasan Ahmed, Department of Biology, Emory University.
Don McGuire, Emory Vaccine Center, Emory University.
Rama Akondy, Department of Microbiology and Immunolobiology, Emory University.
Rafi Ahmed, Emory Vaccine Center, Emory University.
Rustom Antia, Department of Biology, Emory University.
References
- Akondy RS, Monson ND, Miller JD, Edupuganti S, Teuwen D, Wu H, Quyyumi F, Garg S, Altman JD, Del Rio C, Keyserling HL, Ploss A, Rice CM, Orenstein WA, J MM, Ahmed R (2009) The yellow fever virus vaccine induces a broad and polyfunctional human memory CD8+ T-cell response. J Immunol 183(12):7919–7930 [DOI] [PMC free article] [PubMed] [Google Scholar]
- Akondy RS, Johnson PL, Nakaya HI, Edupuganti S, Mulligan MJ, Lawson B, Miller JD, Pulendran B, Antia R, Ahmed R (2015) Initial viral load determines the magnitude of the human CD8 T cell response to yellow fever vaccination. PNAS 112(10):3050–3055 [DOI] [PMC free article] [PubMed] [Google Scholar]
- Alanio C, Lemaitre F, Law HK, Hasan M, Albert ML (2010) Enumeration of human antigen–specific naive CD8+ T-cells reveals conserved precursor frequencies. Blood 115(18):3718–3725 [DOI] [PubMed] [Google Scholar]
- Antia R, Koella JC (1994) A model of non-specific immunity. J Theor Biol 168(2):141–150 [DOI] [PubMed] [Google Scholar]
- Antia R, Levin BR, May RM (1994) Within-host population dynamics and the evolution and maintenance of microparasite virulence. Am Nat pp 457–472 [Google Scholar]
- Antia R, Bergstrom CT, Pilyugin SS, Kaech SM, Ahmed R (2003) Models of CD8+ responses: 1. what is the antigen-independent proliferation program. J Theor Biol 221(4):585–598 [DOI] [PubMed] [Google Scholar]
- Antia R, Ganusov VV, Ahmed R (2005) The role of models in understanding CD8+ T-cell memory. Nature Reviews Immunology 5(2):101–111 [DOI] [PubMed] [Google Scholar]
- Badovinac VP, Porter BB, Harty JT (2002) Programmed contraction of CD8+ T cells after infection. Nat Immunol 3(7):619–626 [DOI] [PubMed] [Google Scholar]
- Badovinac VP, Haring JS, Harty JT (2007) Initial T cell receptor transgenic cell precursor frequency dictates critical aspects of the CD8+ T cell response to infection. Immunity 26(6):827–841 [DOI] [PMC free article] [PubMed] [Google Scholar]
- Ciupe M, Bivort B, Bortz D, Nelson P (2006) Estimating kinetic parameters from hiv primary infection data through the eyes of three different mathematical models. Math Biosci 200(1):1–27 [DOI] [PubMed] [Google Scholar]
- Davis MM (2008) A prescription for human immunology. Immunity 29(6):835–838 [DOI] [PMC free article] [PubMed] [Google Scholar]
- De Boer RJ, Perelson AS (1995) Towards a general function describing t cell proliferation. J Theor Biol 175(4):567–576 [DOI] [PubMed] [Google Scholar]
- De Boer RJ, Perelson AS (1998) Target cell limited and immune control models of hiv infection: a comparison. J Theor Biol 190(3):201–214 [DOI] [PubMed] [Google Scholar]
- De Boer RJ, Oprea M, Antia R, Murali-Krishna K, Ahmed R, Perelson AS (2001) Recruitment times, proliferation, and apoptosis rates during the CD8+ T-cell response to lymphocytic choriomeningitis virus. J Virol 75(22):10,663–10,669 [DOI] [PMC free article] [PubMed] [Google Scholar]
- De Boer RJ, Homann D, Perelson AS (2003) Different dynamics of CD4+ and CD8+ T cell responses during and after acute lymphocytic choriomeningitis virus infection. J Immunol 171(8):3928–3935 [DOI] [PubMed] [Google Scholar]
- De Boer RJ, Ganusov VV, Milutinovic D, Hodgkin PD, Perelson AS (2006) Estimating lymphocyte division and death rates from CFSE data. Bull Math Biol 68(5):1011–1031 [DOI] [PubMed] [Google Scholar]
- Edupuganti S, Eidex RB, Keyserling H, Akondy RS, Lanciotti R, Orenstein W, del Rio C, Pan Y, Querec T, Lipman H, Barrett A, Ahmed R, Teuwen D, Cetron M, Mulligan MJ (2013) A randomized, double-blind, controlled trial of the 17D yellow fever virus vaccine given in combination with immune globulin or placebo: comparative viremia and immunogenicity. Am J Trop Med Hyg 88(1):172–177 [DOI] [PMC free article] [PubMed] [Google Scholar]
- Ford ML, Koehn BH, Wagener ME, Jiang W, Gangappa S, Pearson TC, Larsen CP (2007) Antigen-specific precursor frequency impacts T cell proliferation, differentiation, and requirement for costimulation. J Exp Med 204(2):299–309 [DOI] [PMC free article] [PubMed] [Google Scholar]
- Ganusov VV, Milutinović D, De Boer RJ (2007) IL-2 regulates expansion of CD4+ T cell populations by affecting cell death: insights from modeling CFSE data. The Journal of Immunology 179(2):950–957 [DOI] [PubMed] [Google Scholar]
- Jaberi-Douraki M, Pietropaolo M, Khadra A (2014) Predictive models of type 1 diabetes progression: understanding T cell cycles and their implications on autoantibody release. PloS one 9(4):e93,326. [DOI] [PMC free article] [PubMed] [Google Scholar]
- Kaech SM, Ahmed R (2001) Memory CD8+ T cell differentiation: initial antigen encounter triggers a developmental program in naive cells. Nat Immunol 2(5):415–422 [DOI] [PMC free article] [PubMed] [Google Scholar]
- Khadra A, Santamaria P, Edelstein-Keshet L (2009) The role of low avidity T cells in the protection against type 1 diabetes: a modeling investigation. J Theor Biol 256(1):126–141 [DOI] [PubMed] [Google Scholar]
- Kim PS, Levy D, Lee PP (2009) Modeling and simulation of the immune system as a self-regulating network. Methods in Enzymol 467:79–109 [DOI] [PubMed] [Google Scholar]
- Mahaffy JM, Edelstein-Keshet L (2007) Modeling cyclic waves of circulating T cells in autoimmune diabetes. SIAM Journal on Applied Mathematics 67(4):915–937 [Google Scholar]
- Marchingo JM, Kan A, Sutherland RM, Duffy KR, Wellard CJ, Belz GT, Lew AM, Dowling MR, Heinzel S, Hodgkin PD (2014) Antigen affinity, costimulation, and cytokine inputs sum linearly to amplify T cell expansion. Science 346(6213):1123–1127 [DOI] [PubMed] [Google Scholar]
- Mercado R, Vijh S, Allen SE, Kerksiek K, Pilip IM, Pamer EG (2000) Early programming of T cell populations responding to bacterial infection. J Immunol 165(12):6833–6839 [DOI] [PubMed] [Google Scholar]
- Monath TP (2005) Yellow fever vaccine. Expert Rev Vaccines 4(4):553–574 [DOI] [PubMed] [Google Scholar]
- Moore H, Li NK (2004) A mathematical model for chronic myelogenous leukemia (CML) and T cell interaction. J Theor Biol 227(4):513–523 [DOI] [PubMed] [Google Scholar]
- Moore J, Ahmed H, Jia J, Akondy R, Ahmed R, Antia R (2018) What controls the acute viral infection following yellow fever vaccination? Bull Math Biol 80(1):46–63 [DOI] [PMC free article] [PubMed] [Google Scholar]
- Nowak MA, Bangham CR (1996) Population dynamics of immune responses to persistent viruses. Science 272(5258):74–79 [DOI] [PubMed] [Google Scholar]
- Perelson AS (2002) Modelling viral and immune system dynamics. Nature Reviews Immunology 2(1):28–36 [DOI] [PubMed] [Google Scholar]
- de Pillis LG, Radunskaya AE, Wiseman CL (2005) A validated mathematical model of cell-mediated immune response to tumor growth. Cancer Res 65(17):7950–7958 [DOI] [PubMed] [Google Scholar]
- Smith J, Martin L (1973) Do cells cycle? Proceedings of the National Academy of Sciences 70(4):1263–1267 [DOI] [PMC free article] [PubMed] [Google Scholar]
- van Stipdonk MJ, Lemmens EE, Schoenberger SP (2001) Naive CTLs require a single brief period of antigenic stimulation for clonal expansion and differentiation. Nat Immunol 2(5):423–429 [DOI] [PubMed] [Google Scholar]
- Terry E, Marvel J, Arpin C, Gandrillon O, Crauste F (2012) Mathematical model of the primary CD8 T cell immune response: stability analysis of a nonlinear age-structured system. JMB 65(2):263–291 [DOI] [PubMed] [Google Scholar]
- Wherry EJ (2011) T cell exhaustion. Nat Immunol 12(6):492. [DOI] [PubMed] [Google Scholar]
- Williams MA, Bevan MJ (2004) Shortening the infectious period does not alter expansion of CD8 T cells but diminishes their capacity to differentiate into memory cells. J Immunol 173(11):6694–6702 [DOI] [PubMed] [Google Scholar]
- Willis RA, Kappler JW, Marrack PC (2006) CD8 T cell competition for dendritic cells in vivo is an early event in activation. PNAS 103(32):12,063–12,068 [DOI] [PMC free article] [PubMed] [Google Scholar]
- Wilson S, Levy D (2012) A mathematical model of the enhancement of tumor vaccine efficacy by immunotherapy. Bull Math Biol 74(7):1485–1500 [DOI] [PMC free article] [PubMed] [Google Scholar]
- Zarnitsyna VI, Handel A, McMaster SR, Hayward SL, Kohlmeier JE, Antia R (2016) Mathematical model reveals the role of memory CD8 T cell populations in recall responses to influenza. Front Immunol 7. [DOI] [PMC free article] [PubMed] [Google Scholar]