

Abstract
Background and Aims:
People who have recently injected drugs are a priority population in efforts to achieve hepatitis C virus (HCV) elimination. This study estimated the prevalence and number of people with recent injecting drug use living with HCV, and the proportion of people with recent injecting drug use among all people living with HCV infection at global, regional, and country-levels.
Methods:
Data from a global systematic review of injecting drug use and HCV antibody prevalence among people with recent (previous year) injecting drug use were used to estimate the prevalence and number of people with recent injecting drug use living with HCV. These data were combined with a systematic review of global HCV prevalence to estimate the proportion of people with recent injecting drug use among all people living with HCV.
Results:
There are an estimated 6.1 million [95% uncertainty interval (UI) 3.4–9.2] people with recent injecting drug use aged 15–64 years living with HCV globally (39.2% viraemic prevalence; UI 31.6–47.0), with the greatest numbers in East and Southeast Asia (1.5 million, UI 1.0–2.1), Eastern Europe (1.5 million, UI 0.7–2.4), and North America (1.0 million, UI 0.4–1.7). People with recent injecting drug use comprise an estimated 8.5% (UI 4.6–13.1) of all HCV infections globally, with the greatest proportions in North America (30.5%, UI 11.7–56.7), Latin America (22.0%, UI 15.3–30.4), and Eastern Europe (17.9%, UI 8.2–30.9).
Conclusions:
Although about forty-percent of people with recent injecting drug use are living with HCV and almost nine percent of all HCV infections globally occur among people with recent injecting drug use, there is wide variation globally.
Keywords: HCV, PWID, IDU, injecting drug use, estimates, viraemic
INTRODUCTION
The World Health Organization (WHO) has set a goal to eliminate hepatitis C virus (HCV) as a global public health threat by 2030 (1). Between 2015 and 2030, WHO targets include reducing new HCV infections by 80%, the number of HCV deaths by 65%, and increasing HCV diagnoses from 20% to 90% and eligible persons receiving HCV treatment from <5% to 80%. People who inject drugs represent a priority population for HCV elimination, given the high prevalence and incidence in this group (2–7).
We previously estimated the global, regional, and country-level prevalence of HCV (viraemic infections) (8). In 2015, the global prevalence of HCV infection was estimated to be 1.0% (95% uncertainty interval 0.8–1.1), corresponding to 71.1 million (62.5–79.4) people living with HCV (8). We also estimated the global, regional, and country-level HCV antibody prevalence among people with recent injecting drug use (previous 12 months). Among the estimated 15.6 million [uncertainty intervals (UI) 10.2–23.7 million] people with recent injecting drug use aged 15–64 years globally, it is estimated that 52.3% (UI 42.4–62.1%) are HCV-antibody positive, representing 8.2 million people who have recently injected drugs (UI 4.7–12.4 million) with past or present HCV (7). Given that 25% of people spontaneously clear HCV infection (9), estimates are needed on the prevalence and numbers of people with recent injecting drug use who are living with HCV infection (viraemic infection).
There are no previous estimates at the global, regional, and country-levels of the HCV RNA (Ribonucleic acid) prevalence among people with recent injecting drug use, the number of people with recent injecting drug use who are living with HCV infection (HCV RNA detectable or viraemic), or the proportion of people with recent injecting drug use among all people living with HCV infection. These data are crucial to monitor progress of global HCV elimination efforts and identify high-burden settings to enable appropriate targeting of prevention and treatment strategies to achieve the WHO HCV targets.
The aim of this study was to estimate the global HCV RNA prevalence (viraemic infections) among people who have recently injected drugs; the numbers of people with recent injecting drug use living with HCV infection; and the proportion of people who have recently injected drugs among all people living with HCV at global, regional, and country-levels.
Methods
Study design and procedures
This analysis utilized data from two published studies. The first study was a systematic review to estimate the number of people with recent injecting drug use and the HCV antibody (anti-HCV) prevalence among people who have recently (previous 12 months) injected drugs (10). The second study was a systematic review and modelling study to estimate the global viraemic HCV prevalence (8).
The first systematic review estimated global, regional, and country-level prevalence of injecting drug use among people aged 15–64 years; and the prevalence of HIV, HCV, and hepatitis B virus (HBV) among people with recent injecting drug use in 2015 (7). This review was performed consistent with the GATHER and PRISMA guidelines. Multiple search strategies (7) were used to identify papers and reports published since previous reviews of IDU prevalence (from 2008) (11) and of HCV amongst PWID (from 2011) (12). Without language restrictions, peer-reviewed databases (MEDLINE, Embase, and PsycINFO), and grey literature were systematically searched, and data requests disseminated to international experts and agencies. We searched for data on IDU prevalence, and the prevalence of HIV, HCV, and HBV among people with recent injecting drug use. Eligible data on prevalence of IDU, HIV antibody, HBsAg, and HCV antibody among PWID were selected and, where multiple estimates were available, pooled for each country via random effects meta-analysis. Data on HCV RNA prevalence among people with recent injecting drug use were also extracted. Global, regional, and country-level estimates of the HCV antibody (anti-HCV) prevalence among people with recent injecting drug use were used for the current study (7).
The second systematic review estimated global, regional, and country-levels viraemic HCV prevalence in 2015 (8). Data published between January 1, 2000 and March 31, 2016 were identified through searches of electronic peer-reviewed literature databases, PubMed and Embase (8). Non-indexed government reports, personal communication with country experts, and additional studies identified through manual searches of references noted in publications were included where better data were not available. Articles were scored on the degree to which they could be extrapolated to the general population, the sample size, and the year of analysis. A Microsoft Excel-based (version 2007) Markov-type model was populated with the highest-scoring epidemiological data for each country, used to estimate HCV prevalence over time (including in 2015). A Delphi process was used to gain country expert consensus and validate inputs. Further details of data extraction, scoring of data sources, Delphi process, and modelling, have been published (8). Global, regional, and country-level estimates of the numbers of people with viraemic HCV infection were used for the current study (7).
Statistical Analysis
First, we sought to estimate the prevalence of viraemic HCV infection (detectable HCV RNA) among people with recent injecting drug use at global, regional, and country-levels. As shown in Table 1, 48% (98 of 206) of countries had available data on HCV antibody prevalence among people with recent injecting drug use (n=374 studies) as compared to only 9% (19 of 206) of countries with available data on HCV RNA prevalence among people with recent injecting drug use (n=32 studies). Compared to studies of HCV antibody prevalence among people with recent injecting drug use (n=374), studies of HCV RNA prevalence among people with recent injecting (n=32), were less often estimate grade A (multi-site seroprevalence study with >1 sample types) (6.3% vs. 21.9%) and national samples (20.6% vs. 6.2%). Given the poor availability of data on HCV RNA prevalence, we sought to estimate the HCV viraemic proportion (those living with HCV infection) by using estimates of the prevalence of HCV antibodies among people with recent injecting drug use within each country (7) and multiplying by an estimate of the proportion developing viraemic HCV infection (9). The proportion with viraemic HCV infection among those who were HCV antibody positive [75%; 95% confidence interval (CI) 71%, 79%] was estimated using data from a well-characterized merged dataset of nine international cohorts of people who had recently injected drugs who had acquired acute HCV infection and were followed prospectively for spontaneous HCV clearance and viraemic infection (9). The number of people with recent injecting drug use with viraemic HCV infection was then estimated by multiplying the number of people with recent injecting drug use by the HCV viraemic prevalence.
Table 1:
Quality of evidence of countries with available HCV antibody prevalence and HCV RNA prevalence data among recent PWID
| HCV antibody prevalence among recent PWID (n=374) | HCV RNA prevalence among recent PWID (n=32) | |
|---|---|---|
| Countries with available data | 98/206 (47.6%) | 19/206 (9.2%) |
| Estimate grade* | ||
| A | 82 (21.9%) | 2 (6.3%) |
| B1 | 225 (60.2%) | 20 (62.5%) |
| B2 | 13 (3.6%) | 1 (3.1%) |
| C | 54 (14.4%) | 8 (25.0%) |
| U | - | 1 (3.1%) |
| Geographic coverage | ||
| National sample | 77 (20.6%) | 2 (6.2%) |
| Sub-national sample | 87 (23.3%) | 11 (34.4%) |
| City sample | 210 (56.1%) | 19 (59.4%) |
| Literature type# | ||
| A1 | 128 (34.2%) | 30 (93.75%) |
| A2 | 4 (1.1%) | - |
| B2 | 147 (39.3%) | - |
| B3 | 81 (21.7%) | - |
| C | 8 (2.2%) | 2 (6.25%) |
| D | 6 (1.6%) | - |
Grading for estimate grade: A - Multi-site seroprevalence study with >1 sample types (e.g. needle-syringe programmes, drug treatment centres, incarcerated IDUs), B1 - Seroprevalence study, single sample type and multiple sites; B2 - Seroprevalence study, multiple sample types and a single site; C - Seroprevalence study, single sample type; D - Registration or notification of cases of hepatitis/HIV infection; E - Prevalence study using self-reported hepatitis/HIV status; Ungraded - Estimate with methodology unknown.
Grading for literature type: A1 - Peer-reviewed journal article; A2 - Abstract of published article only; B1 - Published book/report/monograph from scholarly or commercial publisher;B2 - Published book/report/monograph from international governmental or monitoring organisation (e.g. UN, WHO, EMCDDA); B3 - Published book/report/monograph from other source (e.g. Government, NGO, university, research centre); C - Conference abstract; D - Other unpublished report (incl. Website downloads); E - Email and private correspondence; F – ARQ.
95% uncertainty intervals (UI) were estimated using Monte Carlo simulation taking 100,000 draws. A binomial distribution was used because the parameters of interest were proportions (product of IDU proportion among population and HCV proportion among PWID). Estimated sample sizes were derived based on the 95% CIs and standard errors of proportion estimates in each country. The simulated UIs incorporated the uncertainty of estimates.
Following the collation of country-specific estimates, estimates of regional and global viraemic HCV infection among people with recent injecting drug use were derived. Region-specific, weighted estimates of the prevalence of HCV were made using all the observed estimates and 95% CI of estimates in each country within that region and deriving a weighted estimate and UI taking into account country population size. Regional estimates were then used to estimate the global prevalence.
The proportion of people with recent injecting drug use among all people living with HCV infection was computed by dividing the total number of people with recent injecting drug use living with HCV by the total number of all people living with HCV for countries where both estimates were available. As above, 95% UIs were simulated taking 100,000 draws carrying forward the standard errors for both people with recent injecting drug use living with HCV and the total HCV viraemic infection prevalence estimates.
RESULTS
Sufficient data were identified to enable estimates of the HCV viraemic prevalence among people with recent injecting drug use in 98 countries, and to estimate the population size of people with recent injecting drug use living with HCV in 76 countries. Sufficient data were identified to enable estimates of the number of people living with HCV overall in 98 countries. There were sufficient data to estimate the number of people with recent injecting drug use as a proportion of all people living with HCV in 55 countries.
Results are shown by region in Table 2 and by country in Table 3. Globally, we estimate that in 2015, 39.2% (UI 31.6–47.0) of people with recent injecting drug use have HCV viraemic infection, representing 6.1 million (UI 3.4–9.2) people with recent injecting drug use living with HCV infection globally. Of the 71.1 million (UI 62.5–79.4 million) people living with HCV infection (Table 2), we estimate that 8.5% (UI 4.6–13.1) are people with recent injecting drug use (Table 2).
Table 2:
Regional and global estimates of the prevalence of HCV viraemic infection among people with recent injecting drug use, the number of people with recent injecting drug use living with HCV viraemic infection, the total population living with HCV vireamic infection and the proportion of people with recent injecting drug use among the total population with HCV viraemic infection
| Prevalence of HCV viraemic infection among people with recent injecting drug use % (UI) | Number of people with recent injecting drug use living with HCV viraemic infection (UI) | Total population living with HCV viraemic infection (UI) | Proportion of people with recent injecting drug use among the total population with HCV viraemic infection % (UI) | |
|---|---|---|---|---|
| Eastern Europe | 48.6 (42.0, 55.2) | 1,466,500 (699,500, 2,377,000) | 8,181,000 (6,304,000, 8,250,000) | 17.9 (8.2, 30.9) |
| Western Europe | 39.9 (35.7, 44.1) | 402,500 (264,500, 557,000) | 2,347,000 (1,969,000, 3,289,000) | 17.2 (9.9, 30.4) |
| East and Southeast Asia | 37.7 (28.2, 47.5) | 1,506,000 (1,019,500, 2,078,500) | 16,313,000 (12,636,000, 17,242,000) | 9.2 (5.8, 13.8) |
| South Asia | 28.9 (13.4, 47.5) | 296,000 (114,500, 518,000) | 15,617,500 (13,341,000, 20,182,000) | 1.9 (0.7, 3.6) |
| Central Asia | 40.5 (36.5, 44.5) | 114,000 (69,000, 165,000) | 2,516,000 (2,010,000, 2,749,000) | 4.5 (2.6, 6.9) |
| Caribbean | 47.6 (40.2, 55.1) | 37,500 (22,500, 55,000) | 225,500 (183,000, 315,000) | 16.7 (8.9, 30.6) |
| Latin America | 46.4 (43.1, 49.8) | 846,000 (617,500, 1,092,500) | 3,854,000 (3,131,000, 3,948,000) | 22.0 (15.3, 30.4) |
| North America | 40.5 (29.2, 51.7) | 960,000 (398,000, 1,679,500) | 3,148,000 (2,429,000, 4,034,000) | 30.5 (11.7, 56.7) |
| Pacific Island states & terr1 | 41.4 (32.4, 50.5) | 9,000 (5,500, 14,000) | 117,500 (101,000, 376,000) | 7.9 (1.9, 11.1) |
| Australasia | 42.8 (38.9, 46.8) | 49,500 (35,500, 65,000) | 278,500 (220,000, 297,000) | 17.7 (12.1, 25.2) |
| Sub-Saharan Africa | 16.3 (12.7, 20.1) | 225,000 (45,500, 458,500) | 9,83,500 (7,605,000, 15,112,000) | 2.3 (0.5, 5.9) |
| Middle East & North Africa | 36.1 (29.2, 43.2) | 126,000 (65,000, 199,500) | 8,625,500 (6,838,000, 9,155,000) | 1.5 (0.7, 2.4) |
| Global | 39.2 (31.6, 47.0) | 6,063,500 (3,434,500, 9,246,000) | 71,146,000 (62,472,000, 79,404,000) | 8.5 (4.6, 13.1) |
Notes:
PWID – people who inject drugs; HCV - Hepatitis C virus; UI - uncertainty interval (see methods for details of estimation).
Number of people with recent injecting drug use with viraemic HCV infection are rounded to the nearest 500.
Total population number with viraemic HCV infection are rounded to the nearest 1,000.
Note that no estimates of the prevalence of anti-HCV among people who inject drugs have been located for the Pacific Islands and Territories, so the weighted observed global prevalence was used here. Considerable caution should be used with these estimates.
Table 3:
Country-level estimates of the prevalence of HCV viraemic infection among people with recent injecting drug use, the number of people with recent injecting drug use living with HCV viraemic infection, the total population living with HCV vireamic infection and the proportion of people with recent injecting drug use among the total population with HCV viraemic infection
| Region and country | Prevalence of HCV viraemic infection among people with recent injecting drug use % (UI) | Number of people with recent injecting drug use living with HCV viraemic infection (UI) | Total population living with HCV viraemic infection (UI) | Proportion of people with recent injecting drug use among the total population with HCV viraemic infection % (UI) |
|---|---|---|---|---|
| Eastern Europe | ||||
| Armenia | 32.0 (22.0,42.3) | 4,000 (1,500, 8,500) | NK | NG |
| Azerbaijan | 46.6 (34.9,58.0) | 20,000 (14,000, 27,000) | 190,000 (125,000, 212,000) | 10.6 (7.3,17.3) |
| Belarus | 43.7 (32.3,55.1) | 18,000 (7,000, 31,500) | NK | NG |
| Bosnia & Herzegovina | 30.0 (20.7,39.5) | NK | NK | NK |
| Bulgaria | 51.5 (47.3,55.8) | 9,500 (7,500, 11,500) | 87,000 (46,000, 112,000) | 11.0 (6.9,20.4) |
| Czech Republic | 13.7 (10.9,16.7) | 6,500 (5,000, 8,000) | 43,000 (22,000, 48,500) | 15.0 (9.2,28.6) |
| Estonia | 59.4 (49.8,68.4) | 5,000 (2,500, 8,500) | 18,000 (11,500, 20,000) | 28.2 (12.6,53.0) |
| Georgia | 51.8 (42.9,60.5) | 59,500 (12,500, 119,500) | 165,000 (120,000, 169,000) | 36.1 (7.4,76.9) |
| Hungary | 35.0 (22.9,47.2) | 1,500 (500, 2,500) | 52,500 (28,500, 55,500) | 2.7 (1.1,5.6) |
| Latvia | 55.8 (49.8,61.7) | 8,000 (6,000, 10,000) | 43,000 (28,000, 50,000) | 18.1 (11.8,29.1) |
| Lithuania | 30.8 (28.1,33.7) | 1,500 (500, 2,500) | 32,500 (20,000, 38,500) | 4.5 (2.0,8.6) |
| Moldova | 37.5 (25.5,49.7) | 4,500 (2,500, 7,000) | NK | NG |
| Poland | 44.0 (40.5,47.6) | NK | 184,000 (136,000, 224,000) | NK |
| Romania | 62.9 (58.7,67.0) | 51,000 (36,000, 67,500) | 547,000 (397,000, 566,000) | 9.3 (6.0,14.2) |
| Russian Federation | 51.6 (44.2,58.9) | 969,500 (463,000, 1,570,500) | 4,748,000 (3,238,000, 4,960,000) | 20.4 (9.6,37.2) |
| Slovakia | 42.1 (26.6,57.7) | 8,500 (3,500, 14,500) | 33,000 (20,000, 37,500) | 25.4 (9.6,52.0) |
| Ukraine | 40.4 (36.3,44.6) | 129,000 (54,000, 222,000) | NK | NG |
| Western Europe | ||||
| Albania | 25.5 (20.1,31.1) | 1,500 (1,000, 2,500) | NK | NG |
| Andorra | NK | NK | NK | NK |
| Austria | 45.7 (40.6,50.9) | 8,500 (6,000, 11,500) | 21,000 (6,000, 30,500) | 40.2 (20.1,100.0) |
| Belgium | 43.8 (34.9,52.6) | 11,500 (7,000, 16,500) | 64,500 (23,000, 75,500) | 17.8 (8.7,45.8) |
| Croatia | 27.5 (21.0,34.2) | 1,500 (1,000, 2,500) | 26,000 (16,500, 28,500) | 6.7 (4.0,11.3) |
| Denmark | 31.9 (26.8,37.2) | 5,500 (4,000, 6,500) | 19,500 (14,500, 19,500) | 27.2 (18.8,39.5) |
| England | 23.1 (20.0,26.3) | 48,500 (41,500, 56,000) | 168,000 (91,000, 211,000) | 28.9 (18.8, 51.8) |
| Finland | 55.2 (51.2,59.4) | 9,500 (7,000, 12,500) | 22,500 (16,000, 26,000) | 41.6 (27.4,62.8) |
| France | 48.0 (44.5,51.5) | 39,500 (31,500, 47,500) | 194,000 (92,500, 222,000) | 20.2 (12.4,40.1) |
| FYR (Form. Yug. Rep) Macedonia | 46.6 (43.4,49.9) | 2,500 (1,500, 3,000) | NK | NK |
| Germany | 48.7 (44.6,53.0) | 64,000 (13,500, 129,000) | 205,000 (90,000, 313,000) | 31.3 (6.2,80.6) |
| Greece | 49.2 (45.4,53.1) | 2,500 (2,000, 3,000) | 132,000 (82,000, 169,000) | 1.9 (1.2,3.1) |
| Greenland | -- | -- | NK | -- |
| Iceland | 47.3 (43.8,50.8) | NK | 1,000 (1,000, 1,000) | NK |
| Ireland | 56.0 (52.5,59.4) | 5,000 (3,500, 6,000) | 29,500 (20,000, 42,500) | 16.2 (10.0,28.9) |
| Italy | 43.4 (38.8,48.1) | 148,500 (98,500, 205,000) | 680,000 (455,000, 1,641,000) | 21.8 (7.6,33.9) |
| Liechtenstein | -- | -- | NK | -- |
| Luxembourg | 61.0 (55.9,66.1) | 1,500 (1,000, 1,500) | 5,500 (3,500, 6,000) | 25.2 (16.6,41.1) |
| Malta | 18.9 (10.4,28.4) | NK | 1,000 (1,000, 1,500) | NK |
| Monaco | NK | NK | NK | NK |
| Montenegro | 32.6 (29.4,35.9) | NK | NK | NK |
| Netherlands | 41.5 (36.7,46.3) | 1,500 (1,000, 2,000) | 16,500 (5,000, 25,500) | 8.3 (4.2,22.9) |
| Northern Ireland | NK | NK | NK | NK |
| Norway | 48.6 (44.5,52.8) | 4,000 (3,500, 5,000) | 21,000 (15,000, 24,500) | 19.4 (13.8,28.1) |
| Portugal | 65.8 (59.1,72.2) | 10,500 (9,000, 12,000) | 89,000 (74,000, 120,000) | 11.7 (8.2,18.1) |
| San Marino | NK | NK | NK | NK |
| Scotland | 39.1 (33.8,44.5) | 6,000 (5,000, 7,500) | NK | NG |
| Serbia | 19.4 (16.5,22.6) | 5,500 (4,500, 7,000) | NK | NG |
| Slovenia | 22.9 (19.6,26.2) | 1,500 (1,000, 2,000) | 6,500 (4,500, 7,000) | 21.3 (13.3,33.5) |
| Spain | 53.3 (50.2,56.3) | 5,500 (2,000, 9,500) | 386,000 (202,000, 620,000) | 1.4 (0.5,3.6) |
| Sweden | 61.3 (57.6,64.9) | 5,000 (<500, 20,000) | 37,500 (28,000, 43,500) | 13.3 (0.0,46.6) |
| Switzerland | 55.9 (51.0,60.9) | 7,500 (6,000, 9,500) | 78,000 (45,500, 87,000) | 9.7 (6.3,16.7) |
| Wales | 20.1 (17.2,23.0) | NK | NK | NK |
| East and South East Asia | ||||
| Brunei Darussalam | NK | NK | NK | NK |
| Cambodia | NK | NK | 257,000 (147,000, 272,000) | NK |
| China | 32.3 (20.8,44.3) | 828,000 (493,000, 1,228,500) | 9,795,000 (6,675,000, 10,832,000) | 8.5 (4.6,14.3) |
| Indonesia | 66.9 (62.2,71.5) | 127,500 (103,000, 153,000) | 1,289,000 (443,000, 2,046,000) | 9.9 (5.5,24.9) |
| Japan | 48.6 (40.8,56.3) | 179,000 (130,500, 234,500) | 857,000 (364,000, 1,024,000) | 20.9 (11.7,46.5) |
| Lao PDR | NK | NK | NK | NK |
| Malaysia | 50.3 (46.2,54.5) | 142,000 (116,000, 169,500) | 382,000 (240,000, 405,000) | 37.1 (25.2,59.2) |
| Mongolia | NK | NK | 194,000 (131,000, 237,000) | NK |
| Myanmar | 22.2 (19.9,24.5) | 38,500 (25,500, 53,000) | NK | NG |
| North Korea | -- | -- | NK | -- |
| Philippines | 26.4 (12.8,41.6) | 6,500 (3,000, 11,500) | 614,000 (353,000, 651,000) | 1.1 (0.4,2.3) |
| Republic of Korea | 36.3 (31.7,41.0) | NK | 231,000 (148,000, 261,000) | NK |
| Singapore | 31.9 (28.9,35.0) | NK | NK | NK |
| Taiwan | 68.2 (64.4,72.0) | NK | 489,000 (310,000, 877,000) | NK |
| Thailand | 66.4 (60.6,71.9) | 34,000 (12,500, 60,000) | 463,000 (255,000, 487,000) | 7.4 (2.6,16.1) |
| Timor Leste | NK | NK | NK | NK |
| Viet Nam | 43.8 (31.8,55.7) | 70,500 (47,000, 98,000) | 1,066,000 (580,000, 1,116,000) | 6.6 (3.7,12.5) |
| South Asia | ||||
| Afghanistan | 28.4 (20.7,36.3) | 39,500 (23,000, 60,000) | 183,000 (85,000, 258,000) | 21.5 (10.5,46.9) |
| Bangladesh | 25.4 (16.9,34.4) | 17,500 (11,500, 24,000) | NK | NG |
| Bhutan | NK | NK | NK | NK |
| India | 30.0 (25.2,34.9) | 59,000 (38,000, 84,000) | 6,245,000 (4,748,000, 10,957,000) | 0.9 (0.4,3.0) |
| Iran | 33.1 (21.4,45.2) | 52,000 (29,500, 81,000) | 199,000 (129,000, 226,000) | 26.2 (13.2,47.0) |
| Maldives | 0.5 (0.0,1.4) | <500 (<500,<500) | NK | NG |
| Nepal | 33.4 (23.1,43.8) | 12,000 (8,000, 15,500) | NK | NG |
| Pakistan | 27.4 (0.0,60.6) | 116,000 (<500, 173,500) | 7,172,000 (5,363,000, 7,487,000) | 1.6 (0.7,3.6) |
| Sri Lanka | NK | NK | NK | NK |
| Central Asia | ||||
| Kazakhstan | 44.1 (39.8,48.4) | 49,500 (30,000, 71,500) | 508,000 (334,000, 572,000) | 9.8 (5.4,16.7) |
| Kyrgyzstan | 32.9 (29.9,36.0) | 9,500 (5,500, 13,500) | NK | NG |
| Tajikistan | 46.0 (41.9,50.2) | 11,000 (6,500, 15,500) | NK | NG |
| Turkmenistan | NK | NK | NK | NK |
| Uzbekistan | 38.8 (34.7,43.0) | 36,500 (22,500, 53,000) | 1,292,000 (902,000, 1,524,000) | 2.8 (1.6,4.6) |
| Caribbean | ||||
| Antigua & Barbuda | -- | -- | NK | -- |
| Bahamas | NK | NK | NK | NK |
| Barbados | -- | -- | NK | -- |
| Bermuda | NK | NK | NK | NK |
| Comm. of Puerto Rico | 58.8 (53.9,63.7) | 16,500 (10,000, 24,000) | 35,500 (23,000, 60,500) | 46.6 (22.1,100.0) |
| Cuba | -- | -- | 35,000 (13,500, 77,000) | -- |
| Dominica | -- | -- | NK | -- |
| Dominican Republic | NK | NK | 68,000 (41,500, 108,000) | NK |
| Grenada | -- | -- | NK | -- |
| Haiti | NK | NK | NK | NK |
| Jamaica | NK | NK | NK | NK |
| Saint Kitts & Nevis | -- | -- | NK | -- |
| Saint Lucia | -- | -- | NK | -- |
| St Vincent & the Grenadines | -- | -- | NK | -- |
| Trinidad & Tobago | -- | -- | NK | -- |
| Latin America | ||||
| Argentina | 41.0 (37.5,44.4) | 33,000 (30,000, 36,000) | 326,000 (144,000, 490,000) | 10.1 (6.3,21.0) |
| Belize | -- | -- | NK | -- |
| Bolivia | NK | NK | NK | NK |
| Brazil | 47.9 (44.3,51.5) | 461,000 (336,500, 596,500) | 1,787,000 (1,293,000, 1,896,000) | 25.8 (17.2,38.5) |
| Chile | NK | NK | 56,500 (31,000, 94,000) | NK |
| Colombia | 21.6 (19.3,24.0) | NK | 409,000 (272,000, 436,000) | NK |
| Costa Rica | NK | NK | NK | NK |
| Ecuador | NK | NK | NK | NK |
| El Salvador | NK | NK | NK | NK |
| Guatemala | NK | NK | NK | NK |
| Guyana | NK | NK | NK | NK |
| Honduras | NK | NK | NK | NK |
| Mexico | 71.5 (67.3,75.5) | 107,500 (70,500, 149,000) | 532,000 (304,000, 557,000) | 20.2 (11.4,37.2) |
| Nicaragua | NK | NK | NK | NK |
| Panama | NK | NK | 12,500 (7,500, 13,500) | NK |
| Paraguay | 7.4 (5.8,9.0) | NK | NK | NK |
| Peru | NK | NK | 167,000 (99,000, 182,000) | NK |
| Suriname | NK | NK | NK | NK |
| Uruguay | 16.4 (14.1,18.9) | 1,000 (<500, 2,500) | NK | NG |
| Venezuela | NK | NK | 118,000 (58,500, 126,000) | NK |
| North America | ||||
| Canada | 52.9 (44.5,61.2) | 65,000 (50,000, 82,000) | 212,000 (136,000, 246,000) | 30.7 (20.2,49.3) |
| United States | 39.8 (28.4,51.3) | 895,000 (353,500, 1,601,500) | 2,936,000 (2,231,000, 3,826,000) | 30.5 (10.9,58.9) |
| Pacific Island States & Terr. | ||||
| American Samoa | NK | NK | NK | NK |
| Fed. States of Micronesia | NK | NK | NK | NK |
| Fiji | NK | NK | 500 (<500, 3,000) | NK |
| French Polynesia | NK | NK | NK | NK |
| Guam | NK | NK | NK | NK |
| Kiribati | NK | NK | NK | NK |
| Marshall Islands | NK | NK | NK | NK |
| Nauru | -- | -- | NK | -- |
| New Caledonia | NK | NK | NK | NK |
| Northern Mariana Islands | NK | NK | NK | NK |
| Palau | NK | NK | NK | NK |
| Papua New Guinea | NK | NK | 94,500 (70,500, 328,000) | NK |
| Samoa | NK | NK | <500 (<500, <500) | NK |
| Solomon Islands | NK | NK | NK | NK |
| Tonga | NK | NK | NK | NK |
| Tuvalu | -- | -- | NK | -- |
| Vanuatu | NK | NK | NK | NK |
| Australasia | ||||
| Australia | 40.1 (36.9,43.5) | 37,500 (27,500, 48,500) | 230,000 (178,000, 244,000) | 16.2 (11.1,23.2) |
| New Zealand | 53.9 (46.8,61.1) | 12,000 (8,000, 16,500) | 48,500 (30,000, 62,500) | 25.0 (14.7,42.9) |
| Sub Saharan Africa | ||||
| Angola | NK | NK | NK | NK |
| Benin | NK | NK | NK | NK |
| Botswana | -- | -- | NK | -- |
| Burkina Faso | NK | NK | 247,000 (189,000, 256,000) | NK |
| Burundi | NK | NK | 120,000 (93,000, 459,000) | NK |
| Cameroon | NK | NK | 164,000 (117,000, 184,000) | NK |
| Cape Verde | NK | NK | NK | NK |
| Central African Republic | -- | -- | 15,500 (11,000, 17,500) | -- |
| Chad | NK | NK | 162,000 (111,000, 184,000) | NK |
| Comoros | -- | -- | NK | -- |
| Congo (Kinshasa) | NK | NK | NK | NK |
| Cote d’Ivoire | 1.3 (0.0,7.1) | <500 (<500, <500) | NK | NG |
| Djibouti | NK | NK | NK | NK |
| Equatorial Guinea | -- | -- | NK | -- |
| Eritrea | -- | -- | NK | -- |
| Ethiopia | NK | NK | 647,000 (410,000, 726,000) | NK |
| Gabon | NK | NK | 124,000 (90,000, 129,000) | NK |
| Gambia | NK | NK | 17,000 (10,000, 27,000) | NK |
| Ghana | 30.1 (25.8,34.4) | NK | 399,000 (305,000, 944,000) | NK |
| Guinea | NK | NK | NK | NK |
| Guinea-Bissau | -- | -- | NK | -- |
| Kenya | 12.3 (7.4,17.7) | 4,000 (1,000, 7,500) | 115,000 (42,500, 126,000) | 3.3 (0.7,5.2) |
| Lesotho | -- | -- | NK | -- |
| Liberia | NK | NK | NK | NK |
| Madagascar | 4.2 (1.8,7.0) | 500 (<500, 3,000) | 56,000 (39,000, 81,000) | 1.2 (0.0,5.1) |
| Malawi | NK | NK | NK | NK |
| Mali | NK | NK | NK | NK |
| Mauritania | -- | -- | NK | -- |
| Mauritius | 72.8 (68.8,76.7) | 5,000 (1,500, 9,500) | NK | NG |
| Mozambique | 50.3 (46.2,54.4) | 14,500 (<500, 31,000) | NK | NG |
| Namibia | -- | -- | NK | -- |
| Niger | NK | NK | NK | NK |
| Nigeria | 4.3 (2.1,6.8) | NK | 2,553,000 (1,902,000, 2,651,000) | NK |
| Rep. of the Congo | -- | -- | NK | -- |
| Rwanda | NK | NK | NK | NK |
| Sao Tome & Principe | -- | -- | NK | -- |
| Senegal | 29.5 (22.9,36.3) | NK | NK | NK |
| Seychelles | 31.5 (27.2,36.0) | 500 (500, 500) | NK | NG |
| Sierra Leone | NK | NK | NK | NK |
| Somalia | NK | NK | NK | NK |
| South Africa | NK | NK | 356,000 (227,000, 441,000) | NK |
| Swaziland | NK | NK | NK | NK |
| Togo | NK | NK | NK | NK |
| Uganda | NK | NK | NK | NK |
| United Rep. of Tanzania | 20.8 (16.4,25.4) | 71,500 (41,000, 108,000) | NK | NG |
| Zambia | NK | NK | NK | NK |
| Zimbabwe | NK | NK | NK | NK |
| Middle East & North Africa | ||||
| Algeria | NK | NK | 388,000 (140,000, 674,000) | NK |
| Bahrain | NK | NK | 17,000 (11,000, 17,500) | NK |
| Cyprus | 37.3 (32.9,41.8) | <500 (<500, <500) | NK | NG |
| Egypt | 37.1 (26.7,47.5) | NK | 5,625,000 (4,007,000, 6,044,000) | NK |
| Iraq | NK | NK | 85,500 (60,500, 96,500) | NK |
| Israel | 34.0 (28.3,39.9) | NK | 100,000 (60,000, 103,000) | NK |
| Jordan | NK | NK | 24,500 (10,500, 29,000) | NK |
| Kuwait | NK | NK | NK | NK |
| Lebanon | 17.6 (10.5,25.2) | NK | 7,500 (3,000, 18,000) | NK |
| Libyan Arab Jamahiriya | 70.9 (66.4,75.2) | 1,500 (500, 2,000) | 41,500 (32,000, 43,000) | 3.3 (1.7,5.5) |
| Morocco | 40.4 (25.4,55.8) | 12,500 (5,500, 21,000) | 263,000 (190,000, 328,000) | 4.7 (1.9,8.5) |
| Occ. Palestinian Terr. | 31.2 (26.3,36.2) | NK | NK | NK |
| Oman | NK | NK | 15,500 (12,000, 17,500) | NK |
| Qatar | NK | NK | 37,500 (29,500, 40,000) | NK |
| Saudi Arabia | 58.3 (53.7,63.0) | NK | 106,000 (78,500, 190,000) | NK |
| South Sudan | -- | -- | NK | -- |
| Sudan | NK | NK | NK | NK |
| Syrian Arab Rep. | 2.5 (0.9,4.3) | NK | 554,000 (245,000, 653,000) | NK |
| Tunisia | 21.8 (19.0,24.7) | NK | 108,000 (25,000, 123,000) | NK |
| Turkey | 33.7 (30.7,36.7) | NK | 492,000 (271,000, 763,000) | NK |
| United Arab Emirates | NK | NK | 131,000 (50,000, 159,000) | NK |
| Yemen | NK | NK | 211,000 (143,000, 258,000) | NK |
Notes:
-- Indicates no evidence located that injecting drug use was occurring in this country.
NK Indicates no estimate of prevalence of that HCV was located, yet evidence of injecting drug use occurring in that country was identified.
NR indicates that uncertainty was not estimated around the estimate.
NG Indicates that no estimate of HCV amongst the general population was available.
Italic font indicates that those uncertainty intervals were estimated in this review.
PWID – people who inject drugs; HCV – Hepatitis C virus; UI - uncertainty interval (see methods for details of estimation).
At the regional level, HCV viraemic prevalence among people with recent injecting drug use varied from 16.3% (UI 12.7–20.1) in Sub-Saharan Africa to 48.6% (UI 42.0–55.2) in Eastern Europe (Table 2). The largest estimated numbers of people with recent injecting drug use living with HCV infection were in East and Southeast Asia (1.5 million, UI 1.0–2.1), Eastern Europe (1.5 million, UI 0.7–2.4), and North America (1.0 million, UI 0.4–1.7). The proportion of people with recent injecting drug use among all people living with HCV infection ranged from 1.5% (UI 0.7–2.4) in the Middle East and North Africa to 30.5% (UI 11.7–56.7) in North America (Table 2). Regions with people with recent injecting drug use comprising >10% of all people living with HCV infection included Latin America (22.0%, UI 15.3–30.4), Eastern Europe (17.9%, UI 8.2–30.9), Australasia (17.7%, UI 12.1–25.2), Caribbean (16.7%, 8.9–30.6), and Western Europe (17.2%, UI 9.9–30.4).
At the country-level, there was very marked variation in the estimates of HCV viraemic prevalence between countries, ranging from 0.5% (UI 0.0–1.4; Maldives) to 72.8% (UI 68.8–76.7; Mauritius) [Figure 1 and Table 3]. The HCV viraemic prevalence was 60–80% in 10 countries, 40-<60% in 38 countries, and <40% in 50 countries. The largest populations of people with recent injecting drug use living with HCV infection were in Russia (969,500; UI 463,000–1,570,500), the United States (895,000; UI 353,500–1,601,500), China (828,000; UI 493,000, 1,228,500), and Brazil (461,000, UI 336,500–596,500) [Figure 2 and Table 3]; together, these countries accounted for 51% of people with recent injecting drug use living with HCV infection. The top 25 countries accounting for 82% of all people with recent injecting drug use living with HCV infection globally are shown in Figure 3. The proportion of people with recent injecting drug use among all people living with HCV infection varied between 0.9% (UI 0.4–3.0; India) and 46.6% (UI 22.1–100.0; Commonwealth of Puerto Rico) [Figure 4 and Table 3]. The proportion of people with recent injecting drug use among all people living with HCV infection was <10% in 21 countries, ≥10-<20% in 11 countries, and ≥20% in 23 countries.
Figure 1.

Estimated prevalence of HCV viraemic infection among people with recent injecting drug use, by country
Figure 2.

Estimated number of people with recent injecting drug use living with HCV viraemic infection, by country
Figure 3. Countries with the greatest total number of people with HCV viraemic infection among people with recent injecting drug use globally.
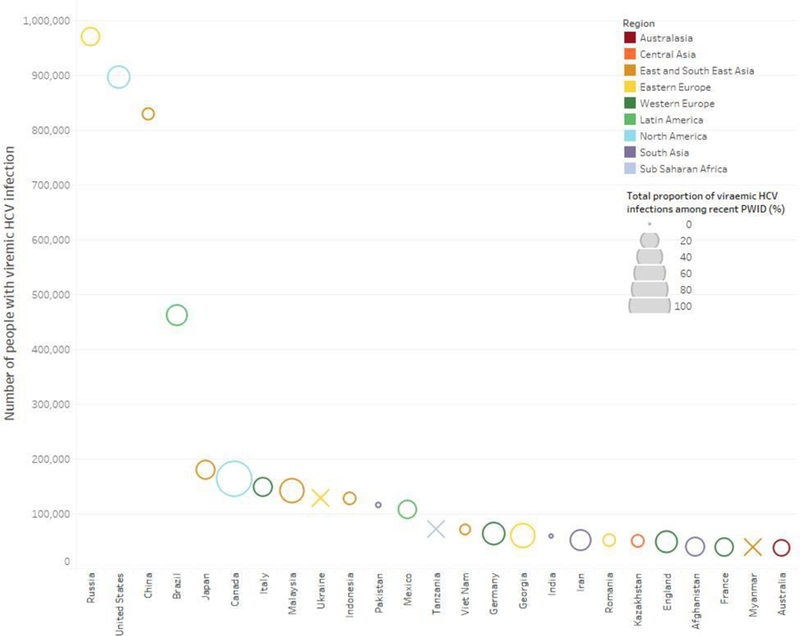
The size of the bubble represents the total proportion of hepatitis C viraemic infections that among people with recent injecting drug use. An X indicates that data were not available to calculate the total proportion of viraemic HCV infections among people with recent injecting drug use.
Figure 4.

Estimated proportion of people with recent injecting drug use among the total population with HCV viraemic infection, by country
DISCUSSION
This study estimated that there are 6.1 million (UI 3.4–9.2) people with recent injecting drug use living with HCV infection worldwide, comprising 8.5% (UI 4.6–13.1) of all HCV infections globally. There was considerable variation in the prevalence of HCV infection among people with recent injecting drug use at regional and country-levels, and in the proportion of all HCV infection that is among people with recent injecting drug use. These findings highlight countries and regions where a focus on HCV prevention and treatment among people with recent injecting drug use will be required, if HCV elimination targets are to be met.
The greatest numbers of people with recent injecting drug use living with HCV infection are in Eastern Europe, East and Southeast Asia, and North America. Half of all people with recent injecting drug use living with HCV infection are from just four countries: the Russian Federation, the United States, China, and Brazil. Further, the top 25 countries account for 82% of all people with recent injecting drug use living with HCV infection globally. Although PWID are a critical population for HCV elimination in many settings, concerted efforts to increase access to prevention and treatment for people with recent injecting drug use in these countries will be pivotal to the success of global HCV elimination efforts. Key among these will be harm reduction measures to prevent incident infections (13), and increased testing, linkage to care and uptake of directly-acting antiviral therapy among people with recent injecting drug use (14, 15).
Countries or territories where it is estimated that at least one-third of people living with HCV infection are people with recent injecting drug use include Georgia, Austria, Finland, Malaysia, and Puerto Rico. In a further 16 countries, at least one-quarter of people living with HCV infection are people with recent injecting drug use. However, there are also 21 countries where the proportion of people living with HCV are people with recent injecting drug use is <10%. Collectively, these data highlight the variation in the proportion of overall viraemic HCV infection occurring among people with recent injecting drug use globally, reflecting the differing epidemiology of HCV in different settings. As such, different types of prevention, testing, and treatment strategies will be needed to address HCV elimination targets according to the epidemiology within a given country. It should also be noted that there were 124 countries and territories where injecting drug use is known to occur, but no data were available to assess the proportion of people with HCV infection who are people with recent injecting drug use.
This study was limited to estimates among people with recent injecting drug use and will not include those who have even ‘temporarily’ or permanently ceased injecting. As such, this study underestimates the proportion of infections that occur among people who inject drugs within an overall epidemic, given that some infections due to injecting drug use will be among people with a history of injecting who have ceased injecting. It is critical to consider people who have recently injected drugs as well as those who have ceased injecting in the design of strategies to address HCV.
There are several limitations to this study. The search may have missed some literature (particularly grey literature), despite our wide scope of online searchers and requests for information from people across many countries. To address this possibility, we liaised with the WHO, Global Fund, UNODC and UNAIDS staff to contact experts within countries and obtain reports that were not available online. However, we doubt that any missed papers will alter these findings in a meaningful fashion.
Errors may have been made in data extraction and interpretation. To reduce such errors, all sources and data from which the final estimates were derived were double-checked by at least two reviewers prior to inclusion with a further round prior to finalisation with a third reviewer. We have online interactive presentations of these data at [URL to be provided] to ensure full transparency and to increase the potential for people to interact with the estimates and results, and suggest additional data sources. We encourage feedback at global.reviews@unsw.edu.au.
Although the review team searched for publications in multiple languages, we may have missed documents in languages in which we are not fluent. Those with access to data or papers/reports in other languages should contact us. It is also important to acknowledge a number of features of our approach to synthesis and imputation of estimates, driven by the gaps in data available. Although there has been a clear increase in efforts to quantify the extent of IDU and HCV among PWID, there are still major gaps in data in some regions. A hierarchical grading system was used to evaluate estimates based on geographical generalisability (e.g., from multiple sites) and across various populations of PWID (e.g., treatment and non-treatment samples). Exclusion of estimates based on a study’s methodology grade was only applied to estimates of IDU and anti-HCV prevalence. Nonetheless, our recent approach, which involved pooling estimates, and our more sophisticated approach to estimating uncertainty around all our estimates, including our method of estimating uncertainty around imputed estimates, are both improvements upon previous reviews.
A limitation is the lack of country-level data to estimate the viraemic HCV prevalence (98 countries), numbers of people living with HCV (76 countries) and the proportion among the overall population living with HCV among people with recent injecting drug use (55 countries). Data were sparse in regions such as the Caribbean, Latin America, Pacific Island States & Territories, Sub Saharan Africa, and the Middle East and North Africa. The estimates for these regions should be interpreted with caution and highlights that further work is needed to improve estimates in countries from these regions.
In this study, data on HCV antibody prevalence [multiplied by an estimate of the proportion of people with HCV antibodies who would have active viraemia, 0.75 (95% CI, 0.71, 0.79)] was used to estimate the viraemic HCV prevalence, instead of actual data on HCV RNA prevalence. We opted for this approach because the data on HCV antibody prevalence was of higher quality and coverage, and there were few countries for which any data were available for HCV RNA (Table 1). Instead, we used data on the estimated viraemic prevalence from a well-defined series of nine prospective cohorts of acute HCV infection among people who inject drugs with well-characterized events of spontaneous clearance (9). Although this provides a very accurate estimate of the proportion who progress to viraemic infection, the limitation is that this approach may have either over-estimated or under-estimated the true prevalence of viraemic infection in people with recent injecting drug use in various settings. In some regions, increased reinfection risk and/or higher HIV prevalence may result in a higher viraemic prevalence and our approach may have underestimated the viraemic prevalence (16). Conversely, it is known that some factors (e.g. female sex) increase spontaneous clearance and can reduce the viraemic prevalence, which might have overestimated the viraemic prevalence observed. Also, these analyses did not take into consideration clearance due to HCV treatment, which might have led to an overestimation of the prevalence and numbers of people with recent injecting drug use living with HCV infection. However, this is also unlikely to have affected these estimates as uptake of HCV treatment among PWID was very low prior to 2015 (17–21). This study clearly demonstrates the need to integrate HCV RNA testing into future studies of HCV among people with recent injecting drug use to enable the evaluation of viraemic HCV RNA prevalence to improve national, regional and global estimates, particularly given that larger numbers of PWID are initiating HCV treatment (and will be anti-HCV positive, but HCV RNA negative).
Denominator data are also subject to limitations. General population data may be in error for some countries where accurate census data are lacking. Population sizes of people with recent injecting drug use were based on the best available empirical estimates for each country, but there is often considerable uncertainty around estimates of this population, which translates to uncertainty in estimates of the number of PWID with HCV infection and the proportion of HCV infections occurring among people with recent injecting drug use. Estimates of HCV viraemia in people with recent injecting drug use incorporated the uncertainties in the IDU population size, anti-HCV prevalence estimate, and viraemia multiplier. However, estimates of the prevalence of recent IDU and of HCV prevalence both in people with recent injecting drug use and in the general population are subject to biases, which may be responsible for some estimates that do not seem correct. Further, the extracted data was often from a single year and changes in injecting drug user populations and HCV incidence could not be measured. This highlights the importance of continuing to improve country-level estimates of people with recent injecting drug use and those with viraemic HCV infection.
Irrespective of these limitations, this review advances our understanding of HCV prevalence and disease burden among people with recent injecting drug use. Accurate estimates of the prevalence and burden of viraemic HCV infection among people with recent injecting drug use are crucial to guide policy and practice and guide the development of strategies to enhance testing, linkage to care and treatment in this population. This review highlights that concerted efforts will be required in countries with large numbers of people infected with HCV to achieve global HCV elimination among PWID. Further, it highlights that strategies to achieve a reduction in HCV burden will need to be tailored to the individual country, based on the HCV epidemiology and the proportion of overall infections occurring in people with recent injecting drug use. Collectively, these data will inform mathematical modelling to identify strategies to increase diagnosis, treatment and reduce the number of new infections to achieve HCV elimination at a country level. Further work is needed to better understand the population size of people with a history of injecting drug use and the prevalence of viraemic HCV infection and burden in those with former, but not recent, injecting drug use.
Acknowledgments
The Australian National Drug and Alcohol Research Centre, UNSW Sydney, provided some funding towards the costs of this systematic review. LD and RPM are supported by Australian National Health and Medical Research Council (NHMRC) Principal Research Fellowships. SL is supported by an NHMRC Career Development Fellowship. AP is supported by an NHMRC Early Career Fellowship. JL acknowledges funding from the Bill & Melinda Gates Foundation. The Kirby Institute is funded by the Australian Government Department of Health and Ageing. The views expressed in this publication do not necessarily represent the position of the Australian Government. JG is supported by an NHMRC Career Development Fellowship. CD is supported by an NHMRC Practitioner Fellowship. JS acknowledges funding from a PhD scholarship from the Engineering and Physical Sciences Research Council (EPSRC). EBC acknowledges funding from Canadian Network on Hepatitis C (CanHepC). AT has received PhD funding from the National Institute for Health Research (NIHR). MH and PV acknowledge support from NIHR Health Protection Research Unit (HPRU) in Evaluation of Interventions at University of Bristol. PV acknowledges support from the NIHR HPRU in Blood Borne and Sexually Transmitted Infections at University College London and National Institute for Drug Abuse (grant number R01 DA037773–01A1). We thank the research assistants who assisted with searches for and extraction of data from the eligible papers in this review: Erin Yong, Gabrielle Gibson, Griselda Buckland, Harriet Townsend, Julia Stadum and Laura Sergeant (NDARC, UNSW), and Diana Sergiienko (Ukrainian Institute of Public Health Policy). We also thank Mary Kumvaj, the librarian who provided specialist advice on our search strategy and search strings for the peer-reviewed literature searches. Finally, we thank the individuals who provided encouragement and support in various ways throughout the conduct of this study, including circulating requests for data, provision of in-country contacts and assistance with locating data: Annette Verster (WHO), Daniel Wolfe (Open Society Foundations), Andre Noor (EMCDDA), Eleni Kalamara (EMCDDA), Mauro Guarinieri (Global Fund), Christoforos Mallouris (UNAIDS), Susie McLean, Catherine Cook (Harm Reduction International [HRI]), Maria Phelan (HRI), Katie Stone (HRI), Riku Lehtovuori (UNODC), Keith Sabin (UNAIDS), Jinkou Zhao (Global Fund), Vladimir Poznyak (WHO), and Gilberto Gerra (UNODC). Assistance in sourcing and verifying data was provided by many individuals from government, non-government, and research organisations around the world, for which we are thankful. These individuals are listed in the appendix (p 154).
Funding: National Drug and Alcohol Research Centre, UNSW Sydney; Australian National Health and Medical Research Council; John C Martin Foundation.
Declaration of interests
JG is a consultant/advisor and has received research grants from AbbVie, Bristol-Myers Squibb, Cepheid, Gilead Sciences and Merck/MSD. GD is a consultant/advisor and has received research grants from Abbvie, Abbot Diagnostics, Bristol Myers Squibb, Cepheid, Gilead, GlaxoSmithKline, Merck, Janssen and Roche. Sarah Blach and Homie Razavi have not received any remuneration. The CDA Foundation and the Polaris Observatory has not received any funding from commercial organizations. JS reports non-financial support from Gilead Sciences. In the past 3 years, LD has received investigator-initiated untied educational grants for studies of opioid medications in Australia from Indivior, Mundipharma, and Seqirus. SL has received investigator-initiated untied educational grants from Indivior. AP has received investigator-initiated untied educational grants from Mundipharma and Seqirus. EBC received PhD funding from the Canadian Network on Hepatitis C. MH reports personal fees from Gilead, Abbvie, and MSD.
REFERENCES
- 1.WHO. Global Hepatitis Report 2017 . In: Organization W. H., editor, Geneva: World Health Organization; 2017. [Google Scholar]
- 2.Nelson PK, Mathers BM, Cowie B, Hagan H, Des Jarlais D, Horyniak D et al. Global epidemiology of hepatitis B and hepatitis C in people who inject drugs: results of systematic reviews, Lancet 2011: 378: 571–583. [DOI] [PMC free article] [PubMed] [Google Scholar]
- 3.Morris MD, Shiboski S, Bruneau J, Hahn JA, Hellard M, Prins M et al. Geographic Differences in Temporal Incidence Trends of Hepatitis C Virus Infection Among People Who Inject Drugs: The InC3 Collaboration, Clinical infectious diseases : an official publication of the Infectious Diseases Society of America 2017: 64: 860–869. [DOI] [PMC free article] [PubMed] [Google Scholar]
- 4.Wiessing L, Ferri M, Grady B, Kantzanou M, Sperle I, Cullen KJ et al. Hepatitis C virus infection epidemiology among people who inject drugs in Europe: a systematic review of data for scaling up treatment and prevention, PloS one 2014: 9: e103345. [DOI] [PMC free article] [PubMed] [Google Scholar]
- 5.Hagan H, Pouget ER, Des Jarlais DC, Lelutiu-Weinberger C Meta-regression of hepatitis C virus infection in relation to time since onset of illicit drug injection: the influence of time and place, American journal of epidemiology 2008: 168: 1099–1109. [DOI] [PMC free article] [PubMed] [Google Scholar]
- 6.Page K, Morris MD, Hahn JA, Maher L, Prins M Injection drug use and hepatitis C virus infection in young adult injectors: using evidence to inform comprehensive prevention, Clinical infectious diseases : an official publication of the Infectious Diseases Society of America 2013: 57 Suppl 2: S32–38. [DOI] [PMC free article] [PubMed] [Google Scholar]
- 7.Degenhardt L, Peacock A, Colledge S, Leung J, Grebely J, Vickerman P et al. Global prevalence of injecting drug use and sociodemographic characteristics and prevalence of HIV, HBV, and HCV in people who inject drugs: a multistage systematic review, Lancet Global Health 2017: 5: e1192–e1207. [DOI] [PMC free article] [PubMed] [Google Scholar]
- 8.The Polaris Observatory HCV Collaborators. Global prevalence and genotype distribution of hepatitis C virus infection in 2015: a modelling study, Lancet Gastro Hepatol 2017: 2: 161–176. [DOI] [PubMed] [Google Scholar]
- 9.Grebely J, Page K, Sacks-Davis R, van der Loeff MS, Rice TM, Bruneau J et al. The effects of female sex, viral genotype, and IL28B genotype on spontaneous clearance of acute hepatitis C virus infection, Hepatology 2014: 59: 109–120. [DOI] [PMC free article] [PubMed] [Google Scholar]
- 10.Degenhardt L, Peacock A, Colledge S, Leung J, Grebely J, Vickerman P et al. Global prevalence of injecting drug use and sociodemographic characteristics and prevalence of HIV, HBV, and HCV in people who inject drugs: a multistage systematic review, Lancet Global Health 2017: In Press. [DOI] [PMC free article] [PubMed] [Google Scholar]
- 11.Mathers BM, Degenhardt L, Phillips B, Wiessing L, Hickman M, Strathdee SA et al. Global epidemiology of injecting drug use and HIV among people who inject drugs: a systematic review, Lancet 2008: 372: 1733–1745. [DOI] [PubMed] [Google Scholar]
- 12.Nelson PK, Mathers BM, Cowie B, Hagan H, Des Jarlais D, Horyniak D et al. Global epidemiology of hepatitis B and hepatitis C in people who inject drugs: results of systematic reviews, Lancet 2011: 378: 571–583. [DOI] [PMC free article] [PubMed] [Google Scholar]
- 13.Platt L, Minozzi S, Reed J, Vickerman P, Hagan H, French C et al. Needle and syringe programmes and opioid substitution therapy for preventing HCV transmission among people who inject drugs: findings from a Cochrane Review and meta-analysis, Addiction 2017. [DOI] [PMC free article] [PubMed] [Google Scholar]
- 14.Bajis S, Dore GJ, Hajarizadeh B, Cunningham EB, Maher L, Grebely J Interventions to enhance testing, linkage to care and treatment uptake for hepatitis C virus infection among people who inject drugs: A systematic review, The International journal on drug policy: In Press [DOI] [PubMed] [Google Scholar]
- 15.Grebely J, Dore GJ, Morin S, Rockstroh JK, Klein MB Elimination of HCV as a public health concern among people who inject drugs by 2030 - What will it take to get there?, J Int AIDS Soc 2017: 20: 22146. [DOI] [PMC free article] [PubMed] [Google Scholar]
- 16.Smith DJ, Jordan AE, Frank M, Hagan H Spontaneous viral clearance of hepatitis C virus (HCV) infection among people who inject drugs (PWID) and HIV-positive men who have sex with men (HIV+ MSM): a systematic review and meta-analysis, BMC infectious diseases 2016: 16: 471. [DOI] [PMC free article] [PubMed] [Google Scholar]
- 17.Alavi M, Raffa JD, Deans GD, Lai C, Krajden M, Dore GJ et al. Continued low uptake of treatment for hepatitis C virus infection in a large community-based cohort of inner city residents, Liver international : official journal of the International Association for the Study of the Liver 2014: 34: 1198–1206. [DOI] [PubMed] [Google Scholar]
- 18.Iversen J, Grebely J, Topp L, Wand H, Dore G, Maher L Uptake of hepatitis C treatment among people who inject drugs attending Needle and Syringe Programs in Australia, 1999–2011, Journal of viral hepatitis 2014: 21: 198–207. [DOI] [PubMed] [Google Scholar]
- 19.Mehta SH, Genberg BL, Astemborski J, Kavasery R, Kirk GD, Vlahov D et al. Limited uptake of hepatitis C treatment among injection drug users, J Community Health 2008: 33: 126–133. [DOI] [PMC free article] [PubMed] [Google Scholar]
- 20.Grebely J, Raffa JD, Lai C, Krajden M, Kerr T, Fischer B et al. Low uptake of treatment for hepatitis C virus infection in a large community-based study of inner city residents, Journal of viral hepatitis 2009: 16: 352–358. [DOI] [PubMed] [Google Scholar]
- 21.Strathdee SA, Latka M, Campbell J, O’Driscoll PT, Golub ET, Kapadia F et al. Factors associated with interest in initiating treatment for hepatitis C Virus (HCV) infection among young HCV-infected injection drug users, Clin Infect Dis 2005: 40 Suppl 5: S304–312. [DOI] [PMC free article] [PubMed] [Google Scholar]