Abstract
Fast-magic-angle-spinning solid-state NMR is a developing technique for determination of protein structure and dynamics. Proton-proton correlations usually lead to rough distance restraints, a serious hurdle towards high-resolution structures. Analogous to the “eNOE” concept in solution, an integrative approach for more accurate restraints enables improved structural accuracy with minimal analytical effort.
Graphical abstract
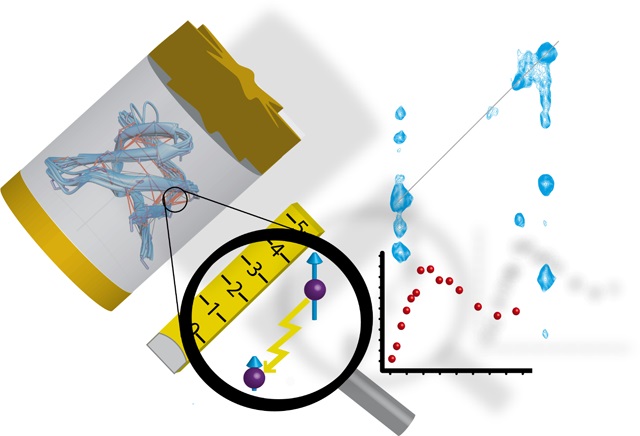
With the integrative “eRFDR” approach, turning qualitative into exact distance restraints, high-resolution protein structures are obtained by fast-magic-angle-spinning solid-state NMR.
In the past decades, magic-angle-spinning (MAS) solid-state NMR spectroscopy has made fast progress regarding determination of structure and dynamics of insoluble proteins or large protein complexes.1,2 Recently, proton-detected solid-state NMR on perdeuterated and proton back-exchanged or even fully protonated samples has enabled solid-state NMR structures based on miniscule sample amounts.3,4 Till-date, homonuclear magnetization transfer has represented the most important tool for structure determination generally.5–7 In case of proton detection, sensitive 1H-1H through-space correlations are obtained via mixing like RFDR8 or DREAM9, yielding proton-proton inter-nuclear distance restraints like in solution NMR spectroscopy.10–13 Similarly as in both solution and conventional solid-state NMR, polarization is transferred among the interacting spins through space, with the efficacy of the transfer being modulated by the inter-nuclear distance. Commonly, the amount of transferred magnetization is read out from cross peak intensities or volumes at one particular mixing time and translated into qualitative restraints (distance ranges). This approach leads to rough estimation of distances and is hampered by various errors. The accuracy is compromised by site-specific relaxation, differential transfer efficiency during CP steps, and offset-dependent pulse imperfections for each of the involved nuclei. Additionally, magnetization is transferred in substantial amounts via third spins in terms of spin diffusion (or relay transfers). In conventional solid-state NMR, time-resolved analysis of dephasing curves upon recoupling of isolated spin pairs has been a more accurate alternative.14,15 In solution NMR, determination of the time-resolved magnetization buildup upon compensation of artifacts has been used for more accurate distance restraints.16 We wondered if proton-detected solid-state NMR structure elucidation could benefit from similar concepts.
Figure 1 depicts the buildup of such a homonuclear proton-proton correlation, as obtained via a series of 3D 15N-edited RFDR spectra (H-RFDR-hNH)10,11 from a deuterated 15N, 13C-labeled sample of chicken α-spectrin SH3 domain, micro-crystallized in 100 % H2O and spun at 55.5 kHz at 700 MHz proton Larmor frequency (see below for more details).
Figure 1.
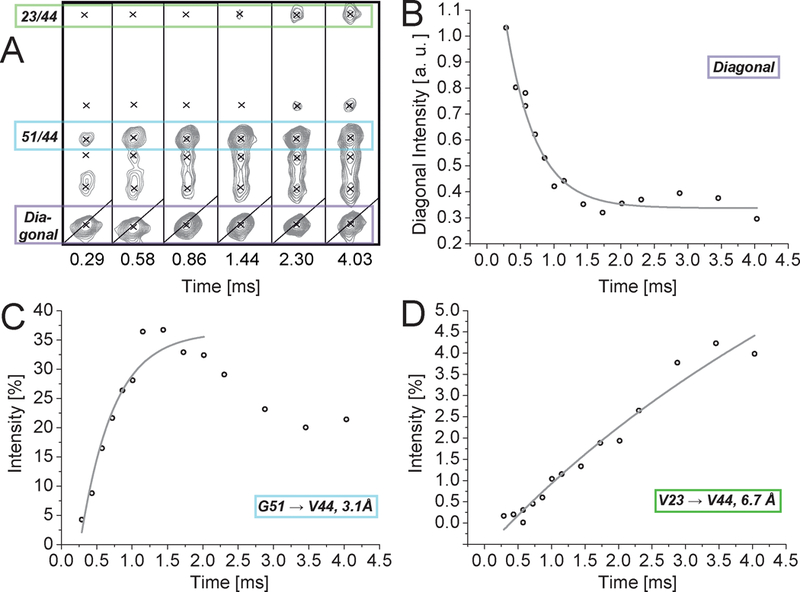
Experimental RFDR buildup in a micro-crystalline sample of chicken α-spectrin SH3 domain. (A) Strips from 15N-edited RFDR spectra (H-RFDR-hNH) recorded at different mixing times. The peaks highlighted in green and blue correspond to G51 (3.1 Å) and V23 (6.7 Å) amide magnetization, respectively, transferred to the amide of V44. (B) Diagonal decay of the amide proton magnetization of V44. (C) and (D) Cross-peak intensity (relative to the diagonal peak intensity at zero mixing time) of cross peaks 51→44 and 23→44, respectively, as a function of mixing time. (Data recorded on perdeuterated protein at 55 kHz MAS.)
The time-resolved experimental intensities reflect the expected dependence of the buildup rates on internuclear distances. Even for rate-based restraints, still, the above-mentioned sources of errors have to be addressed in order to turn qualitative through-space correlations into accurate distance restraints. Taking the eNOE framework developed by Vögeli and Riek for solution NMR NOEs16 as a template, this can be achieved as described in the following (see Flowchart of data processing in Figure 2): i) The differential polarization transfer efficiency during the heteronuclear correlation part of the experiment is compensated for by normalizing the cross-peak intensities by the corresponding extrapolated diagonal-peak intensities at zero mixing time, using a mono-exponential fit. ii) Site-specific magnetization loss during mixing is compensated by taking the diagonal-decay rate as a fixed parameter correcting the corresponding cross-peak buildup. iii) The normalized intensities are then corrected for indirect polarization transfer mediated by nearby spins (relay transfers). The correction factors for each cross-peak intensity can be estimated by simulations using a transfer matrix (eq. S7). The correction factor represents the ratio of the simulated two-spin buildup and the sum of all simulations, taking third spins into account (eqs. S4.1 and S4.2). The matrix contains decay rates as diagonal and buildup rates as off-diagonal elements. Buildup rates are simulated using the structural model and decay rates are taken from the diagonal peaks if available. This has been described in detail for eNOEs17. iv) In case cross peaks from both transfers are available, the average of the build-up rate of cross-peak Hj → Hi and Hi → Hj is taken and converted into a “bidirectional” distance restraint. (This yields improved reliability over the uni-directional restraint, also compare Figure 4A). In terms of correction for relayed magnetization transfer an initial (approximate) structural model has to be provided, which can be generated from the data by using uncorrected restraints. The resulting restraints should now bear high accuracy, and a structure with improved resolution can be calculated.
Figure 2.
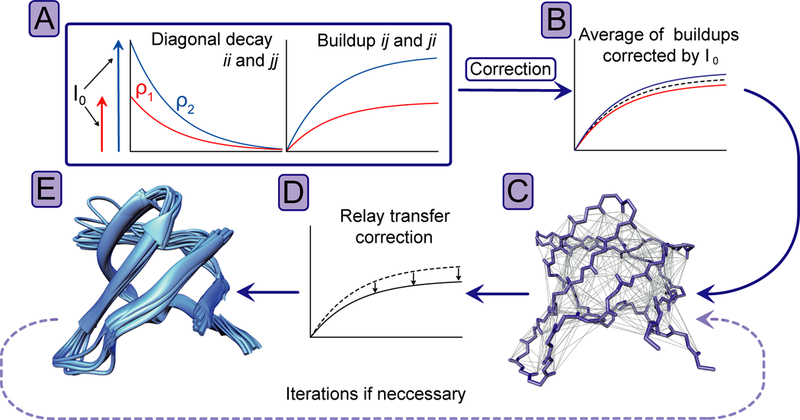
Processing flowchart. (A) Schematic representation of diagonal decays (left) and cross-peak buildups (right), where I0 stands for the extrapolated intensity at zero mixing-time and ρ for the diagonal-peak decay-rate. (B) Representation of buildups corrected by I0. (C) All internuclear contacts within 8 Å depicted on the backbone of SH3. (D) Correction for relayed magnetization transfer via third spins using a transfer matrix. (E) Solid-state NMR structure ensemble generated with the distance restraints corrected for relayed magnetization transfer. For further iterative refinement, the improved average structure can be again used for correction of relayed magnetization transfer, resulting in improved restraints for structure calculation.
Such analysis has similarly been implemented in an automated manner for solution state NMR in the freely available (and editable) MATLAB-based program eNORA218. We wondered whether the routines for artefact compensation of the eNOE-approach can be applied as such for solid-state NMR, despite the obvious differences in physical and technical details as to how the magnetization transfer is achieved (see transfer-theoretical details in the supporting information). E. g., the NOE is two to three orders of magnitude slower and void of pulses (and related losses) during transfer. Secondly, whereas for NOEs, zero-and double-quantum relaxation terms imply a distance-proportionality of r−6, the first-order dipolar recoupling Hamiltonian during RFDR is dependent on r−3 terms. (This also applies to any corrections for relayed magnetization transfer.) Starting from the eNORA framework, the relation between rates and distances, as well as the start parameters for fitting, need thus to be modified. Maybe most interestingly, even though the experimental diagonal and cross peaks show a seemingly exponential decay and buildup behavior on first glance, from a theoretical point of view, the complex RFDR polarization transfer rather shows a Bessel function-like behavior.19,20 At this point, such complex functions and their fitting are constitutively impractical for the automated framework in focus. In order to validate that a simple function like an mono-exponential buildup represents a good approximation to the more complicated behavior during RFDR, we performed numerical powder-averaged simulations of two-spin RFDR magnetization buildup and diagonal-decay curves as done before,21 using an in-house MATLAB-based program22 especially dedicated for finite-pulse RFDR23. (See Figure 3 and the supporting information)
Figure 3.
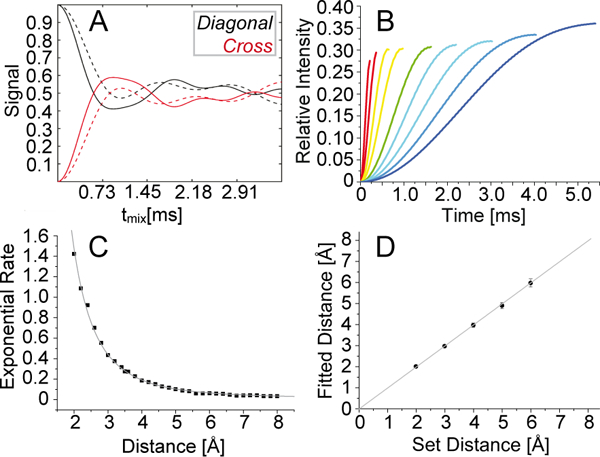
Validation of simplified fitting using two-spin simulations. (A) Simulated diagonal-peak intensity (black) and cross peak buildup (red) for a proton-proton spin pair of 3 Å distance, assuming only the first-order term (dashed line) or taking into account higher-order terms (solid line). (B) Simulated initial-regime buildups (including higher order terms) for the proton-proton distances of 2.0, 2.4, 2.8, 3.2, 3.8, 4.2, 4.6, 5.0 and 5.4 Å. (C) Depiction of extracted buildup rates as obtained for various distances by simple mono-exponential fitting of simulations (black symbols). The distance dependence of the fit parameter matches a calibrated r−3 function (gray) with a correlation coefficient R2 of 0.99. (D) Verification of the fitting procedure of eNORA2 modified for RFDR using simulated buildup and decay curves. Simulations for 2 to 6 Å were used as the “experimental” input to verify the fitting procedure. Determined distances and distances set for the simulation correlate linearly.
Successively, the simulated curves were “test-fitted” in the initial regime (buildup until the first maximum) with linear, exponential, and trigonometric functions (see Figure S7A-C). Focusing on this regime omits the oscillations at long mixing times, which are more corrupted by dipolar truncation and spin diffusion. In fact, in all cases the fit (of the slope, the exponential rate, or the inverse frequency, respectively) over distance showed a correlation with an R2 value of above 0.99. (See more details to this analysis in the supporting information). Evidently, the reason for the nearly perfect correlation of simple functions with the simulated data in the initial regime is that any errors, i. e., any dissimilarities between buildup behavior and fitting function, are similar for all buildups and therefore eliminated by analyzing relative trends. This holds true as long as the fitting is performed uniformly up to a comparable point like the first maximum.
The above simulations prove that in order to convert buildups from RFDR into distances, simple measures like exponential fitting in the initial regime are a good practical approximation. Consequently, exact distance restraints can be determined in a straightforward way using a suitably modified version of the program eNORA2. (For details of modification see the supporting information.) As a test case, the RFDR buildup data of the SH3 sample was processed within this framework, using a modified eNORA2 routine with an r−3 distance dependency (based on exponential fitting functions). For correcting for relayed magnetization transfers based on the transfer matrix approach, we used the average structure of the 10 lowest-energy structures (see Figure 4C) obtained from the standard RFDR structure elucidation protocol. The correction involved all nearby spins within spheres of 12 Å radius centered at each of the two spins of interest.
Figure 4.
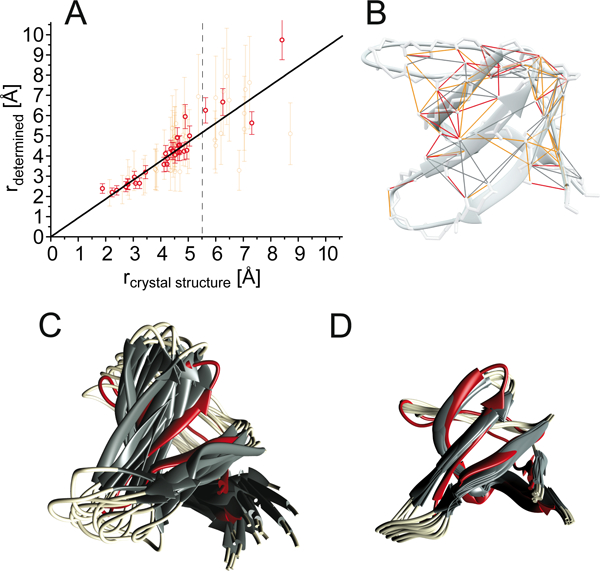
Improvement of structure determination using the eRFDR-approach. (A) Correlation between bidirectional (red) as well as unidirectional (orange) exact-RFDR restraints (depicted on the structure in Figure 4B) and the corresponding distances read out from the crystal structure (2NUZ). Distance errors are employed as described for eNORA2 previously25. The R2 value of the fit is 0.96 for distances smaller than 5.5 Å. Values for larger distances are less accurate. The deviation of the short distance HN18↔HN19 (leftmost point) is likely due to molecular dynamics in this loop26 (also compare Figure S10). (B) Depiction of the obtained eRFDR-restraints, color-coded as red (bidirectional) and orange (uni-directional). (C) Ensemble of the 10 lowest-energy structures from 300 calculated structures using 112 unambiguous conventional upper-distance restraints in addition to angular restraints. For determining the upper distance limit of conventional restraints, the restraints were grouped with respect to the ratio of cross and diagonal peak. Proton distances corresponding to large cross-peak intensity ratios were treated as close (5 Å), medium ratios as 7.5 Å, and small ratios as far (9 Å), in addition to angular restraints. (D) Structure calculation based on 47 conventional RFDR upper distance restraints (for peaks with insufficient resolution in their diagonal), 35 unidirectional eRFDR-restraints and 30 bidirectional eRFDR-restraints.
We indeed obtained distances that correlate very well with the distances read out from the corresponding crystal structures 2NUZ. The RMSD for all restraints shorter than 5.5 Å that both transfers (Hj ↔ Hi) are available for is 0.38 Å (also compare Figure 4A). Very similar results were obtained for a second, larger test case, the human carbonic anhydrase II (hCAII)24 with a molecular weight of 29 kDa. Here the obtained exact (“eRFDR”) distances show a good correlation (RMSD of 0.29 Å for bidirectional restraints shorter than 5.5 Å) with the distances read out from the crystal structure (pdb 2CBA, see Figure S9).
Generally, distances above 5.5 Å show a larger deviation, which is on one hand likely due to artifacts like dipolar truncation and non-trivial spin diffusion contributions. On the other hand, even without such effects, the uncertainty would increase due to the exponential decay of transfer efficiency as a function of distance. Interestingly, whereas the theory for a two-spin system suggests an r−3 dependence of the cross peak intensities with higher-order terms being comparably small, in praxis additional effects may come to action that are complex to grasp. As such, even though we stuck to the theoretically sound r−3 dependence for structure calculation in the following, the optimal correlation would rather be achieved using an r−5 weighting (see Figure S2). In practice, however, the accuracies for structure calculation are rather indistinguishable for the different exponents (see Figure S3).
To demonstrate the success of improved structure determination using eRFDR restraints (see Figure 4A), the determined distances were used as restraints for structure calculation. The resulting (backbone) structural ensemble (Figure 4D) was compared with an ensemble calculated using conventional RFDR restraints (see Figure 4C), determined from the spectrum with 2 ms of mixing time (for details see supporting information). The 10 minimal-energy structures were aligned (with regard to the backbone of structured regions) with the crystal structure 2NUZ. Whereas the RMSD with respect to the average backbone structure of the ensemble (precision of the structure) is 2.40 Å for the conventional distance restraints, this RMSD is decreased to 0.56 Å in the presence of eRFDRs. Similarly, the deviation from the crystal structure (accuracy of the NMR structure) is decreased from 3.48 Å to 1.69 Å. Just as for conventional structure calculation, areas with few restraints due to dynamics (the RT-loop and n-Src loop) deviate most strongly.
Structure calculation within the eNORA framework can be performed as an iterative refinement process. Any obtained structure can be used again as an improved template for constructing relay transfer corrections. In our hands, convergence is reached, however, upon using the conventional RFDR structure for relay transfer correction already, further refinement cycles did not significantly improve the structure. This is shown in Figure S11. Whether the relay transfer correction leads to improvements will depend on a decent quality of the initial structural model. As an initial structure could be insufficient in different ways, a threshold for its quality is difficult to determine. For perdeuterated proteins, we feel, however, that convergence will be reached as long as the initial structure has at least a qualitatively correct fold.
Although solid-state NMR-specific sources of error, including dipolar truncation and coherent effects cannot be completely circumvented, the eRFDR-approach leads to greatly enhanced restraint precision and, accordingly, more accurate solid-state NMR protein structures. Even though in the solid state, linewidths are unaffected by higher molecular weight, the main limiting factor is the increasing diagonal peak overlap. Diagonal peaks in 3D data bear the resolution of an H/N 2D plane. These problems can potentially be addressed by higher dimensionality (or, more laboriously, selective labeling). Also, eNORA is at this point not capable of dealing with ambiguous cross peak assignments. Finally, the eRFDR approach is more time consuming than single-point RFDR due to the need for multiple data points, of which the ones with short mixing times bear relatively low signal-to-noise ratios. In principle, the approach is equally amenable for non-crystalline samples. However, these are potentially more challenging due to larger linewidths and hence peak overlap (e. g., in fibrils) or due to lower sensitivity (e. g., in membrane protein preparations). An additional solid-state specificity are intermolecular contacts within the crystal lattice. Whereas for partly back-exchanged, crystalline samples usually an insignificant fraction of these contacts exist, both for fully protonated and for proteins with high content of interleaved structural elements (e. g., fibrils) their consideration seems advisable for any relay transfer corrections. Even though eNORA is not equipped for protein lattices yet, single-chain constructs could be created manually after each round of oligomeric structure calculation, which then suit the same purpose. In prospect of ongoing development towards faster MAS, the presented approach might be particularly valuable for fully protonated samples. Due to higher spin concentration, polarization transfer is compromised here by the effects targeted in eRFDR even more than in deuterated and amide-back-exchanged samples. Samples will yield a higher number of RFDR restraints with similar resolution of the diagonal peak (coverage of a larger spectral space). Ambiguities and truncation problems might partially be alleviated by band-selective polarization transfer.7
Here we have demonstrated acquisition of solid-state NMR proton-proton distance restraints of high accuracy. Facilitated determination of structures with atomic resolution without (fundamental) limitations regarding protein size will be valuable for structural biology and pharmaceutical sciences. In the long run, multi-state models elucidated by eRFDR instead of single average structures, representing slow motions (as demonstrated for eNOEs in solution), might complement existing dynamics methods in the solid state.
Supplementary Material
Acknowledgements
Financial support is acknowledged from the Deutsche Forschungsgemeinschaft (funds from SFB 749, TP A13, SFB 1309, TP 03, the Emmy Noether program, and the Excellence Clusters CiPS-M and RESOLV to R. L.), as well as the National Institutes of Health grants R01-GM123455 and R01-GM112845 to C. M. R.
Footnotes
Electronic Supplementary Information (ESI) available: [details of any supplementary information available should be included here]. See DOI: 10.1039/x0xx00000x
References:
- 1.Linser R, Solid state Nucl. Magn. Res., 2017, 87, 45–53. [DOI] [PubMed] [Google Scholar]
- 2.Quinn CM and Polenova T, Q Rev Biophys, 2017, 50, e1. [DOI] [PMC free article] [PubMed] [Google Scholar]
- 3.Vasa SK, Singh H, Grohe K and Linser R, Angew. Chem., Int. Ed., 2019, 58, 5758–5762. [DOI] [PubMed] [Google Scholar]
- 4.Andreas LB, Jaudzems K, Stanek J, Lalli D, Bertarello A, Le Marchand T, Cala-De Paepe D, Kotelovica S, Akopjana I, Knott B, Wegner S, Engelke F, Lesage A, Emsley L, Tars K, Herrmann T and Pintacuda G, Proc. Natl. Acad. Sci. U.S.A., 2016, 113, 9187–9192. [DOI] [PMC free article] [PubMed] [Google Scholar]
- 5.Knight MJ, Pell AJ, Bertini I, Felli IC, Gonnelli L, Pierattelli R, Herrmann T, Emsley L and Pintacuda G, Proc. Natl. Acad. Sci. U.S.A., 2012, 109, 11095–11100. [DOI] [PMC free article] [PubMed] [Google Scholar]
- 6.Agarwal V, Penzel S, Szekely K, Cadalbert R, Testori E, Oss A, Past J, Samoson A, Ernst M, Böckmann A and Meier BH, Angew. Chem., Int. Ed., 2014, 53, 12253–12256. [DOI] [PubMed] [Google Scholar]
- 7.Jain MG, Lalli D, Stanek J, Gowda C, Prakash S, Schwarzer TS, Schubeis T, Castiglione K, Andreas LB, Madhu PK, Pintacuda G and Agarwal V, J. Phys. Chem. Lett., 2017, 8, 2399–2405. [DOI] [PubMed] [Google Scholar]
- 8.Bennett AE, Ok JH, Vega S and Griffin RG, J. Chem. Phys., 1992, 96, 8624–8627. [Google Scholar]
- 9.Verel R, Ernst M and Meier BH, J. Magn. Reson., 2001, 150, 81–90. [DOI] [PubMed] [Google Scholar]
- 10.Zhou DH, Shea JJ, Nieuwkoop AJ, Franks WT, Wylie BJ, Mullen C, Sandoz D and Rienstra CM, Angew. Chem., Int. Ed., 2007, 46, 8380–8383. [DOI] [PMC free article] [PubMed] [Google Scholar]
- 11.Linser R, Bardiaux B, Higman V, Fink U and Reif B, J. Am. Chem. Soc., 2011, 133, 5905–5912. [DOI] [PubMed] [Google Scholar]
- 12.Huber M, Böckmann A, Hiller S and Meier BH, Phys. Chem. Chem. Phys., 2012, 14, 5239–5246. [DOI] [PubMed] [Google Scholar]
- 13.Linser R, Bardiaux B, Hyberts SG, Kwan AH, Morris VK, Sunde M and Wagner G, J. Am. Chem. Soc., 2014, 136, 11002–11010. [DOI] [PMC free article] [PubMed] [Google Scholar]
- 14.Gullion T and Schaefer J, J. Magn. Reson., 1989, 81, 196–200. [Google Scholar]
- 15.Ishii Y, J. Chem. Phys., 2001, 114, 8473–8483. [Google Scholar]
- 16.Vögeli B, Segawa TF, Leitz D, Sobol A, Choutko A, Trzesniak D, van Gunsteren W and Riek R, J. Am. Chem. Soc., 2009, 131, 17215–17225. [DOI] [PubMed] [Google Scholar]
- 17.Orts J, Vögeli B and Riek R, J. Chem. Theory Comput., 2012, 8, 3483–3492. [DOI] [PubMed] [Google Scholar]
- 18.Strotz D, Orts J, Chi CN, Riek R and Vögeli B, J. Chem. Theory Comput., 2017, 13, 4336–4346. [DOI] [PubMed] [Google Scholar]
- 19.Mueller KT, J. Magn. Reson., 1995, 113, 81–93. [Google Scholar]
- 20.Jaroniec CP, Filip C and Griffin RG, J. Am. Chem. Soc., 2002, 124, 10728–10742. [DOI] [PubMed] [Google Scholar]
- 21.Leskes M, Akbey Ü, Oschkinat H, van Rossum B-J and Vega S, J. Magn. Reson., 2011, 209, 207–219. [DOI] [PubMed] [Google Scholar]
- 22.Nimerovsky E and Goldbourt A, J. Magn. Reson., 2012, 225, 130–141. [DOI] [PubMed] [Google Scholar]
- 23.Zhang R, Nishiyama Y, Sun P and Ramamoorthy A, J. Magn. Reson., 2015, 252, 55–66. [DOI] [PMC free article] [PubMed] [Google Scholar]
- 24.Vasa SK, Singh H, Rovó P and Linser R, J. Phys. Chem. Lett., 2018, 9, 1307–1311. [DOI] [PubMed] [Google Scholar]
- 25.Strotz D, Orts J, Minges M and Vögeli B, J. Magn. Reson., 2015, 259, 32–46. [DOI] [PubMed] [Google Scholar]
- 26.Rovó P, Smith CA, Gauto D, de Groot BL, Schanda P and Linser R, J. Am. Chem. Soc., 2019, 141, 858–869. [DOI] [PMC free article] [PubMed] [Google Scholar]
Associated Data
This section collects any data citations, data availability statements, or supplementary materials included in this article.


