. 2019 Jul 25;8:e44838. doi: 10.7554/eLife.44838

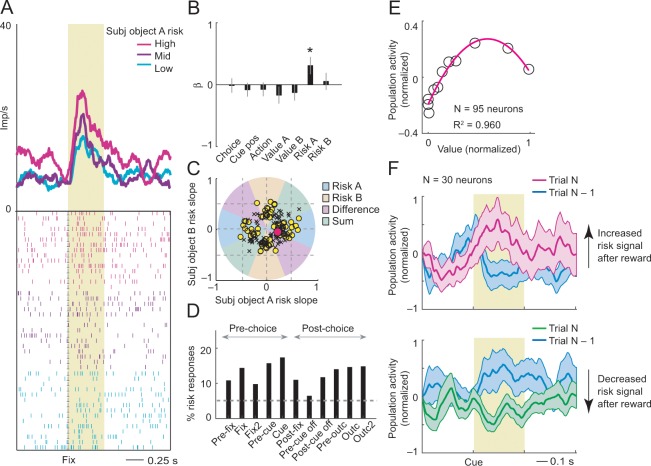
Figure 4. Subjective object-risk coding.

(A) Activity from a single DLPFC neuron coding subjective risk associated with object A before choice (fixation period). Object risk was derived from the variance of recently experienced rewards associated with a specific object. (B) Beta coefficients (standardized slopes) from a multiple linear regression of the neuron’s fixation impulse rate showed significant coding only for object-A risk (p=0.0316, t-test; all other coefficients: p>0.22). (C) Categorization of coding risk for object A or B, risk difference or risk sum based on the angle of coefficients. Red circle: position of object-A risk response of the neuron shown in A and B. (D) Percentages of object-risk responses for all task epochs (multiple regression, 1222 task-related responses from 205 neurons). (E) Population activity of object-risk neurons as a function of object value. Activity conformed to the characteristic inverted U-shaped relationship between reward-variance risk and reward probability (see Figure 1A). Error bars were smaller than symbols. (F) Neuronal risk-updating following reward. Population activity of object-risk neurons at the time of choice (cue period), shown separately for trials in which object risk on the current trial increased (top) or decreased (bottom) following reward on the previous trial. When a reward increased object risk (by increasing reward variance), cue-activity on the following trial (N, magenta) was significantly higher compared to that on the previous trial (N-1, blue; p<0.001, Wilcoxon test), reflecting the updated object risk. Conversely, when a reward decreased object risk (by decreasing reward variance), activity on the following trial (green) decreased correspondingly (p<0.001).

Figure 4—source data 1.
DOI: 10.7554/eLife.44838.019

Figure 4.

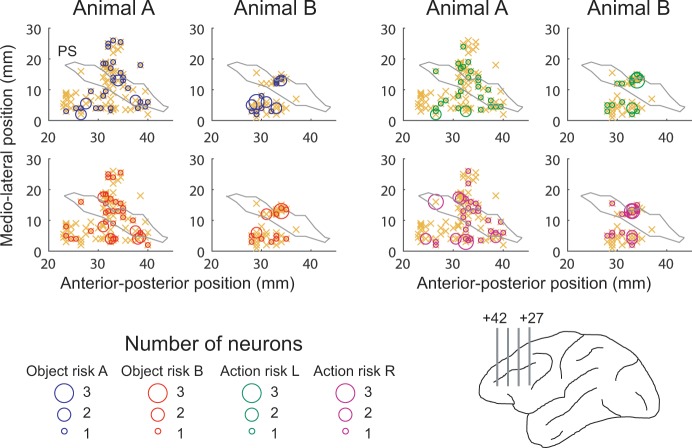
Figure 4—figure supplement 1. Anatomical location of recording sites.

Figure 4—figure supplement 1.

Anterior-posterior position was defined with respect to inter-aural line. Orange crosses indicate locations for all recorded neurons. PS, approximate position of principal sulcus. Lower right anatomical schematic outlines recording locations in upper and lower banks of principal sulcus. Numbers indicate anterior-posterior distance from inter-aural line. .
Figure 4—figure supplement 1—source data 1.
DOI: 10.7554/eLife.44838.013
Figure 4—figure supplement 2. Reward-history control.
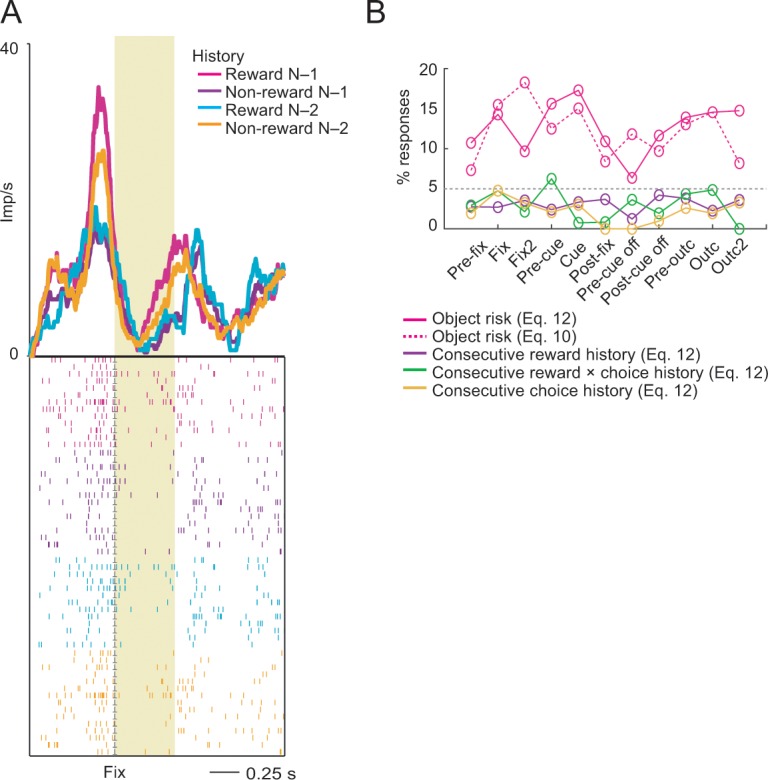
Figure 4—figure supplement 2.

(A) Activity of a single DLPFC neuron reflecting the non-linear interaction between rewards in the previous two consecutive trials. The neuron showed stronger activity in the fixation period on the current trial (N) when reward had been received on the previous trial (N-1). By contrast, current-trial activity was stronger when no reward had been received two trials ago (N-2). (B) Percentage of object-risk neurons identified in a supplementary regression (Equation 12) that included additional covariates for reward, choice and reward × choice history for the preceding two consecutive trials (N-1 and N-2). Inclusion of these control covariates had only a minor effect on the percentage of identified object-risk neurons compared to our main regression (Equation 10). Compared to robust object-risk signals across task periods (magenta), responses explicitly reflecting consecutive reward history (purple) across the two preceding trials, or consecutive reward × choice history (green) or choice history (orange) were rare, likely because these effects were better accounted for by object-value and object-risk regressors.
Figure 4—figure supplement 2—source data 1.
DOI: 10.7554/eLife.44838.015
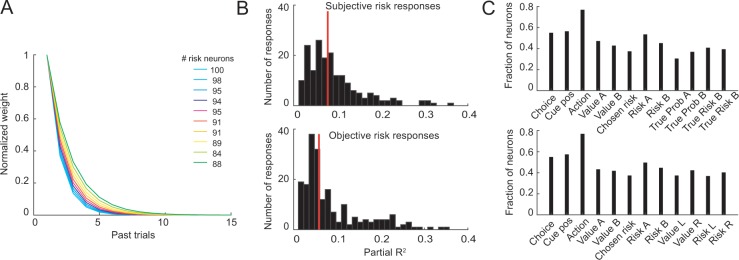
Figure 4—figure supplement 3. Control analyses for neuronal object-risk coding.

Figure 4—figure supplement 3.

(A) Results from supplementary analyses in which neuronal activity was regressed on object-risk measures derived using different exponential weighting functions for past rewards. Numbers next to the color code in the legend state the number of identified object-risk neurons for each color-coded weighting function. The main analysis using empirically derived weighting function from the each animals’ choices identified 95 object-risk neurons. (B) Histograms of partial-R2 values (quantifying explained variance in neuronal activity) for neuronal responses with significant coefficient for subjective risk (upper histogram) and significant coefficient for objective risk (lower histogram). Red lines indicate distribution means. The distributions were significantly different (p=0.0015, Kolmogorov-Smirnov test) with higher distribution mean for subjective risk (p=0.04, Wilcoxon test). (C) Results from stepwise multiple regressions. Shown are the fractions of neurons (from 205 recorded DLPFC neurons, pooled across all task periods) with significant effects for the different variables when both objective and subjective value and risk variables were included in the starting set of regressors (upper panel) and when both object risk and action risk variables were included in the starting set (lower panel). These results and those in the main text show that significant numbers of neurons coded object risk across analysis approaches.
Figure 4—figure supplement 3—source data 1.
DOI: 10.7554/eLife.44838.018
Figure 4—figure supplement 4. Numbers of neurons (and percentages of recorded neurons) encoding risk and value for alternative risk definitions.

Figure 4—figure supplement 4.

The alternative definitions were used for calculating the object risk regressors in our main neuronal regression model (Equation 10).