Abstract
A novel design for a deployable catheter-based ultrasound applicator for endoluminal and laparoscopic intervention is introduced. By combining a 1D cylindrical ring phased array with an expandable paraboloid or conical-shaped balloon-based reflector, the applicator can be controllably collapsed for compact delivery and deployed to mimic a forward-firing larger diameter concentric ring array with tight focusing and electronic steering capabilities in depth. Comprehensive acoustic and biothermal parametric studies were employed to characterize the capabilities of the applicator design as a function of transducer dimensions, phased array configuration, and balloon reflector geometry. Modeling results indicate that practical balloon sizes (43–57 mm expanded diameter), transducer array configurations (e.g., 1.5 MHz, 10 mm OD × 20 mm length, 8 or 16 array elements), and sonication durations (30 s) are capable of producing spatially-localized acoustic intensity focal patterns and ablative thermal lesions (width: 2.8–4.8 mm; length: 5.3–40.1 mm) in generalized soft tissue across a 5–100 mm depth range. Larger focal intensity gain magnitudes and narrower focal dimensions are attainable using paraboloid-shaped balloon reflectors with natural geometric focal depths of 25–55 mm, whereas conical-shaped reflectors (angled 45–55°) produce broader foci and extend electronic steering range in depth. A proof-of-concept phased array applicator assembly was fabricated and characterized using hydrophone and radiation force balance measurements and demonstrated good agreement with simulation. The results of this study suggest that combining small diameter cylindrical phased arrays with expandable balloon reflectors can enhance minimally invasive ultrasound-based intervention by augmenting achievable focal gains and penetration depths with dynamic adjustment of treatment depth.
Keywords: therapeutic ultrasound, phased array, balloon catheter, thermal ablation, minimally-invasive
Introduction:
Endoluminal and laparoscopic catheter-based ultrasound applicators provide a minimally invasive means of delivering localized acoustic energy, for mechanical or thermal therapeutic applications, to deep tissue targets adjacent to body lumens or cavities (Diederich 2012, Salgaonkar and Diederich 2015). In comparison to extracorporeal high intensity focused ultrasound, which incorporates large external phased array transducers to precisely electronically steer and focus the acoustic beam at up to 10–15 cm depths in the body (Kennedy 2005, Hynynen and Jones 2016), catheter-based applicators are more invasive but can facilitate energy delivery to sites with limited external acoustic access. These applicators typically have one to a few small-sized and asynchronously operated transducer elements of a variety of geometries (spherically/curvilinear-focused, planar, cylindrical), optimized either for focal and spatially-selective energy deposition and heating patterns or for more volumetric and diffuse distributions (Adams et al. 2016, Diederich 2012, Salgaonkar and Diederich 2015). As an example, compact endoluminal ultrasound applicators suitable for insertion into the stomach for ablation of adjacent pancreatic tissue have been designed with a single-element spherically focused transducer for generating focal lesions or dual planar or curvilinear transducers for more diffuse heating (Li et al. 2015, Adams et al. 2016). As a trade-off with their compact size, these applicators have limited versatility in shaping energy deposition patterns to conform to different target volumes or in selectively focusing to depths beyond 2–3 cm in tissue.
The degree of control over the energy distributions generated by catheter-based and intracavitary ultrasound applicators can be improved by replacing the single or few active transducer elements with miniature phased arrays. Examples of minimally-invasive devices with phased arrays include endorectal probes for prostate cancer ablation (Chapelon et al. 1993, Chapelon et al. 1999, Christopher 2005, Lindner et al. 2012, Seip et al. 2005, Tan et al. 2001), interstitial devices for liver ablation (Mast et al. 2011), and endoluminal devices for esophageal ablation (Melodelima et al. 2006) and transesophageal cardiac ablation (Bessiere et al. 2016, Constanciel et al. 2013, Pichardo and Hynynen 2009). Comparatively simpler devices that contain linear transducer arrays with independent power and/or frequency control to control heating along the length of the catheter and penetration depth in tissue, but no phasing or beamforming, have been developed for transurethral prostate ablation (Chopra et al. 2010, Chin et al. 2016, Burtnyk et al. 2010), rectal hyperthermia (Diederich and Hynynen 1990), or direct percutaneous insertion into tissue for ablation/hyperthermia (Diederich 1996). While phased array integration can provide some flexibility in treatment depth or heating pattern, those capabilities and benefits are directly proportional to the overall size of the array, which is constrained by the delivery catheter dimensions and luminal access pathway. As an example, large intracavitary applicators which contain full 2D phased arrays at dimensions up to ~ 2 × 4 cm, such as the Exablate Prostate platform for transrectal prostate ablation, are designed for placement in large cavities and are capable of 3D steering within the transverse extent of the array and multi-focal beamforming at depths up to ~4–5 cm (Salgaonkar et al. 2014). For sites and targets that require smaller catheters and integrated transducer arrays upon insertion, full 3D steering is precluded due to increased array and fabrication complexity, and electronic steering in depth is fundamentally limited by the small source aperture.
One technique for circumventing the limited aperture of catheter-integrated transducers is to combine transducer sources with expandable balloon-reflector assemblies that, once deployed after device delivery, can reflect emitted acoustic energy across the larger effective surface area of the balloon and re-direct it into the tissue target. Such deployable device assemblies have been devised using cylindrical ultrasound radiators and expandable reflective balloons, as used for intravascular delivery and intracardiac expansion for treatment of atrial fibrillation (Meininger et al. 2003, Schmidt et al. 2007, Nakagawa et al. 2007, Sinelnikov et al. 2009). Our group has investigated combining cylindrical transducer sources with an expandable conical balloon that contains multiple luminal compartments filled with water, air, or perfluorocarbon fluid (Adams et al. 2017, Adams et al. 2017). In this assembly configuration, acoustic energy emitted by the cylindrical radiator is reflected off the transverse conical balloon boundary, redirected towards the tip of the device, and focused by refraction as it travels across the perfluorocarbon-filled fluid lens compartment into tissue. Conceptually, this device assembly would be capable of compact endoluminal delivery, and upon deployment, dynamically focusing in depth by mechanically varying the distal curvature of the fluid lens compartment, with focusing capabilities enhanced by the dispersion of acoustic energy across the larger effective aperture of the reflector surface.
In this work we introduce a novel design for a deployable ultrasound applicator that combines a phased array cylindrical transducer source with the aperture-enhancement of an expandable balloon-based reflector to permit dynamic electronic focusing and steering in depth. The objective of this study is to employ acoustic and biothermal modeling methods to investigate and characterize the capabilities of the proposed deployable phased-array end-fire applicator design, as substantiated by proof-of-concept experimental prototype development and measurements. Parametric acoustic modeling studies assessing the influence of key transducer array design parameters, including transducer dimensions and array subdivision specifications, when paired with reflectors of various geometries, were performed. The influence of various conical or paraboloid reflector geometries on focusing capabilities and steering ranges in depth were examined. Biothermal simulations for a generalized endoluminal soft-tissue model were performed with select applicator assembly configurations to examine representative temperature and thermal dose distributions for thermal ablation applications. Lastly, a prototype experimental applicator assembly was fabricated and characterized by hydrophone and radiation force balance measurements for assessment of simulations and the overall design concept.
Methods:
Design Schema:
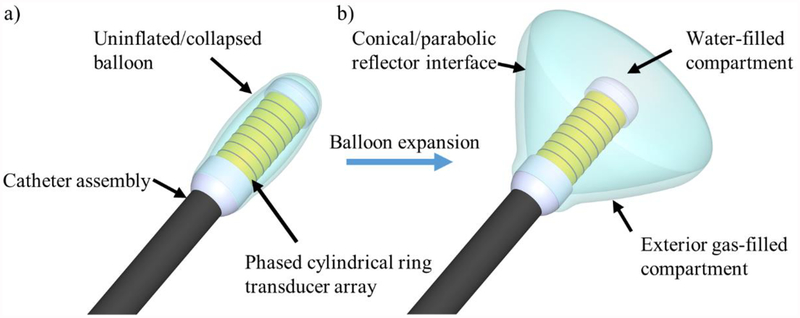
The proposed applicator assembly consists of a 1D phased array of cylindrical transducers, centrally aligned along the distal tip of a catheter and subdivided along the long axis into individual ring elements, surrounded by an expandable reflector balloon, as shown in figure 1. The balloon contains two separate luminal compartments. The interior compartment is filled with water and has a parabolic or conical geometric profile along its transverse border, and an arbitrary (e.g., spherical) profile along its distal edge. The second compartment, coupling to the transverse border of the interior balloon, is filled with gas or air, forming an acoustically reflective interface between the two compartments. As acoustic energy is emitted radially by the cylindrical phased array, the energy is completely reflected at the parabolic/conical water-air interface between the two balloon compartments and re-directed towards and outwards from the distal tip of the device into adjacent tissue. By phasing the elements of the cylindrical ring array appropriately, the capability of electronically focusing in depth, akin to a concentric-ring transducer array (Cain and Umemura 1986, Fjield et al. 1996, Fjield and Hynynen 1997), is hypothesized.
Figure 1.
Design schema for the forward-firing deployable ultrasound applicator, consisting of a phased cylindrical transducer array situated at the distal end of a catheter and surrounded by a dual compartment balloon. (a) During device delivery and removal, the balloon would be in a collapsed state for an overall compact profile. (b) After placement at the target site, the balloon would deploy by filling the interior balloon compartment with water and the thin outer compartment with air, forming a reflective boundary directing energy forward. Appropriate phasing of the transducer elements permits focusing and steering in depth beyond the tip of the applicator, mimicking a larger aperture concentric-ring array.
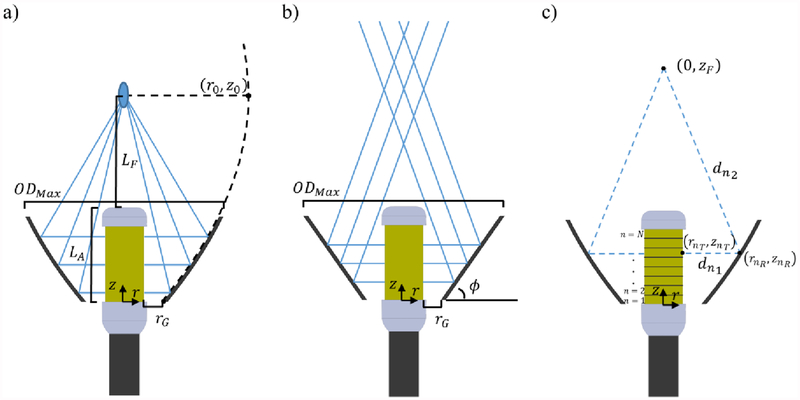
As shown in figure 2(a) with ray traces, the paraboloid reflector considered herein provides an inherent on-axis geometric focusing of acoustic waves emitted by a central cylindrical transducer array. Its cross-sectional geometry consists of a 2D parabolic profile, with the parabola focus aligned with the central longitudinal axis of the catheter assembly. The depth, or distance of the parabola focus from the tip of the applicator dictates the geometric focal length (LF). Also considered is a conical reflector geometry, as shown in figure 2(b), where the angle of the conical interface with respect to the short axis of the catheter is denoted by ϕ. For ϕ = 45°, all reflected acoustic energy is collimated in the direction of the long catheter axis, with no inherent convergence or focusing of the energy. As ϕ increases beyond 45°, reflected energy converges to progressively shorter depths beyond the distal tip of the applicator. Rather than converging all reflected waves to a single point, as in the paraboloid case, the convergent region along the central axis is more elongated, as illustrated by ray traces (figure 2(b)). The max diameter (ODMax) of the expanded reflector balloons at the distal tip of the assembly is a function of the paraboloid geometric focal length LF, or conical angle ϕ, the transverse distance or spacing between the proximal transducer array edge and the reflector, as represented by rG, and the extent of the reflector interface in the z longitudinal dimension, which is constrained to be no less than the length of the transducer array.
Figure 2.
Ray trace schematics and notation for a cylindrical transducer array in combination with (a) paraboloid or (b) conical reflector geometries considered in this work. (c) Schematic and relevant coordinates and notation for electronic focusing in depth by phasing a 1D cylindrical transducer array.
Phase calculations:
Phase values for electronic steering in depth were determined by calculating the fractional wavelength of the total path length from the center of each cylindrical ring element to the desired focal position, as shown by figure 2(c). The path length Dn incorporates the radial distance between the outer surface of the nth cylindrical ring element with coordinates of (rnT, znT) and the radial projection onto the reflector (rnR, znR), and the Euclidean distance from the reflector position to the focal position at (0, zF). The coordinates and distances are in reference to the center of each cylindrical sub-element along the z-axis.
For each reflector case, these distances can be determined from the 2D balloon geometry, which can be uniquely defined by the transducer array radius R, the transverse distance between the proximal array edge and the reflector rG, the length of the transducer array and distal housing LA, the electronic focal depth zF, and the paraboloid geometric focal length LF or conical angle ϕ for the paraboloid or conical balloon geometries, respectively. With the total path length , the phase setting applied to the n th cylindrical ring, in degrees can be calculated from the fractional wavelength as:
| (7) |
Where mod is the modulus operator, and λ is the wavelength.
Acoustic Modeling
Modeling of acoustic wave generation and propagation through the applicator assemblies and into water or heterogeneous tissue domains was performed using a finite difference time-domain (FDTD) solver of the full 3D linear acoustic pressure wave equation in Sim4Life 3.4 (Zurich Med Tech AG, Switzerland). This solver incorporates relevant wave propagation phenomena including reflection, refraction, attenuation, diffraction, and interference. 3D models of the applicator assembly, including the cylindrical ring phased array and the backbone nylon housing structure were generated using the Python API for the Sim4Life model environment. The 3D geometries of the reflective balloon interfaces, for both paraboloid and conical multi-compartment balloons, were generated in SolidWorks and imported into Sim4life, with the interface modeled as an ideal reflector. The maximum element size for the FDTD acoustic solver mesh was set to to ensure simulation accuracy. The surface velocity and phase were uniform over the radiating surface of each transducer section or array element.
Acoustic Simulations and Parametric Studies
An initial series of parametric studies was performed to investigate the inherent focusing capability of a paraboloid balloon reflector surrounding a single 1.5 MHz cylindrical transducer (non-phased array), explored across a range of transducer and reflector dimensions relevant for endoluminal or laparoscopic catheter-based applications. Acoustic intensity distributions generated by the applicator assembly were simulated in a homogenous water medium. The influence of the transducer diameter, transducer length, and the spacing between the transducer and reflector (rG) were examined in three separate studies, as detailed in table 1. For each study, the paraboloid reflector geometry was varied to produce geometric focal depths between 10–100 mm in water. This set of studies was designed to establish the relationship between cylindrical source dimensions and paraboloid reflector geometry on achievable focal magnitude and dimensions prior to the more complex analysis with phased array sources.
Table 1.
Study descriptions for parametric analyses involving a single-element (non-phased array) cylindrical transducer centered within a paraboloid balloon reflector, sonicating into a homogenous water medium. Varied parameter for each study is bolded.
| Study # | Varied parameter | Transducer dimensions | Reflector dimensions** |
|---|---|---|---|
| 1 | Transducer length |
Length: 10–20 mm
OD: 10 mm |
rG = 2 mm Length = 14–24 mm* ODMax adjusted accordingly (24.4–51.8 mm) |
| 2 | Transducer OD |
OD: 4–10 mm Length: 10 mm |
rG adjusted accordingly (2.6–8.4 mm) Length = 14 mm* ODMax = 35 mm |
| 3 | Transducer-reflector spacing (rG) | OD: 10 mm Length: 10 mm |
rG
= 0.5–10 mm Length = 14 mm* ODMax adjusted accordingly (22.3–49.8 mm) |
Reflector length set to cover longitudinal extent of transducer length, plus 2 mm distal and proximal of transducer
Paraboloid geometric focal depth (LF) swept from 5–100 mm for each study
Next, phased array transducer configurations were simulated and the electronic focusing performance was examined as a function of reflector geometry and number of elements making up the array. A 1.5 MHz transducer array geometry with 10 mm OD × 20 mm length was modeled. Six different reflector geometries were considered: three paraboloids with geometric focal lengths of 25, 40, or 55 mm; and three conical reflectors with ϕ = 45, 50, or 55°. The phased array was modeled as separate transducer sections under independent phase control, with the array density varied between 2–64 elements with corresponding element lengths between 10 mm to 0.313 mm respectively, while maintaining the 20 mm total array length. The spacing between each element was set to zero. Phase settings for each array element were calculated and applied corresponding to an electronic focal depth of 30 mm beyond the applicator in a water medium.
Next, electronic steering capabilities and ranges for several practical applicator configurations and reflector geometries were explored. Four 1.5 MHz, 10 mm OD transducer array configurations were investigated: (1) 16 elements, 20 mm length; (2) 8 elements, 20 mm length; (3) 8 elements, 10 mm length; and (4) 4 elements, 10 mm length. 0.2 mm wide inactive kerfs were modeled between array sub-elements. Six reflector configurations – including three paraboloid reflectors with geometric focal lengths of 25, 40, and 55 mm; and three conical reflectors with ϕ = 45, 50, or 55°, were incorporated. The reflector dimensions were tailored to each transducer array configuration such that the reflector length extended 2 mm beyond the proximal and distal borders of the transducer array, and rG was set to 2 mm. The electronic focal depth range explored for each transducer-reflector configuration pair extended 10–100 mm beyond the applicator tip.
Lastly, in order to examine how the focusing and steering performance of the proposed applicator assembly compared against conventional concentric-ring transducer array designs, simulations of two concentric-ring arrays with dimensions and specifications analogous to a select deployable assembly configuration (8 element, 10 mm OD × 20 mm length cylindrical transducer array, 40 mm FL paraboloid reflector, 2 mm rG, and 2 mm reflector length beyond array proximal/distal boundaries) were performed. The sizes of the concentric-ring arrays were based on the dimensions of the paraboloid balloon reflector for the comparative deployable assembly. Both concentric-ring array models were modeled with a spherically-focused geometry (geometric focal length of 40 mm beyond the distal array boundary) with a central circular inactive zone based on the cylindrical array cross-section. Concentric-ring array model A (C-R Array A) had inner diameter (ID) and OD equal to the proximal and distal diameters of the expanded balloon reflector, 10 mm and 46.3 mm, respectively. Array model B (C-R Array B) had ID/OD equal to a smaller portion of the balloon reflector that was co-radial with the proximal and distal borders of the cylindrical transducer array (14/42.3 mm, respectively). Each array was subdivided into 8 elements of equal radial width from the top-down perspective of the array.
Biothermal Modeling
To investigate the utility of the proposed applicator assembly for thermal ablation of tissue, a three-dimensional axisymmetric bioheat transfer model of tissue heating was employed. Transient temperature distributions resulting from the propagating acoustic intensity fields were simulated using an implicit finite element method solver (COMSOL Multiphysics 4.3, Comsol, Inc., Burlington, MA, USA) of the Pennes bioheat transfer equation (Pennes 1948):
where ρ [kg/m3] is the tissue density, C [J/°C/kg] is the specific heat of tissue (Cb for blood), T [°C] is tissue temperature, k [W/m/°C] is tissue thermal conductivity, ωb [kg/m3/s] is the blood perfusion rate, Tb is the capillary blood temperature (37 °C). Qac [W/m3] is the acoustic power deposition in tissue, which is approximated from the acoustic time-averaged intensity field I [W/m2]:
α is the acoustic absorption coefficient [Np/m] in tissue and was set as equal to the attenuation coefficient for each tissue as all scattered energy was assumed to be absorbed locally. Thermal dose distributions in tissue were calculated using the Sapareto-Dewey formulation (Sapareto and Dewey 1984):
Where t43 is the equivalent minutes at 43 °C (EM43°C), R = 0.5 above 43 °C and 0.25 otherwise, and T [°C] is the average temperature at each spatial position over a time interval Δt. The 240 EM43°C contour was used to approximate the border of lethal tissue damage (Dewey 2009, Yarmolenko et al. 2011, McDannold et al. 1998). Dynamic cessation of perfusion during thermal ablation due to vascular disruption was approximated by reducing tissue perfusion to zero when the temperature exceeded 54 °C or thermal dose threshold exceeded 300 EM43°C (Prakash and Diederich 2012).
Biothermal Parametric Studies
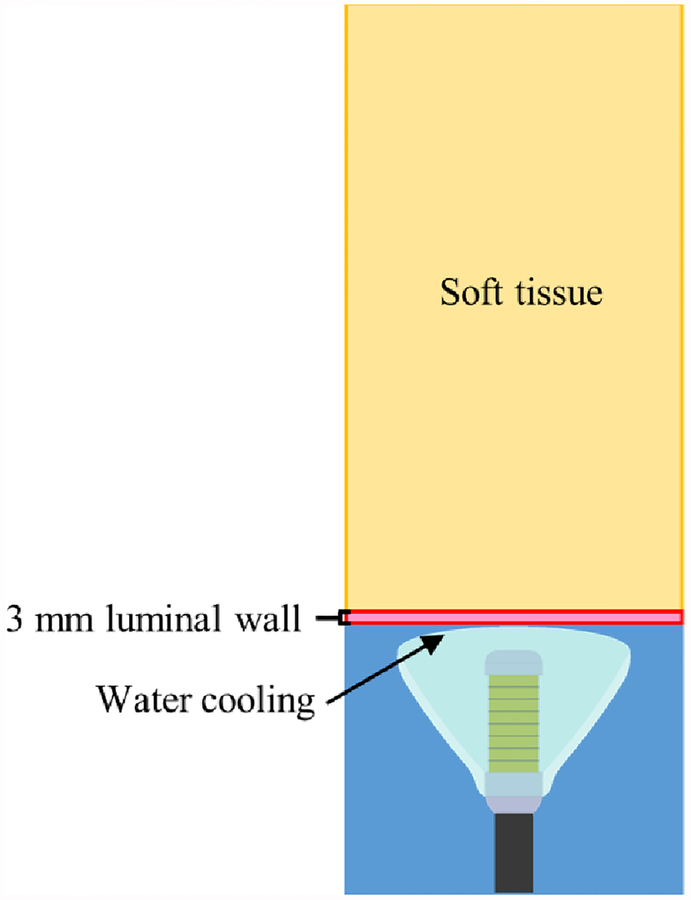
An axisymmetric model of endoluminal ablation of soft tissue through a luminal wall (i.e., stomach wall) tissue layer using an expanded applicator assembly was employed. The model geometry of the applicator assembly and tissue compartments is illustrated in figure 3, with generalized tissue properties as shown in table 2 (Adams et al. 2016, Duck 2013, Hasgall et al. 2018). Two distinctly configured 1.5 MHz, 10 mm OD × 20 mm length transducer arrays, with 8 or 16 elements, were modeled in combination with the six paraboloid or conical reflector balloon geometries described above. Cooling of the balloon-luminal wall interface via internal balloon water cooling flow was modeled with a convective heat flux boundary condition with water temperature of 25 °C and heat transfer coefficient of 500 W/m2/°C (Wootton et al. 2011). The luminal wall was modeled as 3 mm thick, and the overall extents for the axisymmetric computational tissue domain were 3 cm radial and 7–22 cm in length, depending on simulated focal depth. Dirichlet boundary conditions constrained the outer boundaries of the tissue domains to 37 °C. 30 s sonication durations were modeled, with constant input power iteratively determined for each case to produce a temperature maximum of 75 °C by the end of the sonication. Temperature solutions were continued to be acquired for 2 minutes post-sonication to account for thermal dose accrual during tissue cooling. For each transducer array and reflector pairing, single thermal lesions were simulated as the phased focal depth was adjusted to explore the capability of each configuration to selectively heat across 10–100 mm depths.
Figure 3.
Cross-sectional slice of the biothermal tissue ablation model geometry, with the distal end of the applicator assembly in contact with the luminal wall and sonicating into a generalized soft tissue domain.
Table 2.
Thermal and acoustic properties of tissues used in biothermal modeling studies (Duck 2013, Hasgall et al. 2018, Adams et al. 2016).
| Tissue | Density (kg/m3) |
Attenuation (Np/m) |
Thermal conductivity (W/m/°C) |
Specific heat (J/kg/°C) |
Perfusion rate (kg/m3/s) |
|---|---|---|---|---|---|
| Soft Tissue | 1050 | 6.9f | 0.51 | 3639 | 2 |
| Luminal Wall | 1045 | 5f | 0.53 | 3698 | 6.75 |
| Blood | 1050 | - | 0.52 | 3617 | - |
f:frequency (MHz)
Experimental prototype construction and characterization
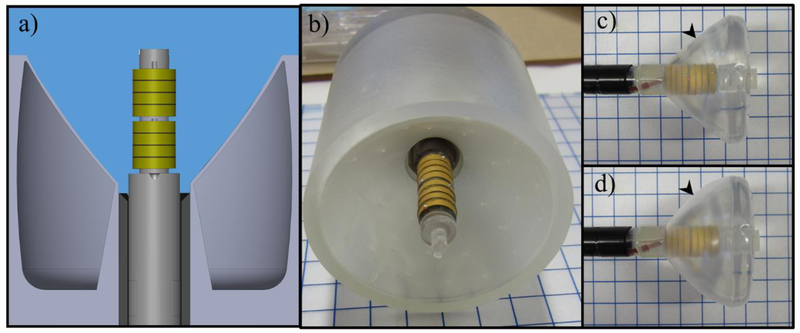
In order to experimentally test the proposed applicator concept and verify performance trends from theoretical simulations performed herein, a proof-of-concept (POC) applicator assembly was designed, fabricated, and then characterized using 3D computer-controlled scans of hydrophone measurements in a degassed water tank. The cylindrical transducer array, with schematic shown in figure 4, consisted of two 1.6 MHz PZT tubes of 9 mm OD × 10 mm length (EBL#1, EBL Products, Inc., East Hartford, CT, USA) mounted lengthwise on a 3D printed housing fixture, as designed in Solidworks and printed using the Clear resin material with a Form 2 3D printer (Formlabs Inc., Somerville, MA, USA). Each transducer was sectored into four rings of equal length for a total of 8 elements in the array. Sectoring was performed using a dicing saw (Disco Abrasive Systems, Shinagawa-Ku, Japan), with each cut extending ~1.1 mm in depth from the outer cylindrical surface, and producing 0.2 mm wide kerfs. Each element was independently wired using 0.008” silver wire (California Fine Wire Company, Grover Beach, CA, USA), and all signal and ground wires were routed through the central lumen of the fixture and soldered to coaxial cabling at the proximal end. The electrical impedance of each transducer segment was matched to 50 ohms using LC matching network circuits for efficient power delivery (Hardy 1979). Epoxy (3M DP 110, 3M, Maplewood, MN, USA) was applied along the sectored transducer edges to secure onto the housing fixture and ensure air-backing, and to fill the kerfs for isolation.
Figure 4.
a) Diagram of proof-of-concept experimental applicator assembly consisting of an 8-ring cylindrical phased transducer array centered in a 3D printed hollow and air-backed paraboloid or conical reflector fixture, submerged in degassed and deionized water for hydrophone measurements. b) Fabricated array and transducer housing centered in a printed reflector fixture. c) Prototype deployable assembly with custom designed paraboloid multi-compartment balloon, with air inflation and distension of the external silicone membrane (black arrowhead) shown in d) to form a reflective boundary along the transverse boundary of the internal water-filled high-pressure PET balloon.
As a surrogate for multi-compartment balloon-based reflectors, six hollow air-backed rigid reflectors were designed in Solidworks and 3D printed (Formlabs Inc.) to approximate the paraboloid and conical geometries incorporated in simulations. The three paraboloid reflectors (geometric focal lengths of 25, 40, and 55 mm) and three conical reflectors (ϕ = 45, 50, or 55°) extended in length ~3 mm proximal and distal to the transducer array length, with rG = 5 mm. The transducer array could be interchangeably centered and secured within each reflector fixture for testing.
A custom multi-compartment balloon was fabricated and integrated with the prototype transducer array assembly for experimental characterization, as shown in figure 4c. The inner balloon was custom fabricated (Nordson MEDICAL, Salem, NH, USA) from polyethylene terephthalate (PET), and designed to have an ID of 11 mm and ODMax of 5 cm, with parabolic curvature along the transverse border corresponding to a geometric focal length of 37.5 mm beyond the distal tip. To form the external air-filled lumen around the parabolic boundary, a thin silicone membrane (Smooth-On, Macungie, PA, USA) was overlaid over the PET balloon by dip-molding, and sealed at proximal and distal balloon borders using cyanoacrylate adhesive (Loctite 4902, Henkel, Düsseldorf, Germany). A segment of 0.060” OD pellathane tubing (Nordson MEDICAL, USA) was inserted between the PET and silicone layers before sealing, and used to inject air between the two layers to cause distension of the silicone away from the PET and create the reflective balloon boundary, as shown in figure 4d. Degassed water was circulated through internal channels within the transducer housing to fill and pressurize the internal PET balloon compartment during testing.
A custom 8-channel phase shifting circuit was designed in house to produce the phase shifted signals as input to a multichannel power amplifier, with separate control for each array element. The circuit was designed to have 4 bits of phase resolution using digital counter/register digital chips (AC series) and related techniques (Diederich 1990, El-Desouki and Hynynen 2011) and incorporated a programmable clock chip for variable frequency selection, along with variable amplifiers for independent power control to each channel and filters to reduce harmonic content of the output sinusoidal waveforms. An Arduino Uno (Arduino AG) microcontroller and serial communications were used to set the driving frequency and phases of the output signals in real-time via PC control. Phase-shifted input signals were amplified using a Helios V-5000P multichannel amplifier (Varian Associates, Palo Alto, CA, USA), and transmitted to each LC matching circuit and array element. A Keysight N1914A power meter (Keysight, Santa Rosa, CA, USA) was used in-line between the amplifier and LC circuit to monitor and tune the power applied to each channel.
Measurements of the beam distributions produced by the POC applicator assembly were performed in a tank of deionized, degassed water by 3D scanning a calibrated hydrophone (Onda HNR-0500, Onda Corp., Sunnyvale, CA, USA) under computerized motor control and data acquisition. 1D central axial intensity profiles were acquired for each reflector geometry as the phase settings were adjusted to shift the focal depth between 10–100 mm. Longitudinal scanning planes of 60 × 80 mm extents, with 0.5 mm spacing, and transverse scans of focal planes of 15 × 15 mm extent with 0.25 mm spacing, were taken for select configurations and phase settings. Following standard protocols for acquiring transducer beam plots, burst length and repetition period were 100 μs and 1 ms, respectively, and the net electrical power delivered to each array element for all measurements was 50 mW in continuous wave (CW) output, for a combined total of 400 mW across the entire array. Hydrophone voltage amplitudes were measured using a digital oscilloscope and converted to intensity values using hydrophone-specific calibration tables. Radiation force balance measurements (Stewart 1982) using a bottom loading absorbing target and transient buoyancy correction were performed to determine the acoustic power output characteristics of the array, and to quantify that the assembly could produce sufficiently high acoustic power output levels as required to generate focal intensities (>100 W/cm2) for endoluminal thermal ablation applications.
Results:
Acoustic simulations
Analysis of paraboloid reflector with non-phased cylindrical source:
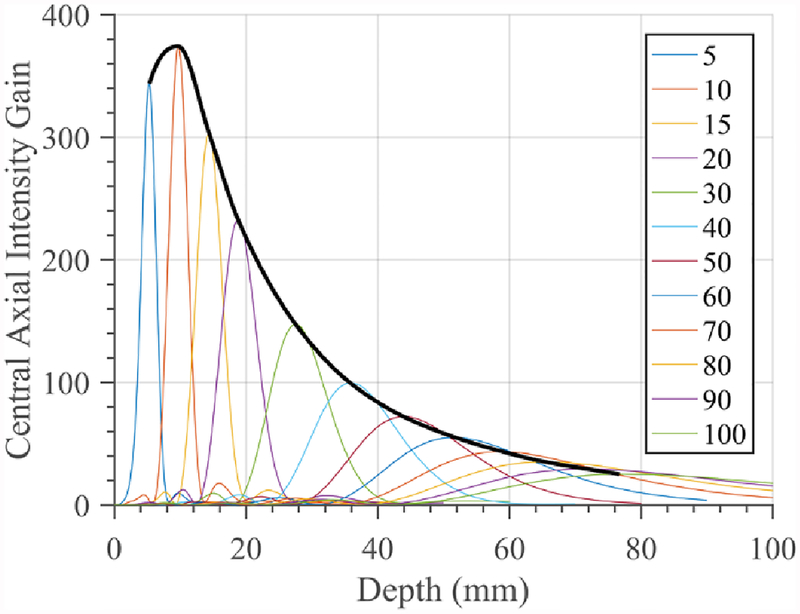
The combination of a single element cylindrical transducer source (without phasing) within a paraboloid reflector yields focal patterns at the geometric focal depth corresponding to the reflector parabolic profile. Figure 5 shows a series of 1D central axial intensity gain distributions in water as the paraboloid reflector geometry is varied to produce different focal depths, for a 10 mm OD × 10 mm length cylindrical transducer. The intensity gain is defined as the ratio of the field-point intensity to the intensity at the surface of the transducer, i.e., Ifield/Isurface. As expected, the focal intensity and gain decreases with depth, and deviation between the actual focal depth and the geometric focal depth of the reflector increases with depth. By interpolating over the peaks of the individual traces across all focal depths (black curve in figure 5), the resulting intensity gain curve (IGC) approximates achievable focal gain for a transducer configuration over depth when paired with the appropriate reflector.
Figure 5.
Central axial intensity gain curves for a 1.5 MHz, 10 mm OD × 10 mm length single element tube without phasing as paraboloid reflector geometry is varied to adjust geometric focal depth (legend). Interpolation of maxima (black line) generates an intensity gain curve (IGC) which can approximate max focal gain as a function of depth, across all paraboloid geometries.
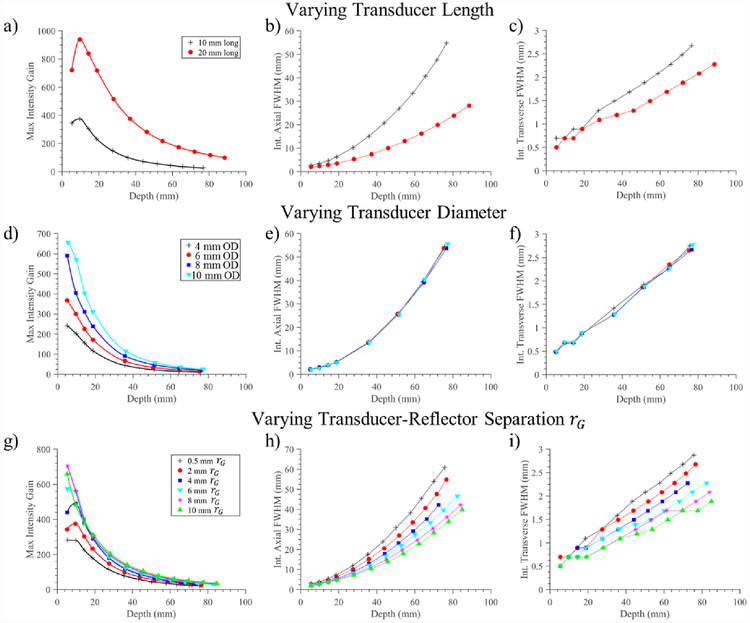
Compilations of these interpolated IGCs for constant transducer surface intensity, along with resultant axial and transverse FWHM focal dimensions, as a function of cylindrical transducer length, diameter, and rG spacing are shown in figure 6. Figure 6(a–c) compares two 10 mm OD transducers, with 10 or 20 mm length, with corresponding reflectors extending along the transducer length and across the range of focal depths. The larger transducer length configuration results in greater focal gain magnitudes, as well as narrower focusing with consistently smaller axial and transverse FWHM across depth.
Figure 6.
Compilation of simulation results for parametric analysis of a single cylindrical source combined with a paraboloid reflector. The first column (a,d,g) shows the interpolated intensity gain curves as paraboloid geometry is varied to focus across depths. The second and third columns depict the intensity FWHM axial length and transverse width of the focus, respectively, across depth. (a-c) Simulation results from varying the transducer length between 10 and 20 mm long, for a 1.5 MHz 10 mm OD cylindrical source, with reflector extent adjusted to cover transducer length. (d-f) Simulation results for constant transducer length of 10 mm and 35 mm reflector OD as transducer diameter is varied from 4–10 mm. (g-i) Simulation results corresponding to a single transducer configuration (1.5 MHz, 10 mm OD × 10 mm length) as the transverse offset rG between tubular source and reflector is increased, effectively increasing the diameter of the paraboloid reflector.
The effect of cylindrical transducer diameter, for a fixed length and reflector diameter, is shown in figure 6(d–f). Here a 10 mm transducer length and constant 35 mm OD reflector is maintained as the tubular transducer diameter is varied from 4–10 mm and the reflector geometric focus varied for focusing across depth. The relative intensity gain increases as a function of tube diameter, as shown in figure 6(d); however, as shown in figure 6(e,f), the focal dimensions are largely independent of tube diameter, demonstrating that the tube diameter alone has a minimal effect on the resultant focal distribution.
Figure 6(g–i) demonstrates the effect of increasing the rG spacing between transducer and reflector from 0.5–10 mm for a constant transducer source size (10 mm OD × 10 mm length). Increasing rG effectively increases the diameter of the reflector along its entire length: for this assembly configuration a 1 mm increase in rG increases the ODMax of the reflector by ~1.5–1.8 mm, depending on paraboloid geometric focal length. Increasing the reflector diameter results in higher intensity gain, as shown in figure 6(g), as well as narrower focal zones across depths, as shown in figure 6(h,i). For example, increasing the reflector diameter from 29 mm (0.5 mm rG) to 45 mm (10 mm rG) increases the intensity gain from 115 to 205 at a focal depth of 30 mm, and decreases FWHM focal dimensions from 1.3 mm × 11.8 mm to 0.9 mm × 7.1 mm.
Analysis of phased array cylindrical sources with reflectors:
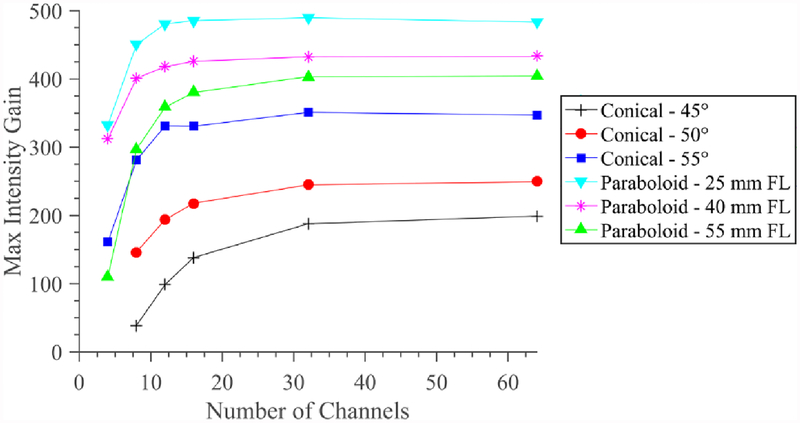
Figure 7 illustrates how electronic focusing at a set depth of 30 mm for the phased cylindrical transducer array (10 mm OD × 20 mm length) within a reflector assembly is affected by reflector geometry and number of array elements. As expected, the focusing performance increases and asymptotically stabilizes as the number of array elements approaches 64 for each configuration. In consideration of practical device design, achieving 90% of the ideal focal gain magnitude can be achieved with 8 array elements for the paraboloid reflectors with geometric focal lengths (FLs) of 25 and 40 mm, whereas the 55 mm FL paraboloid requires ~13, and the conical 45, 50, and 55° geometries require ~30, ~20, and ~11 array elements, respectively. The 25 mm FL paraboloid produced the greatest maximum gain, followed by the 40 and 55 mm FL paraboloids, then by the conical reflectors in order of decreasing ϕ. These gain differences persisted across number of array elements.
Figure 7.
Focal intensity gain magnitude corresponding to a 20 mm long cylindrical transducer phased array paired with paraboloid or conical reflector geometries and electronic focusing at a depth of 30 mm in water, as a function of the number of elements in the phased array.
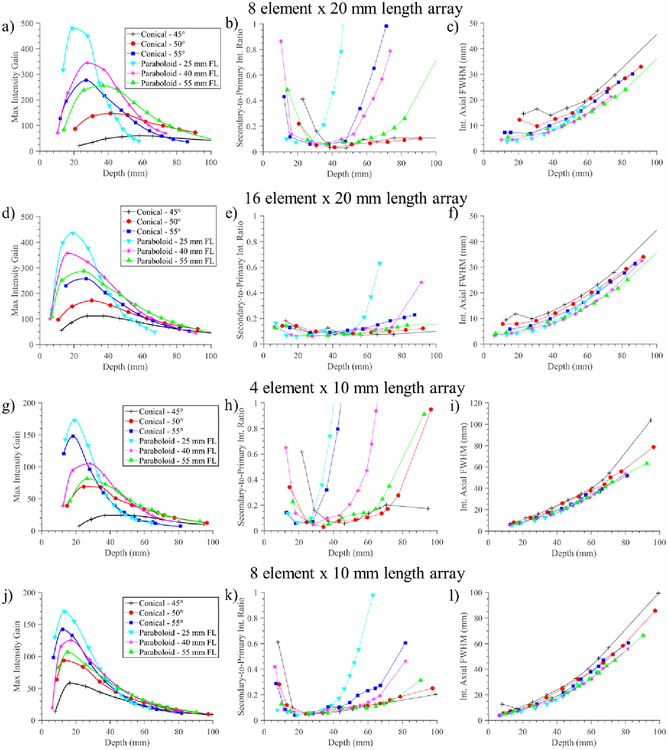
Electronic steering capabilities along depth were assessed for four practical transducer array configurations (10 mm or 20 mm length, 4/8/16 array elements), each in combination with all six reflector geometries, as shown in figure 8. For each of these configurations, the interpolated maximum intensity focal gains (IGCs) across phased focal depths, the ratio of the secondary intensity peak relative to the primary peak intensity (S:P), and the axial FWHM of the primary focus, are presented in columns from left to right, respectively. The S:P ratio along the central beam axis is a metric for selective and localized focusing, where high values represent grating lobe effects or poor beam forming, thereby reducing localization of acoustic energy and potentially producing secondary or unintended thermal distributions.
Figure 8.
Performance measures of the deployable applicator assembly as a function of phased array configuration and reflector geometry, for four array configurations (1.5 MHz, 10 mm OD): (a-c) 8 element × 20 mm length; (d-f) 16 element × 20 mm length; (g-i) 4 element × 10 mm length; (j-l) 8 element × 10 mm length. Performance criteria include column 1) max focal intensity gain, column 2) secondary-to-primary (S:P) peak focal intensity ratio as a measure of beam focusing selectivity, and column 3) axial FWHM of focus as indicator of focal dimensions, all as a function of depth.
As illustrated in figure 8, the steering range of the assembly is heavily influenced by the reflector geometry. The more focal reflector geometries (e.g., paraboloid with 25 mm geometric FL) are capable of higher overall focal gains and narrower focuses at shallower depths but diminished focal gain and selectivity (i.e., higher S:P ratio) at deeper depths. Conversely, the least focused reflector geometry, the 45° cone, results in poor focusing capabilities at shallow depths and overall low focal gain magnitudes relative to the other reflectors but has the flattest or most uniform gain and S:P profiles over depth. Compared to the 55° cone, the slightly convergent 50° cone reflector geometry produces higher focal gains at deeper depths (>35–65 mm, depending on array configuration), but lower gains at shallower depths. When paired with the paraboloid reflectors, the peak focal intensities and focusing depths with highest selectivity are shifted towards the geometric focal length, and depth steering ranges are increased as the geometric focal length of the parabola increases. For all applicator configurations the focal sizes (axial length intensity FWHM) were smaller for the paraboloid reflector geometries as compared to the conical geometries.
Comparing across the four applicator configurations, it is shown that increasing the number of elements in the array enhances the depth steering range for all reflector configurations, and shifts peak focal depths towards the shallower extreme. While peak focal gains are relatively similar between the 8 and 16 element 20 mm arrays, focal gain is increased and S:P ratio decreased at both shallow and deep depth extremes for the 16 channel configuration. The 20 mm long transducer array configurations are also capable of producing more spatially localized foci and wider focal depth ranges compared to the 10 mm long array. However, when comparing the two 8 channel configurations, the smaller length array has lower S:P ratios at depths below ~ 8 cm, likely due to the smaller individual element sizes and less prominent grating-lobe related effects.
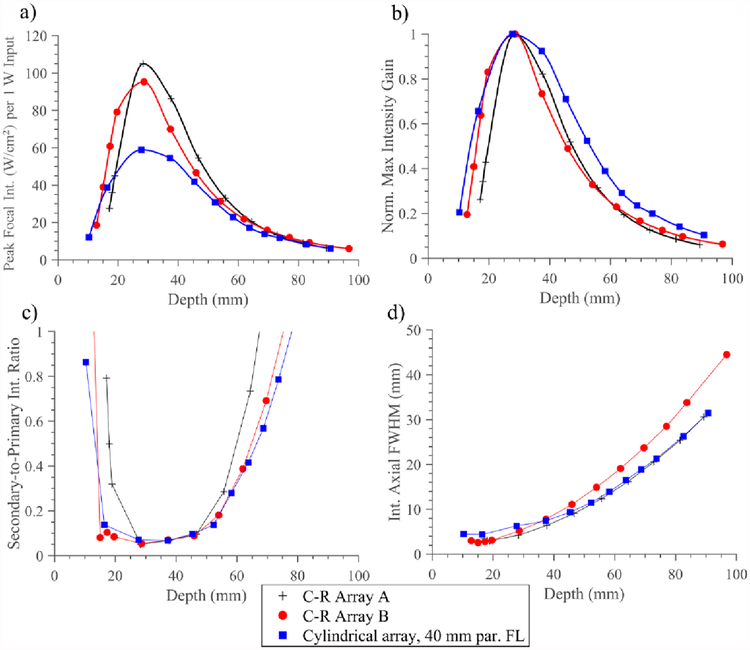
Comparisons between focusing and beam-steering performance of a select configuration of the deployable applicator assembly (8 element, 10 mm OD × 20 mm length array, 40 mm FL paraboloid reflector) and two concentric-ring (C-R) arrays with dimensions analogous to the paraboloid reflector are shown in figure 9. As shown in figure 9a), the C-R arrays and the proposed design demonstrate similar trends in the focal intensity achievable as a function of depth, with peaks around 30 mm. Both C-R arrays can produce higher focal intensities in the shallow to moderate depth range (~15–50 mm) for equal acoustic power input, while gradually converging to the deployable assembly with increasing focal depth. Figure 9b) shows each IGC individually normalized, indicating that the C-R arrays are narrower or peakier in focal gain over steering depths, as compared to the broader profile of the deployable assembly. Axial FWHM focal dimensions (figure 9d)) shows that the foci are longer (by ~2 mm) at shallower depths for the proposed design, but demonstrates close agreement to the larger C-R Array A at depths >50 mm, whereas C-R Array B focal dimensions are progressively longer with depth. In terms of steering selectivity, the S:P ratio (figure 9c)) demonstrates close agreement between the proposed design and C-R Array B, and a comparatively narrower selective steering range for C-R Array A.
Figure 9.
Performance metrics for acoustic simulations comparing a select configuration of the deployable applicator assembly (8 elements, 10 mm OD × 20 mm length 1.5 MHz cylindrical array, 40 mm FL paraboloid balloon reflector) with concentric-ring arrays A and B, both with 8 elements and dimensions comparable to the balloon reflector assembly (C-R Array A: 10/46.3 mm ID/OD, C-R array B: 14/42.3 mm ID/OD). Metrics include a) peak focal intensity, normalized by input acoustic power, b) individually normalized intensity gain curves, c) secondary-to-primary intensity ratio as a measure of beam focusing selectivity, and d) axial FWHM of focus as indicator of focal dimensions, all as a function of depth.
Simulated thermal dosimetry and heating performance:
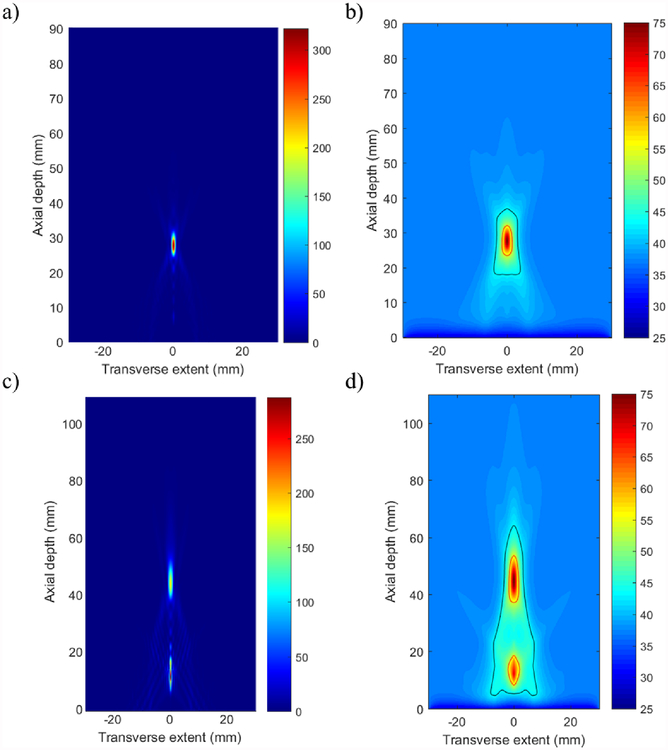
Figure 10 shows representative simulated intensity and resultant temperature distributions in the endoluminal tissue heating model for the 8 element × 20 mm long cylindrical transducer array within a paraboloid reflector with a geometric FL of 25 mm. Electronic steering to depths close to the geometric focus of the reflector resulted in localized and selective thermal lesions with limited pre-focal or post-focal hotspots, as represented by figure 10(a–b) for focusing set to 30 mm depth. Phase settings for very shallow or deep focusing relative to the geometric focus of the paraboloid reflector resulted in secondary hotspot formation either distal or proximal to the main focus, respectively, as shown in figure 10(c–d) for focusing set to 50 mm depth.
Figure 10.
Example (a,c) acoustic intensity (W/cm2) and (b,d) temperature (°C) distributions in tissue generated by the deployable applicator design (25 mm paraboloid reflector FL, 8 element × 20 mm long × 10 mm OD array, 1.5 MHz) for 30 s sonications. Applied phase settings for focusing at 30 mm (a-b) produced localized focusing and thermal lesion formation, and phase settings for 50 mm produced (c-d) more diffuse focusing and secondary hot-spot lesion formation. Red contour – 240 EM43°C; black contour - 43°C.
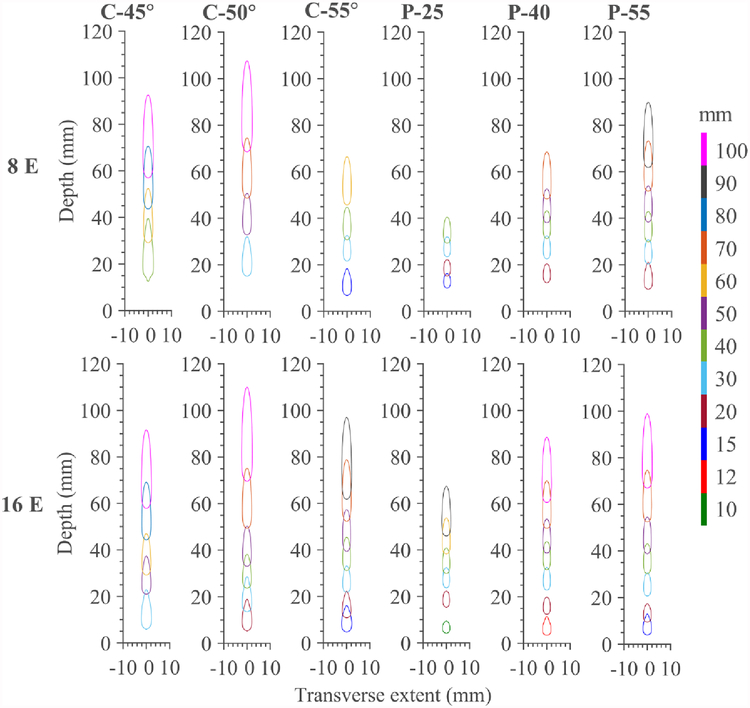
Compilations of the thermal lesions produced by the two applicator configurations (8 or 16 elements × 20 mm long array) in combination with each of the six investigated reflector geometries are shown in figure 11. The 240 EM43°C contours are illustrated for corresponding focal depths and phase settings that produced single isolated thermal lesions with no significant secondary hotspots (>240 EM43°C). These contours are thus indicative of the range in depth for which each applicator – reflector configuration can produce localized thermal lesions, for the settings (sonication duration and maximum temperature) explored herein. These approximate ranges are reported for each applicator-reflector configuration in table 3.
Figure 11.
Compilation of lethal contours (240 EM43°C) for endoluminal soft tissue ablation for 30 s sonications as a function of reflector geometry and number of cylindrical transducer array elements (1.5 MHz, 10 mm OD, 20 mm length, 8 or 16 array elements). Contours are shown only for applied phase settings resulting in selective, singular thermal lesions, with no substantial secondary hotpots, thus demonstrating the effective steering range for each transducer array – reflector pairing. Each colored contour represents distinct phase settings and focal pattern, with the target focal depth (mm) for the applied phase settings color coordinated according to the legend. Abbreviations: C – conical reflector, P – paraboloid reflector, E – array elements.
Table 3.
Approximate focal depth range for generating localized thermal lesions (>240EM43°C) without secondary hotspots, as a function of transducer configuration (1.5 MHz, 10 mm OD × 20 mm length, 8–16 elements) and reflector geometry.
| Effective focal depth range (mm) per reflector geometry | ||||||
|---|---|---|---|---|---|---|
| Array configuration |
45° Cone | 50° Cone | 55° Cone | Paraboloid 25 mm FL |
Paraboloid 40 mm FL |
Paraboloid 55 mm FL |
| 8 element array | 10–95 mm | 15–110 mm | 7–70 mm | 10–45 mm | 10–70 mm | 10–95 mm |
| 16 element array | 5–95 mm | 5–115 mm | 5–100 mm | 5–70 mm | 5–90 mm | 5–100 mm |
As shown in figure 11, the 16 element array is capable of wider depth steering ranges with all reflector geometries compared to the 8 element array. The more focal paraboloid reflectors produced smaller lesions but have more limited steering range in depth, whereas the conical reflectors with ϕ = 45°,50° demonstrated longer steering ranges, particularly at depths > 40 mm, and larger lesion dimensions across all depths. For all configurations and reflectors, the transverse dimensions of the lesions have little variation along focal depth as compared to the longitudinal dimension.
Acoustic Performance of POC Device
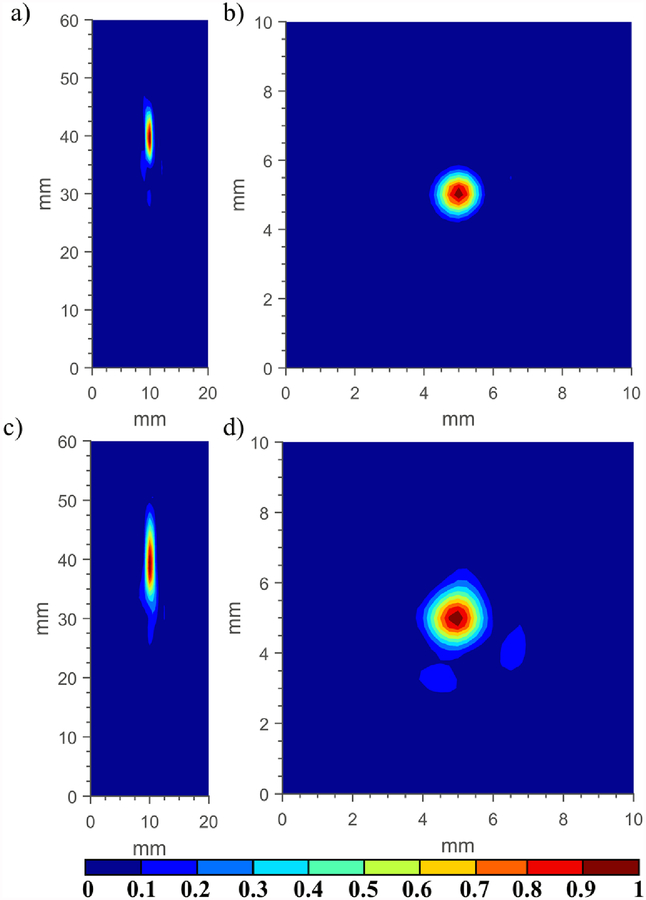
Longitudinal and transverse beam intensity distributions, as measured using a hydrophone in a tank of degassed and deionized water, are shown in figure 12 for the POC cylindrical phased array with a paraboloid reflector fixture (geometric focus of 40 mm) and for a conical 50° reflector fixture. Phase settings were applied to the array (8 element × 20 mm long) for both cases to produce a focus at 40 mm in depth. Clear foci are present at 40 mm in both cases, with the focus generated by the paraboloid reflector smaller in longitudinal and transverse dimensions, as predicted by simulations.
Figure 12.
Experimental measurements with a calibrated hydrophone depicting (a,c) longitudinal and (b,d) transverse normalized intensity distributions corresponding to the in-house fabricated POC applicator assembly paired with the (a,b) 40 mm FL paraboloid reflector fixture, and the (c,d) 50° conical reflector fixture, with applied phase settings to produce a focus at 40 mm in depth.
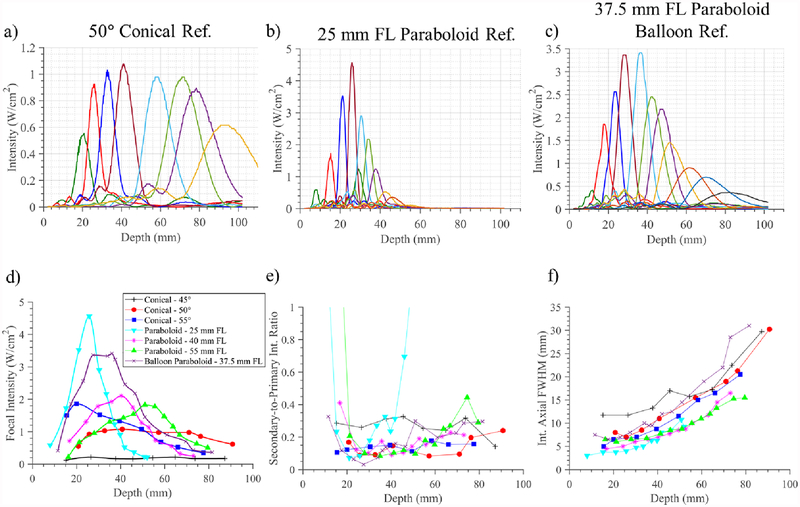
Intensity measurements along the central axial axis were acquired for each reflector fixture and the multi-compartment balloon as the phase settings for the POC array were adjusted across a range of focal depths. These compilations of 1D central axial intensity profiles are shown for select reflector configurations in figure 13(a–c), demonstrating electronic steering of the focus in depth with each reflector geometry. The interpolated peak focal intensities, axial focal FWHM dimensions, and S:P intensity ratios all as a function of focal depth were compiled for each experimental reflector assembly, and shown in figure 13(d–g). The steering ranges in depth and focal intensity magnitudes obtained with each reflector indicate that the more focal paraboloid reflectors demonstrate greater peak intensities and smaller FWHM focal dimensions but progressively more limited steering ranges, and track the same trends predicted from simulations. Peak focal magnitudes occurred at or near the geometric focal length for each of the paraboloid reflectors. The 50° cone exhibited the greatest steering range and most uniform peak intensities over depth, while the 45° cone exhibited a wide range but irregular trends and low focal intensity magnitudes over depth. The 55° cone demonstrated greater focusing capabilities at shallower depths as compared to the 45 and 50° cones, but a more limited steering range in depth.
Figure 13.
a-c) Compilation of hydrophone measurements of central axial intensity distributions for the experimental applicator assembly with selected input phase settings applied to electronically steer the focus in depth, as paired with a) 50° conical and b) 25 mm FL paraboloid 3D printed reflector fixtures, and c) 37.5 mm FL paraboloid multi-compartment balloon assembly. Each distinct color trace corresponds to distinct applied phase settings and central axial intensity distribution. Compilations of the d) interpolated focal intensity, e) secondary-to-primary intensity ratio, and f) axial FWHM dimensions of the focus, all as a function of depth, are compiled for the six 3D printed reflector fixtures and single multi-compartment balloon assembly.
Hydrophone measurements of the prototype deployable assembly with a multi-compartment paraboloid balloon reflector (figure 13(c–f)) demonstrate focal steering capabilities in depth from ~15–80 mm, with focal intensity magnitudes commensurate with the 3D printed reflector fixtures, and maximized at 36 mm focal depth. Axial FWHM focal dimensions varied from 6.5–31 mm over the 15–80 mm steering depth range, and S:P intensity ratio was <0.2 across ~15–50 mm steering depth range.
Force balance measurements of acoustic output power capabilities of the POC assembly within the 40 mm FL paraboloid reflector fixture were performed at high-power levels beyond those used for the hydrophone measurements. Based upon these measurements the assembly was capable of generating > 75 times the acoustic power produced during hydrophone measurements, and thus with scaling of power corresponds to generating focal intensities > 7.5–300 W/cm2, depending on the reflector and applied phase settings.
Discussion:
This study has investigated a novel design concept for a forward- or end-firing deployable ultrasound phased array applicator that can be delivered endoluminally or laparoscopically in a compact form and expanded near the target site to provide enhanced therapy delivery and capabilities. The applicator combines a 1D cylindrical phased array within a fixed shape expandable balloon-reflector, which once deployed provides a larger effective aperture with electronic focusing and steering in depth. The transducer-reflector design mimics the focal steering capabilities of a larger diameter concentric ring phased array, as applied for extracorporeal HIFU or intracavitary use (Cain and Umemura 1986, Chapelon et al. 1993, Chapelon et al. 1999, Fjield et al. 1996), with inherent geometric focusing determined by the expandable reflector geometry. Theoretical simulations and preliminary experimental investigations herein have confirmed the feasibility of the design concept, and demonstrated that practical steering ranges and depths (<10 cm) for endoluminal or laparoscopic applications can be achieved using 1.5 MHz arrays with only 8–16 elements.
The combination of a single-element cylindrical transducer source with a rigid paraboloid reflector of fixed dimensions has been previously investigated, specific for extracorporeal ablation of kidney tumors (Köhrmann et al. 2002, Köhrmann et al. 2002, Marberger et al. 2005). In our work, a parametric analysis of this simplified assembly configuration, in terms of the constituent transducer and reflector geometry and dimensions, and at scales appropriate for endoluminal or laparoscopic device delivery, was performed. While incorporating only a single element transducer, the trends in focal gain and dimensions derived from this analysis, as detailed in figure 6, can be extended to the phased array configurations. In particular, to achieve narrower focusing and higher gain magnitudes for a set operating frequency, it is necessary to increase the effective aperture of the reflector as defined by the reflector surface that is exposed to and redirecting acoustic energy. This can be achieved by increasing the offset spacing between the transducer and reflector, which intrinsically results in a larger reflector diameter and overall surface area, or by increasing the length of the transducer array so that a larger reflector extent is exposed to acoustic energy. In contrast, increasing the diameter of the cylindrical source does not significantly affect the focal dimensions, nor the peak focal intensity magnitude when normalized by input power to the transducer. This is significant, in that for catheter-based ultrasound the transducer diameter roughly defines the dimension of the device during insertion, so small diameter arrays with much larger deployable reflector balloons could be employed without a loss of performance. However, using a larger transducer source could still be advantageous due to its greater power handling capabilities. For some transducer – reflector configurations shown in figure 6, the general trend of focal intensity increasing as depth decreases is violated at very shallow focal depths (<~5 mm). This is likely caused by the central transducer and housing fixture interfering with acoustic energy reflected off the proximal portion of the paraboloid reflector, for cases where spacing between transducer and reflector is very small, as predicted by simple ray trace propagation. Increasing rG spacing can mitigate blocking, as shown in figure 6(g), and although longer transducers are more susceptible to blocking issues, such effects generally appear negligible for the configurations explored herein with reflector geometries of focal depths beyond ~10 mm.
When integrating a phased array transducer source, the resultant electronic steering in depth and focusing capabilities were highly dependent on the reflector geometry, array length, and array subdivision. As shown in figure 7, more convergent (i.e., shorter geometric focus) reflector geometries required fewer array elements in order to approach maximum focal gain magnitudes. This advantage is analogous to performance differences between flat and curved concentric ring transducer arrays, with the latter requiring fewer array elements due to geometric focusing and the minimized requisite phase shift across the array surface (Chapelon et al. 1993). It is also notable that even with very high array discretization (64 elements), focal magnitudes between reflector geometries remained disparate, with the 40 and 25 mm FL paraboloids capable of >2–2.5 times intensity gain of the least-convergent 45° conical reflector (figure 7). However, these discrepancies in focal gain between the various reflector geometries are expected to vary as the phased focal depth is adjusted, as shown in figure 8. Simulations show that while the paraboloid reflector geometries were capable of tighter focusing and greater focal gain compared to the conical geometries (figure 8, column 1), the steering range, as approximated by the range of depths with low S:P ratio, was longest for the less focused 45° and 50° conical reflectors and diminished with more convergent and shallow-focusing reflector geometries (figure 8, column 2). For a practical 8 element, 20 mm long array configuration, the focusing depth range of various configurations for which the S:P ratio was below 0.2 was approximately 30–100 mm, 25–100 mm, and 15–50 mm for the conical 45°, 50°, and 55° reflectors, respectively, and 10–30 mm, 15–55 mm, and 25–75 mm for the paraboloid reflectors with geometric FLs of 25, 40, and 55 mm, respectively (figure 8(b)). Hence, long steering depth ranges can be achieved with relatively few array elements. The steering range was enhanced for all reflector configurations by increasing the subdivision of the array (figure 8(e,k)), resulting in greater focal gains and reduced focal dimensions at shallow and deep depth extremes. Comparative acoustic simulations (figure 9) demonstrate that, while there is not exact performance agreement, the deployable applicator design is capable of similar axial focusing and steering ranges as conventional concentric ring arrays with spherical-bowl geometries and fixed dimensions based on the footprint of the reflector balloon. The discrepancies in focal intensity magnitude and axial focal FWHM dimensions around the peak focal depth could be caused by differences in wave emission profiles for the explored spherically-curved and cylindrical-paraboloid geometries. Possible interference between reflected energy and the central transducer array fixture may also contribute to differences for shallower focal lengths.
Experimental characterizations of the POC 8 element array applicator assembly confirmed the capability of the proposed applicator design to electronically focus in depth, and matched expected trends from simulation in terms of relative differences in focal magnitudes, dimensions, and steering depth ranges between reflector geometries (figures 12,13). Performance of the multi-compartment balloon reflector was comparable to the 3D-printed reflectors – higher focal peak intensities were obtained using the balloon compared to the 40 mm FL paraboloid fixture, while axial FWHM were increasingly higher across depth by 2–10 mm. These differences are likely due to the greater reflection efficiency at the water-air interface in the balloon and its smaller diameter compared to the fixture. In comparing measurements of the experimental reflector fixtures and the most analogous simulation series (figure 8a–c), axial FWHM of the experimental foci were smaller by up to ~30% across all reflector geometries, whereas the depth range of S:P ratio < 0.2 was reduced by ~20% for most reflector configurations as compared to simulation. Some of these differences could be attributed to the larger reflector geometries used in experiments (rG = 5 vs. rG = 2 for simulations). More significant deviations were seen in the 45° conical reflector – whereas simulations predicted smoothly varying focal intensity magnitudes and low S:P ratio < 0.2 at depths above 30 mm, greater irregularity in focal magnitudes and higher (~0.3) S:P ratio across depths was measured experimentally. These discrepancies may be caused by the greater sensitivity of lesser-focused reflector geometries to geometrical or angular misalignment between the cylindrical source and reflector, as predicted from ray trace analysis. Other general discrepancies between theory and experiment could be potentially attributable to geometric tolerance or reflectivity of the multi-compartment balloon or 3D-printed reflectors, the lower phase resolution and possible phase and RF power errors of driving signals applied for experiment, as well as non-ideal transducer operation including cross-talk and mechanical coupling between elements and non-uniform vibration amplitude across and around the array surfaces. While the partial sectoring method for subdividing the PZT transducer into separate elements was employed herein to simplify fabrication, it is expected that arrays with fully separated transducer elements and complete acoustic/electrical isolation between elements could perform better by further mitigating inter-element cross-talk (Fjield et al. 1996). Use of piezocomposites could also potentially improve performance by mitigating inter-element acoustic coupling and non-thickness mode transducer vibrations (Chapelon et al. 2000, Fleury et al. 2003). Regardless of these possible issues, the non-ideal yet practical 8 element array tested herein within various reflector geometries and dimensions was shown to produce a range of focal dimensions (~4–32 mm axial length FWHM) and depths (~15 – 90 mm), with focal intensities of approximately 300 W/cm2 or greater possible, further demonstrating this approach is practical.
The deployable applicator design was shown through biothermal simulations to generate localized heating and ablation zones across a large range of target depths, with performance and steering depth ranges heavily influenced by reflector geometry (figures 10,11, table 3). As anticipated from the acoustic parametric analysis, paraboloid reflector configurations were capable of much more spatially localized thermal lesions as compared to the conical reflector geometries, with the depths and range proportional to the geometric FL of the paraboloid. Based off simulation results, each reflector has specific merits and thus choice of the “best” or optimal reflector geometry would be situation dependent. For very small and shallow tissue targets, where capability to deliver highly conformal and selective energy exposure at high intensities is desired, a paraboloid reflector with shallow geometric focus could be preferred. General purpose usage with good combination of selectivity and steering depth (10–100 mm) can be achieved with lesser focused paraboloids reflectors (e.g., 55 mm FL). For greater volumetric coverage, e.g., ablation of large targets, a conical reflector could be advantageous due to inherent larger focal dimensions. A potential disadvantage of the less convergent reflectors (i.e, the 45° conical) is that compared to the more focused reflector geometries, they are more susceptible to pre-focal heating at deep focal depths due to the lower focal gain. Further, when focusing at shallow extremes (< 30 mm) using the 45° conical reflector with 8 element transducer array, off-axis heating (ΔT > 8°C) separate from the main central axial heating distribution occurred (data not shown). This is likely caused by grating lobes, as it is reduced for the 16 element array configuration, as well as for more focal conical and paraboloid reflector geometries. It should be noted that the emphasis of the thermal ablation simulations performed in this study was on demonstration of localized heating at target depths, and hence applied power, duration, and temperature set-points were explicitly chosen for this purpose. More volumetric heating could be achieved by adjusting these parameters appropriately (i.e., longer duration, higher set-point temperature, broader focal patterns). Thermal distributions could also be further modulated by alternative (e.g., multi-focal) phasing strategies, selectively turning off array sub-elements, or by incorporating alternative reflector balloon geometries.
There may be several advantages to utilizing phased arrays and electronic focusing for the deployable assembly as opposed to the fluid-lens based focusing mechanism previously investigated by our group (Adams et al. 2017). The phased array design will inherently be capable of more complex beam patterns and faster switching of patterns for scanning operations, and has a more robust focusing mechanism, without a reliance on moving or distending components. The deployable phased array configuration also permits a simpler two-compartment reflector balloon design, which while incorporating precise balloon-reflector geometry, was shown feasible herein and in other applicator designs developed for intracardiac atrial fibrillation (Meininger et al. 2003, Schmidt et al. 2007, Nakagawa et al. 2007). High geometrical fidelity of the inflated and pressurized balloon reflector may be critical for precise reproduction of the focal patterns simulated herein, and could be compromised by distortion caused by manufacturing tolerances or balloon collapse/inflation conditions in practice. However, it is possible that lesser degrees of geometrical imperfection or distortion could be partially compensated for by adjusting individual element phase settings; future studies will investigate this capacity as well as the tolerance of the deployable applicator’s performance to progressive degrees of geometric reflector distortion.
In consideration of further investigation and development, there are many potential applications for the proposed deployable applicator design. In particular, endoluminal deployment within sites such as the stomach or GI tract could be utilized for delivering acoustic energy to targets in the pancreas, liver, or kidney, among others. In comparison to fixed-focus and rigid fixed-dimension intracavitary HIFU devices (Klingler et al. 2008, Uchida et al. 2006, Li et al. 2015), once inserted and deployed the phased array and expandable balloon reflector configurations can treat more precisely and deeper under dynamic electronic control. For endoluminal applications tip articulation mechanisms, as incorporated on endoscopes, could be integrated into the applicator assembly to facilitate device delivery, positioning, and mechanical translation of the beam post-deployment to increase treatment volumes. Laparoscopic access through 6–10 mm ports for delivery and then deployment of the balloon could be a preferred pathway for targeting tissues from insertion within the abdominal cavity, such as fibroids, pancreas, or renal tumors. The applicator design could also be compatible with typical image-guided techniques, e.g. MRI or ultrasound, for device and target localization and therapy monitoring. Furthermore, deployable applicator assemblies with 2D cylindrical arrays, with subdivision along the angular extent in addition to length, could be investigated as a means to approximate a combined concentric-ring sector-vortex array, which could provide additional beam forming capabilities for enhanced volumetric coverage and control (Cain and Umemura 1986, Fjield and Hynynen 1997).
Conclusion
A novel design concept for an end-firing deployable therapeutic ultrasound applicator with a 1D phased cylindrical transducer array and pre-shaped expandable balloon-based acoustic reflector has been introduced. Acoustic and biothermal simulations were used to characterize the proposed design as a function of practical transducer array dimensions (4–10 mm OD, 10–20 mm length) and balloon-reflector geometry (inflated OD 20–60 mm), and demonstrated its capability to focus and generate localized thermal lesions across 5–100 mm depths in tissue, with steering range and focal distributions heavily modulated by reflector geometry. Validation of the design concept and simulation trends was performed through acoustic measurements of experimental prototype applicator assemblies. Future experimental development and evaluations of applicator prototypes are warranted for endoluminal and laparoscopic interventional applications.
Acknowledgments
This work was supported by National Institutes of Health NIBIB grant R01EB025990 and NCI grant R21CA230120.
References
- Adams MS, Salgaonkar v A, Plata-Camargo J, Jones PD, Pascal-Tenorio A, Chen H, Bouley DM, Sommer G, Pauly KB and Diederich CJ 2016. Endoluminal ultrasound applicators for MR-guided thermal ablation of pancreatic tumors: Preliminary design and evaluation in a porcine pancreas model Med. Phys 43 4184–4197. [DOI] [PMC free article] [PubMed] [Google Scholar]
- Adams MS, Salgaonkar v A, Scott SJ, Sommer G and Diederich CJ 2017. Integration of deployable fluid lenses and reflectors with endoluminal therapeutic ultrasound applicators: Preliminary investigations of enhanced penetration depth and focal gain Med. Phys 44 5339–5356. [DOI] [PMC free article] [PubMed] [Google Scholar]
- Adams MS, Salgaonkar v A, Sommer G and Diederich CJ 2017. Endoluminal ultrasound applicator configurations utilizing deployable arrays, reflectors and lenses to augment and dynamically adjust treatment volume, gain, and depth Proc. SPIE 10066 9. [Google Scholar]
- Adams MS, Scott SJ, Salgaonkar v A, Sommer G and Diederich CJ 2016. Thermal therapy of pancreatic tumours using endoluminal ultrasound: Parametric and patient-specific modelling Int. J. Hyperthermia 32 97–111. [DOI] [PMC free article] [PubMed] [Google Scholar]
- Bessiere F, N’djin WA, Colas EC, Chavrier F, Greillier P, Chapelon JY, Chevalier P and Lafon C 2016. Ultrasound-guided transesophageal high-intensity focused ultrasound cardiac ablation in a beating heart: A pilot feasibility study in pigs Ultrasound Med. Biol 42 1848–1861. [DOI] [PubMed] [Google Scholar]
- Burtnyk M, Chopra R and Bronskill M 2010. Simulation study on the heating of the surrounding anatomy during transurethral ultrasound prostate therapy: A 3D theoretical analysis of patient safety Med. Phys 37 2862–2875. [DOI] [PubMed] [Google Scholar]
- Cain CA and Umemura S 1986. Concentric-Ring and Sector-Vortex Phased-Array Applicators for Ultrasound Hyperthermia IEEE Trans. Microw. Theory Tech 34 542–551. [Google Scholar]
- Chapelon JY, Ribault M, Birer A, Vernier F, Souchon R and Gelet A 1999. Treatment of localised prostate cancer with transrectal high intensity focused ultrasound Eur. J. Ultrasound 9 31–38. [DOI] [PubMed] [Google Scholar]
- Chapelon J, Cathignol D, Cain C, Ebbini E, Kluiwstra J, Sapozhnikov OA, Fleury G, Berriet R, Chupin L and Guey J 2000. New piezoelectric transducers for therapeutic ultrasound Ultrasound Med. Biol 26 153–159. [DOI] [PubMed] [Google Scholar]
- Chin JL, Billia M, Relle J, Roethke MC, Popeneciu IV, Kuru TH, Hatiboglu G, Mueller-Wolf MB, Motsch J and Romagnoli C 2016. Magnetic Resonance Imaging–Guided Transurethral Ultrasound Ablation of Prostate Tissue in Patients with Localized Prostate Cancer: A Prospective Phase 1 Clinical Trial Eur. Urol 70 447–455. [DOI] [PubMed] [Google Scholar]
- Chopra R, Burtnyk M, N’Djin WA and Bronskill M 2010. MRI-controlled transurethral ultrasound therapy for localised prostate cancer Int. J. Hyperthermia 26 804–821. [DOI] [PubMed] [Google Scholar]
- Christopher T 2005. HIFU focusing efficiency and a twin annular array source for prostate treatment IEEE Trans. Ultrason. Ferroelectr. Freq. Control 52 1523–1533. [DOI] [PubMed] [Google Scholar]
- Constanciel E, N’Djin WA, Bessiere F, Chavrier F, Grinberg D, Vignot A, Chevalier P, Chapelon JY and Lafon C 2013. Design and evaluation of a transesophageal HIFU probe for ultrasound-guided cardiac ablation: simulation of a HIFU mini-maze procedure and preliminary ex vivo trials IEEE Trans. Ultrason. Ferroelectr. Freq. Control 60 1868–1883. [DOI] [PubMed] [Google Scholar]
- Dewey WC 2009. Arrhenius relationships from the molecule and cell to the clinic Int. J. Hyperthermia 25 3–20. [DOI] [PubMed] [Google Scholar]
- Diederich CJ 1996. Ultrasound applicators with integrated catheter-cooling for interstitial hyperthermia: Theory and preliminary experiments Int. J. Hyperthermia 12 279–297. [DOI] [PubMed] [Google Scholar]
- Diederich CJ and Hynynen K 1990. The development of intracavitary ultrasonic applicators for hyperthermia: A design and experimental study Med. Phys 17 626–634. [DOI] [PubMed] [Google Scholar]
- Diederich CJ 2012. Endocavity and catheter-based ultrasound devices in Physics of Thermal Therapy: Fundamentals and Clinical Applications Taylor & Francis; 189–200. [Google Scholar]
- Diederich CJ 1990. The design and development of intracavitary ultrasound arrays for hyperthermia ProQuest Dissertations Publishing. [Google Scholar]
- El-Desouki MM and Hynynen K 2011. Driving circuitry for focused ultrasound noninvasive surgery and drug delivery applications Sensors 11 539–556. [DOI] [PMC free article] [PubMed] [Google Scholar]
- Fjield T, Fan X and Hynynen K 1996. A parametric study of the concentric‐ring transducer design for MRI guided ultrasound surgery J. Acoust. Soc. Am 100 1220–1230. [DOI] [PubMed] [Google Scholar]
- Fjield T and Hynynen K 1997. The combined concentric-ring and sector-vortex phased array for MRI guided ultrasound surgery IEEE Trans. Ultrason. Ferroelectr. Freq. Control 44 1157–1167. [Google Scholar]
- Fleury G, de Lima DM, Hynynen K, Berriet R, Le Baron O and Huguenin B 2003. New piezocomposite transducers for therapeutic ultrasound Proc. SPIE 4954 227–237. [Google Scholar]
- Duck Francis A. 2013. Physical Properties of Tissues: A Comprehensive Reference Book Academic press. [Google Scholar]
- Hardy JK 1979. High Frequency Circuit Design Reston Publishing Company Virginia. [Google Scholar]
- Hasgall PA, Di Gennaro F, Baumgartner C, Neufeld E, Lloyd B, Gosselin MC, Payne D, Klingenböck A and Kuster N 2018. IT’IS Database for thermal and electromagnetic parameters of biological tissues Version 4.0.
- Hynynen K and Jones RM 2016. Image-guided ultrasound phased arrays are a disruptive technology for non-invasive therapy Phys. Med. Biol 61 R206. [DOI] [PMC free article] [PubMed] [Google Scholar]
- Chapelon JY, Faure P, Plantier M, Cathignol D, Souchon R, Gorry F and Gelet A 1993. The feasibility of tissue ablation using high intensity electronically focused ultrasound IEEE Ultrasonics 2 1121. [Google Scholar]
- Kennedy JE 2005. High-intensity focused ultrasound in the treatment of solid tumours Nat. Rev. Cancer 5 321–327. [DOI] [PubMed] [Google Scholar]
- Klingler HC, Susani M, Seip R, Mauermann J, Sanghvi N and Marberger MJ 2008. A novel approach to energy ablative therapy of small renal tumours: laparoscopic high-intensity focused ultrasound Eur. Urol 53 810–818. [DOI] [PubMed] [Google Scholar]
- Köhrmann KU, Michel MS, Steidler A, Marlinghaus E, Kraut O and Alken P 2002. Technical characterization of an ultrasound source for noninvasive thermoablation by high‐intensity focused ultrasound BJU Int 90 248–252. [DOI] [PubMed] [Google Scholar]
- Köhrmann KU, Michel MS, Gaa J, Marlinghaus E and Alken P 2002. High intensity focused ultrasound as noninvasive therapy for multilocal renal cell carcinoma: case study and review of the literature J.Urol 167 2397–2403. [PubMed] [Google Scholar]
- Li T, Khokhlova T, Maloney E, Wang Y, D’Andrea S, Starr F, Farr N, Morrison K, Keilman G and Hwang JH 2015. Endoscopic high-intensity focused US: technical aspects and studies in an in vivo porcine model (with video) Gastrointest. Endosc 81 1243–1250. [DOI] [PMC free article] [PubMed] [Google Scholar]
- Lindner U, Ghai S, Spensieri P, Hlasny E, Van der Kwast Theodorus H, McCluskey SA, Haider MA, Kucharczyk W and Trachtenberg J 2012. Focal magnetic resonance guided focused ultrasound for prostate cancer: Initial North American experience Can. Urol. Assoc 6 E283. [DOI] [PMC free article] [PubMed] [Google Scholar]
- Marberger M, Schatzl G, Cranston D and Kennedy JE 2005. Extracorporeal ablation of renal tumours with high‐intensity focused ultrasound BJU Int 95 52–55. [DOI] [PubMed] [Google Scholar]
- Mast TD, Barthe PG, Makin IRS, Slayton MH, Karunakaran CP, Burgess MT, Alqadah A and Rudich SM 2011. Treatment of rabbit liver cancer in vivo using miniaturized image-ablate ultrasound arrays Ultrasound Med. Biol 37 1609–1621. [DOI] [PubMed] [Google Scholar]
- McDannold N, Hynynen K, Wolf D, Wolf G and Jolesz F 1998. MRI evaluation of thermal ablation of tumors with focused ultrasound J. Magn. Reson. Imaging 8 91–100. [DOI] [PubMed] [Google Scholar]
- Meininger GR, Calkins H, Lickfett L, Lopath P, Fjield T, Pacheco R, Harhen P, Rodriguez ER, Berger R and Halperin H 2003. Initial experience with a novel focused ultrasound ablation system for ring ablation outside the pulmonary vein J. Interv. Card. Electrophysiol 8 141–148. [DOI] [PubMed] [Google Scholar]
- Melodelima D, Salomir R, Mougenot C, Moonen C and Cathignol D 2006. 64‐element intraluminal ultrasound cylindrical phased array for transesophageal thermal ablation under fast MR temperature mapping: An ex vivo study Med. Phys 33 2926–2934. [DOI] [PMC free article] [PubMed] [Google Scholar]
- Nakagawa H, Antz M, Wong T, Schmidt B, Ernst S, Ouyang F, Vogtmann T, Wu R, Yokoyama K and Lockwood D 2007. Initial Experience Using a Forward Directed, High‐Intensity Focused Ultrasound Balloon Catheter for Pulmonary Vein Antrum Isolation in Patients with Atrial Fibrillation J. Cardiovasc. Electrophysiol 18 136–144. [DOI] [PubMed] [Google Scholar]
- Pennes HH 1948. Analysis of tissue and arterial blood temperatures in the resting human forearm J. Appl. Physiol 1 93–122. [DOI] [PubMed] [Google Scholar]
- Pichardo S and Hynynen K 2009. New design for an endoesophageal sector-based array for the treatment of atrial fibrillation: a parametric simulation study IEEE Trans. Ultrason. Ferroelectr. Freq. Control 56 600–612. [DOI] [PubMed] [Google Scholar]
- Prakash P and Diederich CJ 2012. Considerations for theoretical modelling of thermal ablation with catheter-based ultrasonic sources: Implications for treatment planning, monitoring and control Int. J. Hyperthermia 28 69–86. [DOI] [PMC free article] [PubMed] [Google Scholar]
- Salgaonkar v A and Diederich CJ 2015. Catheter-based ultrasound technology for image-guided thermal therapy: Current technology and applications Int. J. Hyperthermia 31 203–215. [DOI] [PMC free article] [PubMed] [Google Scholar]
- Salgaonkar v A, Prakash P, Rieke V, Ozhinsky E, Plata J, Kurhanewicz J, Hsu IJ and Diederich CJ 2014. Model‐based feasibility assessment and evaluation of prostate hyperthermia with a commercial MR‐guided endorectal HIFU ablation array Med. Phys 41. [DOI] [PMC free article] [PubMed] [Google Scholar]
- Sapareto SA and Dewey WC 1984. Thermal dose determination in cancer therapy Int. J. Radiat. Oncol. Biol. Phys 10 787–800. [DOI] [PubMed] [Google Scholar]
- Schmidt B, Antz M, Ernst S, Ouyang F, Falk P, Chun JK and Kuck K 2007. Pulmonary vein isolation by high-intensity focused ultrasound: first-in-man study with a steerable balloon catheter Heart Rhythm 4 575–584. [DOI] [PubMed] [Google Scholar]
- Seip R, Chen W, Carlson R, Frizzell L, Warren G, Smith N, Saleh K, Gerber G, Shung K and Guo H 2005. Annular and Cylindrical Phased Array Geometries for Transrectal High‐Intensity Focused Ultrasound (HIFU) using PZT and Piezocomposite Materials AIP Conf. Proc 754 229–232. [Google Scholar]
- Sinelnikov YD, Fjield T and Sapozhnikov OA 2009. The mechanism of lesion formation by focused ultrasound ablation catheter for treatment of atrial fibrillation Acoust. Phys 55 647–656. [DOI] [PMC free article] [PubMed] [Google Scholar]
- Stewart HF 1982. Ultrasonic measurement techniques and equipment output levels in Essentials of Medical Ultrasound Clifton, New Jersey: Humana; 77–116. [Google Scholar]
- Tan JS, Frizzell LA, Sanghvi N, Wu S, Seip R and Kouzmanoff JT 2001. Ultrasound phased arrays for prostate treatment J. Acoust. Soc. Am 109 3055–3064. [DOI] [PubMed] [Google Scholar]
- Uchida T, Ohkusa H, Yamashita H, Shoji S, Nagata Y, Hyodo T and Satoh T 2006. Five years experience of transrectal high‐intensity focused ultrasound using the Sonablate device in the treatment of localized prostate cancer Int. J. Urol 13 228–233. [DOI] [PubMed] [Google Scholar]
- Wootton JH, Hsu IJ and Diederich CJ 2011. Endocervical ultrasound applicator for integrated hyperthermia and HDR brachytherapy in the treatment of locally advanced cervical carcinoma Med. Phys 38 598–611. [DOI] [PMC free article] [PubMed] [Google Scholar]
- Yarmolenko PS, Moon EJ, Landon C, Manzoor A, Hochman DW, Viglianti BL and Dewhirst MW 2011. Thresholds for thermal damage to normal tissues: an update Int. J. Hyperthermia 27 320–343. [DOI] [PMC free article] [PubMed] [Google Scholar]


