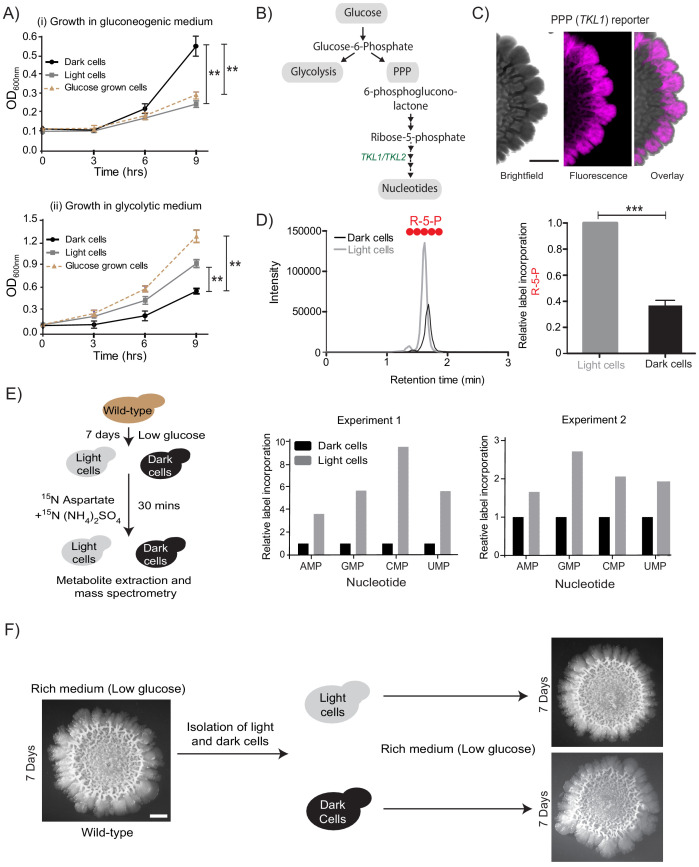
Figure 2. Cells organize into spatially restricted, contrary metabolic states within the colony.
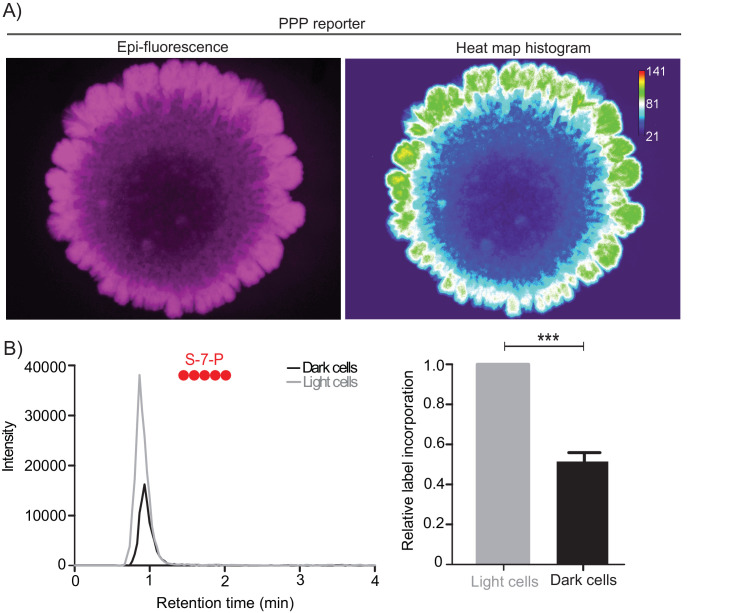
(A) Comparative immediate growth of isolated light cells and dark cells, transferred to a ‘gluconeogenic medium’ (2% ethanol as carbon source), or a ‘glycolytic medium’ (2% glucose as carbon source), based on increased absorbance (OD600) in culture. Wild-type cells growing in liquid medium (2% glucose) in log phase (i.e. in a glycolytic state) were used as controls for growth comparison (n = 3). (B) A schematic showing metabolic flow in glycolysis and the pentose phosphate pathway (PPP), and also illustrating the synthesis of nucleotides (dependent upon pentose phosphate pathway). TKL1 controls an important step in the PPP, and is strongly induced during high PPP flux. (C) Spatial distribution of mCherry fluorescence across a colony, based on the activity of a PPP- dependent reporter. Scale bar: 2 mm. Also see Figure 1—figure supplement 1A and Figure 2—figure supplement 1A. (D) LC-MS/MS based metabolite analysis, using exogenously added 13C Glucose, to compare flux of 13C Glucose into the PPP metabolite ribulose-5-phosphate (R-5-P), in light and dark cells. The red circles represent 13C labeled carbon atoms (n = 3). Also see Figure 2—figure supplement 1B. (E) Comparative metabolic-flux based analysis comparing 15N incorporation into newly synthesized nucleotides, in dark and light cells. Also see S2, and Materials and methods. (F) Light cells and dark cells isolated from a 7 day old wild-type complex colony re-form indistinguishable mature colonies when re-seeded onto fresh agar plates, and allowed to develop for 7 days. Scale bar = 2 mm. Statistical significance was calculated using unpaired t test (*** indicates p<0.001, ** indicates p<0.01) and error bars represent standard deviation.


