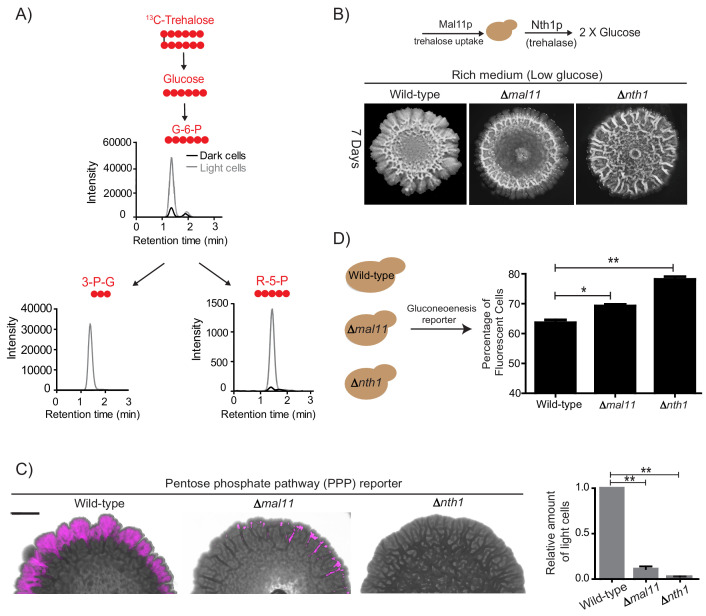
Figure 5. Trehalose uptake and utilization determines the existence of light cells.
(A) Estimation of trehalose uptake and breakdown/utilization in light and dark cells. LC-MS/MS based metabolite analysis, using exogenously added 13C Trehalose, to compare breakdown and utilization of 13C Trehalose for glycolysis and the PPP, in light and dark cells. The red circles represent 13C labeled carbon atoms. Data for 13C labeled glycolytic and PPP intermediates (derived from trehalose) are shown. The data presented is from a single flux experiment, which was repeated independently (with different colonies) twice (n = 2). Also see Figure 5—figure supplement 1A. (B) Comparative development of wild-type colonies (same image used in Figure 1A) with colonies lacking the major trehalose transporter (∆mal11), or the intracellular neutral trehalase (∆nth1). Colonies are shown after 7 days of development. Scale bar: 2 mm. (C) Visualization (left panel) and quantification (right bar graphs) of light cells in wild-type (same image used in Figure 2C), ∆mal11, or ∆nth1 cells, based on fluorescence emission dependent upon the PPP reporter activity. The quantification is based on flow cytometry data (n = 3). Scale bar: 2 mm. (D) Estimate of the percentage of gluconeogenic cells in wild-type, ∆mal11 and ∆nth1 (strains that cannot up-take or breakdown trehalose). This was based on quantifying the expression of the gluconeogenesis reporter plasmid (pPCK1-mCherry), expressed in all these cells. Cells from the entire colony were isolated and percentage of fluorescent cells (i.e. cells expressing the gluconeogenic reporter) in each colony was calculated by analyzing the samples by flow cytometry (n = 3). Statistical significance was calculated using unpaired t test (* indicates p<0.05, ** indicates p<0.01) and error bars represent standard deviation.


