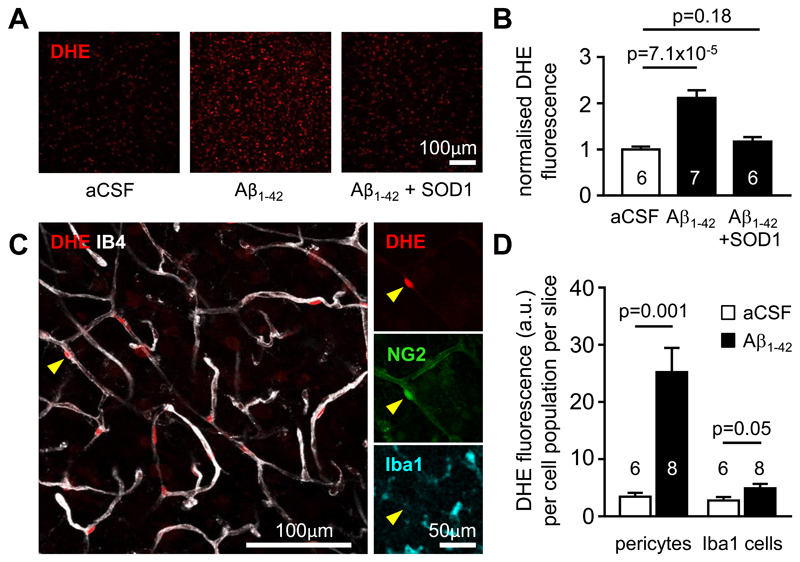
Figure 3. Aβ evokes ROS generation in pericytes.
(A) Fluorescence images of dihydroethidium (DHE) loaded rat cortical slices incubated in control aCSF or aCSF containing Aβ1-42 (72 nM) or Aβ1-42 + SOD1 (150 units/ml) for 40 min, showing that Aβ increases ROS level, and this is inhibited by SOD1. (B) Fluorescence (normalised to value in aCSF, mean±s.e.m.) of slices incubated in aCSF (n=6), Aβ1-42 (n=7) or Aβ1-42 + SOD1 (n=6). (C) Left: Image of a cortical slice showing that the brightest DHE-labeled cells are located on IB4-labeled blood vessels (arrowhead). Right: Immunolabeling shows that these cells colocalise with NG2, but not Iba1, implying that they are pericytes rather than microglia or perivascular macrophages. (D) Soma DHE fluorescence (arbitrary units (a.u.), mean±s.e.m.) from the population of pericytes, or of Iba1-labeled cells, after 40 mins in the absence or in the presence of Aβ1-42. Numbers on bars are slices (fluorescence was averaged across 3 image stacks for each slice).

