Abstract
There is an ongoing need for relevant animal models in which to test therapeutic interventions for infants with neurological sequelae of prematurity. The ferret is an attractive model species as it has a gyrified brain with a similar white-to-gray matter ratio as the human brain. A model of encephalopathy of prematurity was developed in postnatal-day (P) 10 ferret kits, which are considered to be developmentally equivalent to infants of 24–26 weeks’ gestation. Cross-fostered P10 ferret kits received 5mg/kg of LPS before undergoing consecutive hypoxia-hyperoxia-hypoxia (60min at 9%, 120min at 60%, 30min at 9%). Control animals received saline vehicle followed by normoxia. The development of basic reflexes (negative geotaxis, cliff aversion, and righting), as well as gait co-ordination on an automated catwalk, were assessed between P28 and P70, followed by ex vivo MRI and immunohistochemical analysis. Compared to controls, injured animals had slower overall reflex development between P28 and P40, as well as smaller hind paw areas consistent with “toe walking” at P42. Injured animals also displayed significantly greater lateral movement during catwalk assessment as a result of reduced gait co-ordination. Ex vivo MRI showed widespread white matter hyperintensity on T2-weighted imaging, as well as altered connectivity patterns. This coincided with white matter dysmaturation characterized by increased myelin basic protein staining intensity, white matter thinning, and loss of Olig2-positive cells. These results suggest both pathological and motor deficits consistent with premature white matter injury. This newborn ferret model can therefore provide an additional platform through which to assess potential therapies before translation to human clinical trials.
Keywords: prematurity, white matter injury, development, brain, neonatal
INTRODUCTION
There is an ongoing need for large animal models that reflect the pathophysiology of preterm brain injury in which therapeutic interventions for infants with neurological sequelae of prematurity can be tested. In 2016, 9.85% of infants born in the United States were premature, and for those born extremely preterm (<28 weeks’ gestation), around 50% will have a poor outcome.1–3 Preterm birth is commonly initiated by maternal infection (chorioamnionitis), and is also often associated with perinatal insults such as hypoxia and ischemia.4 Subsequently, intermittent iatrogenic hyperoxia is commonplace in the neonatal intensive care unit (NICU).5 These combined factors are thought to contribute to developmental and physiologic vulnerability of the brain, and result in or exacerbate the encephalopathy associated with poor developmental outcomes in preterm infants.5–7
Recently, because of the physical and developmental similarities that the ferret brain shares with the human brain, the ferret has emerged as an attractive species in which to model brain injury.8–11 Unlike rodents and rabbits, the ferret has a gyrencephalic cerebral cortex, and a ratio of white matter to gray matter that is more similar to the human brain. Ferrets are ideal candidates to model preterm brain injury as they are born lissencephalic, developing gyrencephalic brains postnatally. Postnatal white matter maturation and complex cortical folding in ferret kits also occur in a similar pattern to that observed in the human brain during the third trimester.12 This includes development of the cortical subplate (a transient scaffolding for the evolving cortex) that is prominent in human brain development, but minimal in rodents.13 At birth, ferret brain development is similar to a 13-week human fetus, with postnatal-day (P) 10 kits considered to be equivalent to an infant of 24–26 weeks’ gestation.12
We have previously examined the white matter and motor development in the newborn ferret, with preliminary data suggesting that a lipopolysaccharide (LPS)-sensitized hypoxic and hyperoxic insult could result in short-term inflammation in the P10 ferret brain, including activation of microglia and possible astrogliosis.11 Here, we describe the long-term behavioral and pathological outcomes of inflammation-sensitized hypoxic/hyperoxic brain injury in the P10 ferret as a model of encephalopathy of prematurity.
METHODS
Animals
Eight time-mated pregnant jills were acquired from Marshall BioResources (North Rose, NY, USA) at or before day 28 of gestation, and allowed to kindle naturally (typical gestation 41–42 days). Pregnant Jills were acquired in pairs, and kits were cross-fostered at P8–9 in order to balance litter sizes and sex distribution. Animals were maintained in a centralized vivarium, and had ad libitum access to food and water before and during experimental procedures. Standard housing ferret conditions included a 16-h light/8-h dark cycle with a room temperature range of 61–72 °F (16–22 °C), humidity of 30–70%, and 10–15 fresh air changes per hour. Procedures were performed in accordance with the NIH Guide for the Care and Use of Laboratory Animals and as part of an approved protocol by the University of Washington Institutional Animal Care and Use Committee.
Experimental procedure
On P10, cross-fostered ferret kits were randomized to receive an intraperitoneal 5mg/kg dose of LPS (from Escherichia coli O111:B4, List Biological, CA) or saline vehicle, before being returned to their jills for 4 h. LPS-injected animals were subsequently placed in a humidified chamber within a water bath, and underwent consecutive hypoxia, hyperoxia, and hypoxia (60min at 9% O2, 120min at 60% O2, 30min at 9% O2). Rectal temperature in a sentinel animal was monitored continuously throughout the insult (Precision 4000A thermometer, YSI, Yellow Springs, OH), with a target intra-hypoxic rectal temperature of 37°C. Saline controls received an identical period of normoxia, after which all animals were returned to their jills. A number of experimental protocols that did not produce any evidence of short-term injury were attempted in the development of the current approach. A summary of these is listed in Supplemental Table 1. The final protocol was developed based on this preliminary data as well as evidence from the preclinical literature. An LPS dose of 5mg/kg was chosen because preliminary experiments (Supplemental Table 1) showed greater histological injury in kits exposed to three doses of 5mg/kg LPS before hypoxia/hyperoxia compared to 2mg/kg LPS, but that 5mg/kg was similar to 10mg/kg (Supplemental Figure 1). A single LPS dose was then chosen due to concerns about potential pre-conditioning caused by multiple doses.11 A 4h time delay between LPS and hypoxia was used based on rodent literature, as this is the time frame associated with the greatest systemic inflammatory response, and sensitization of the brain to hypoxia-ischemia.14–16 A similar time course of inflammatory activation after LPS exposure has been shown in isolated ferret peripheral blood mononuclear cells.17 The resulting final protocol published here was the first to show sustained pathological and neurobehavioral deficits in exposed P10 ferret kits. The resulting final protocol published here was the first to show sustained pathological and neurobehavioral deficits in exposed P10 ferret kits. One iteration of the protocol (3 doses of LPS every 12h at P9–10 before 45 mins at 6% oxygen and 6 h at 100% oxygen) was included in a previous publication.11
Early behavioral testing
Beginning on P28, kits underwent reflex testing three times per week until P40. This included negative geotaxis (NG), cliff aversion (CA), and righting reflex (RR), as previously described. Briefly, NG was performed on inclined planes at 45°. Kits were placed head-down in the middle of the plane, and time to rotate 90° and 180° was recorded. For CA, kits were placed with both front paws on the edge of a shelf. Time to spontaneously retreat away from the edge and rotate away was recorded. In the RR, animals were placed on their backs, and time to righting recorded. Animals were required to show full paw placement and begin coordinated locomotion in order to complete the righting task. A total of three runs in the NG and CA tests, and five runs of the RR test, were performed on every testing day. For all tests, failure was considered to be an inability to complete the task within 60 seconds. A Total Time (TT, sum of the mean time for each of the three tasks) score on each day, and area under the curve (AUC) across the whole testing period (as a measure of skill development over time), for each test was also calculated.
Catwalk analysis
From P42-P70, kits underwent weekly catwalk gait analysis (Catwalk XT, Noldus, Leesburg, VA). At each time point, three compliant runs (lasting <10 seconds, maximum speed variation 60%) were collected from each animal. Paw placement pressure, paw area, stride length, swing speed, and base of support (BOS) were analyzed over time as measures of gait development. Due to the variability in size between both litters and sexes, all catwalk measures were either adjusted by weight, or used to generate ratios (i.e. between the fore and hind paws) within a single animal. Measures of paw pressure intensity were derived from the CatwalkXT software, and are expressed in arbitrary units (au). A python package was developed in order to analyze the lateral movement component of ferrets durongthe catwalk task. Raw images from the CatWalk Noldus dataset were extracted for post-analysis with a self-developed software package and ImageJ macro (available from: https://github.com/ccurtis7/ferretfit). Paw print coordinates were extracted from raw output images. Trajectory features were extracted from each run that give measures of the lateral spread of the paw prints including range and standard deviation in the lateral direction as well as the amplitude and period of a sinusoidal curve fit to the trajectory of the animal’s path, both measured in pixels.
Ex vivo magnetic resonance imaging (MRI) and network connectivity (connectome)
At P70, kits underwent euthanasia and perfusion fixation with phosphate-buffered saline (PBS) followed by 10% neutral buffered formalin (NBF). Subsequently, the brains were removed and immersion-fixed in NBF for at least a further 72 h before being rinsed and submerged in PBS at 4°C to rehydrate for a further 72 h. Brains were then mounted on agarose gel sleds inside 50ml Falcon tubes and immersed in Fomblin (Perfluoropolyether, PFPE; Solvay Specialty Polymers, GA). Diffusion-weighted magnetic resonance (MR) data were collected on the Bruker Avance III, 4.7 Tesla (200 MHz, 1H), 20 cm, horizontal bore magnet with ParaVision version 6.0.1 software. The magnet is fitted with custom [Resonance Research, Billerica, MA], 9 cm i.d., high performance gradients achieving an average of 750 mT/meter gradient with a 100 μsec slew rate. A TurboRARE 3D T2 sequence provided anatomical images using the following settings: Field of view (FOV) 30 mm, slice thickness 0.23 mm, sagittal slice orientation matrix with 1.6 sec recycle time and 39 msec echo time accomplished via a rare factor of 16 and acquired into a 128 point per axis cubic volume. Diffusion tensor images were obtained using a 2D collection with the same FOV as the T2. Slice thickness was 0.6 mm, for 30 diffusion directions [plus 5 A0 images], and eight averages for 64 slices [128×128] each 0.6 mm thickness. The recycle time was set to 5.6 seconds with an echo time of 48 msec. Diffusion weighting was set to 4 msec gradient duration [δ] and 10 msec gradient separation [Δ] with a maximum B value of 4320 to result in 30 diffusion directions. Diffusion-weighted images were motion- and distortion-corrected using the latest version of FMRIB Software Library (FSL v5.0, Oxford, UK) eddy software (https://fsl.fmrib.ox.ac.uk/fsl/fslwiki/eddy). FSL’s dtifit was then applied, and the resulting diffusion tensor image (DTI) median filtered using fslmaths-fmedian option. The resulting output files were fractional anisotropy (FA), L1, L2, L3 (the three eigenvalue maps), MD (mean diffusivity), and MO (dti mode) maps. Radial diffusivity was calculated by combining the L2 and L3 maps. Co-registration of the FA maps from all subjects was performed using tract-based spatial statistics (TBSS). This procedure builds a template from all of the subjects and also co-registers the individual FA maps to the same template. Comparisons of TBSS between groups were Threshold-Free Cluster Enhancement (TFCE) adjusted for multiple comparisons. DTI Connectivity values were measured using FSL’s probtrackx2 software with network option enabled and using 71 different anatomical seed points and associated regions of interest (ROIs) that were spread throughout the brain. Matlab “Brain Connectivity Toolbox” (https://sites.google.com/site/bctnet/construction) was used to perform the complex network analysis/graph theory analysis, as described in Rubinov and Sporns.18 The clustering coefficients of the regions were based on the full-brain connectivity network regions thresholded at 10% sparsity. Graph-based network analysis allows for visualization of connectivity patterns among all the elements of the brain (e.g., brain regions) as well as quantitative characterization of global organization. The utility of graph-based techniques has been proven by an increasing number of studies to probe potential mechanisms involved in normal development,19–21 aging,22,23 and various brain disorders.24–26
Immunohistochemistry (IHC)
After MRI, coronal slices at the level of the caudate nucleus were taken from each brain, embedded in paraffin, and 4 μm sections prepared for hematoxylin and eosin (H&E) and IHC. MBP and Olig2 immunohistochemistry was performed at the University of Washington Histology and Imaging Core. For MBP, slides were baked for 30 min at 60°C and deparaffinized on the Leica Bond Automated Immunostainer (Leica Microsystems, Buffalo Grove, IL). Antigen retrieval was performed by placing slides in EDTA for 20 min at 100°C. The primary antibody (rat anti-ferret MBP, 1:500 dilution, Abcam, AB7349) in Leica Primary Antibody Diluent was applied for 30 min. A secondary antibody, unconjugated rabbit anti-rat IgG (1:300 + 5% NGS in TBS, Vector, AI-4001) was then applied for 8 min. Goat anti rabbit horseradish peroxidase Leica Bond Polymer was added for 8 min. Antibody complexes were visualized using Leica Bond Mixed Refine (DAB, 3,3’-diaminobenzidine) detection 2X for 10 min at room temperature (RT). For Olig2, staining was performed using rabbit polyclonal anti-Oligodendrocyte transcription factor 2 (Olig2; Millipore, Cat No. AB9610.) on formalin-fixed paraffin-embedded sections. Antigen retrieval was performed by placing slides in Citrate for 20 min at 100°C. The primary antibody, Olig2 (1:500) or Rabbit IgG (1:1000) in Leica Primary antibody diluent, was applied for 30 min at room temperature. In both the MBP and Olig2 protocols, tissues were counterstained with hematoxylin for 4 minutes. GFAP immunohistochemistry was performed at the University of Washington Harborview Medical Center (HMC) Histology IHC lab. For GFAP, staining was performed using rabbit polyclonal anti-glial fibrillary acidic protein (GFAP; Agilent [Dako]) at a dilution of 1:300, using the Leica Bond III IHC stainer, the polymer refine detection kit, and the Bond Epitope retrieval 1 solution for 20 min. These antibodies had not previously been optimized in the ferret. Images of representative brain regions were acquired from digitally scanned images or from glass slides using NIS-Elements BR 3.2 64-bit and plated in Adobe Photoshop Elements. Image brightness and contrast was adjusted using Auto Smart Fix and/or Auto White Balance, with manipulations applied to the entire image. Original magnification and/or scale bar is stated.
Quantitative IHC
Image analysis was performed using whole slide digital images and automated image analysis. All slides were scanned in bright field with a 20X objective using a Nanozoomer Digital Pathology slide scanner (Hamamatsu; Bridgewater, New Jersey). Whole slide digital images were imported into Visiopharm software (Hoersholm, Denmark) for analysis. The software converted the initial digital imaging into gray scale values using two features, RGB-R with a mean filter of 5 pixels by 5 pixels and an RGB-B feature. Visiopharm was then trained to label positive staining and the background tissue counter stain using a project-specific configuration based on threshold pixel values. Images were processed in batch mode using this configuration to generate the desired outputs (ex. area of MBP and ratio of MBP to total tissue area). For quantitative measurements of MBP, Olig2, and GFAP, the Visiopharm Image Analysis module was used to define ROIs. ROIs were selected by manually drawing around or placing a circle of equal size within the anatomic structure of interest. ROIs were selected in part based on areas noted to be potentially different between treated and control animals on MRI and included half of the brain; a circular region of the corpus callosum; a circular region of the dorsal internal capsule; a circular level of the ventral internal capsule; and the dorsal cerebrum (Supplemental Figure 2). As described above, positively stained versus unstained tissue was segmented using a project-specific configuration to generate the desired outputs. After quantitative staining analysis, MBP images were imported into NDP.view2 (Hamamatsu Photonics, Bridgewater, NJ), and the thickness of the corpus callosum and three levels of the internal capsule (Supplemental Figure 2) were measured by an operator blinded to treatment groups.
Statistical analysis
Statistics and images were generated in Prism version 7 (GraphPad Software, San Diego, CA). Early reflex testing was analyzed by comparing the injured and control groups at each time point using a Wilcoxon-Mann-Whitney U-test. Catwalk data was primarily compared between groups at P42 as visual inspection of the data showed similar results in both groups from P49-P70. Bonferroni corrections were used to adjust for multiple comparisons in the behavioral testing data. For quantitative immunohistochemistry analyses, the ratio of positive staining to total tissue area was calculated for each animal and the median value was calculated by treatment group and sex. Comparisons between injured animals and controls were performed using a Wilcoxon-Mann-Whitney U-test test with a Bonferroni correction for multiple comparisons. The outcomes of reflex testing and catwalk testing were compared using Spearman’s rank correlations. Statistical results with a p-value <0.05 were considered statistically significant.
RESULTS
Model outcomes
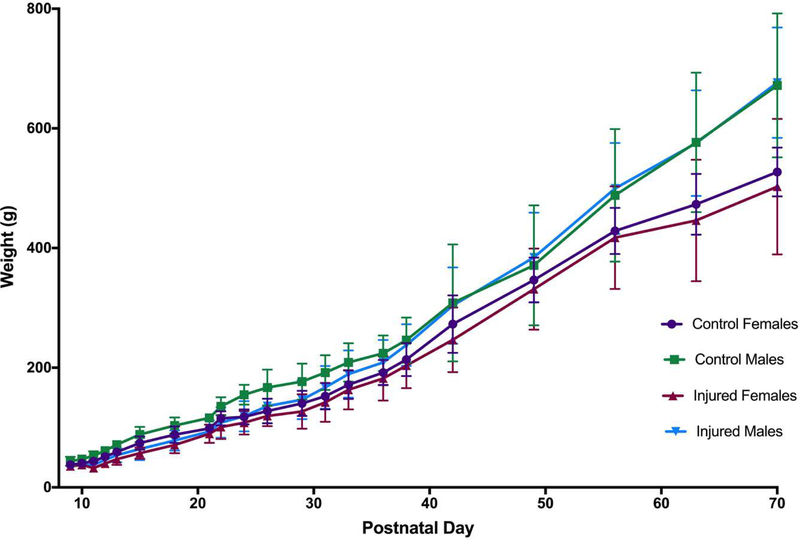
Eight litters including 60 kits were initially included, with an insult mortality of 18.3% (n=11). A subset of n=15 animals (n=3 control, n=12 injured) were used for early time point studies as part of model development (data not shown). As a result, n=34 animals (n=14 controls, n=20 injured) survived to P70 and were included in the final analysis. The median (range) temperature of nesting sentinel LPS-treated animals 4h after injection (immediately before hypoxia) was 34.7°C (34.3–37.1°C, n=7), which was similar to littermate control animals (35.1°C, 34.2–36.1°C; n=8). On the day of the insult (P10), mean (SD) weight of the kits was 41.4g (8.8g) for males and 38.8g (7.2g) for females. Injured animals lost, on average, 8.5% (10.4%) bodyweight between P10 and P11 as a result of the insult. By P12 injured animals had gained 9.2% (13.7%) of their P10 bodyweight, compared to a 24.4% (5.2%) weight gain in controls at P12. By the 6th week of age (P35-P42), injured animals had caught up in terms of weight compared to control animals, and males began to become heavier than females (Figure 1). No difference in weight between injured and control animals was seen at P70.
Figure 1. Weight gain.
On the day of the insult (P10), mean (SD) weight of the kits was 41.4g (8.8g) for males and 38.8g (7.2g) for females. Injured animals lost, on average, 8.5% (10.4%) bodyweight between P10 and P11 as a result of the insult. By P12 injured animals had gained 9.2% (13.7%) of their P10 bodyweight, compared to a 24.4% (5.2%) weight gain in controls at P12. By the 6th week of age (P35-P42), injured animals had caught up in terms of weight compared to control animals, and males began to become heavier than females. No difference in weight between injured and control animals was seen at P70.
Early reflex testing
At all ages from P28-P40, median time to complete all tasks (NG, CA, RR, and TT) was longer in the injured group compared to controls; however, the variability in scores was high, and the differences were not consistently statistically significant. In all of the individual reflex tests, and in the TT score, median time was slower in the injured group compared to the control group on every test day; however, no significant difference was seen between groups in any given test at any age.
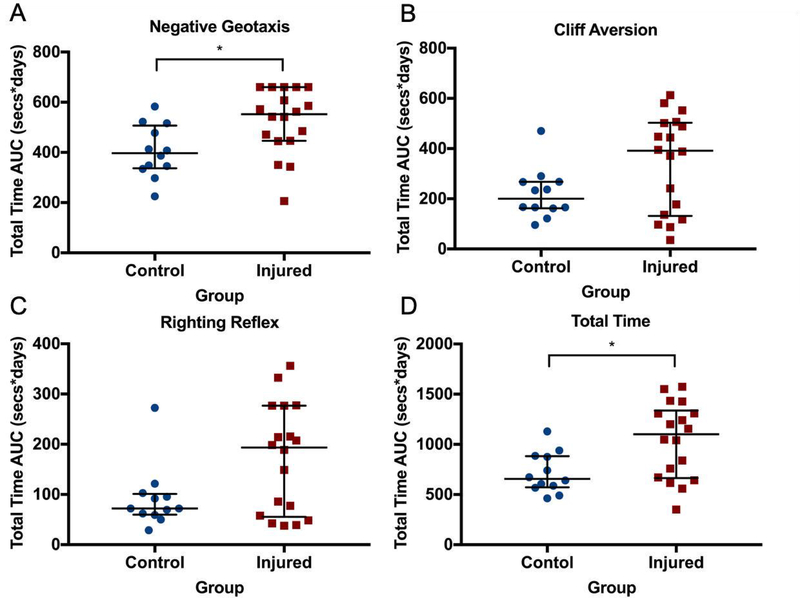
Analysis of the reflex AUCs showed that median (IQR) NG was significantly slower to develop in the injured group (552 s*days, 446–660 s*days) compared to the control group (397 s*days, 337–507 s*days; p=0.03, Figure 2A). No difference was seen in the AUC for CA (Figure 2B) or RR (Figure 2C). However, TT AUC was significantly greater in the injured group (1,101 s*days, 663.5–1338 s*days) compared to the control group (656.4 s*days, 572.9–883.1 s*days, p=0.048). The pattern of the AUC results for CA, RR, and TT suggested a bimodal distribution of injury, with 6 of 18 animals scoring similarly to control animals (Figure 2), and 12 animals displaying delayed skill development suggestive of cerebral injury. No difference between injured male and female animals was seen at any time point.
Figure 2. Reflex development.
Area under the curve (AUC) analysis for reflex development of negative geotaxis (A), cliff aversion (B), righting reflex (C), and total time across all three tests (D). Median (IQR) negative geotaxis was significantly slower to develop in the injured group compared to the control group. No difference was seen in the AUC for cliff aversion or righting reflex. However, total time AUC was significantly greater in the injured group compared to the control group. The pattern of the AUC results suggested a bimodal distribution of injury, with 6 of 18 animals scoring similarly to control animals, and 12 animals displaying delayed skill development suggestive of cerebral injury. * denotes p<0.05
Catwalk
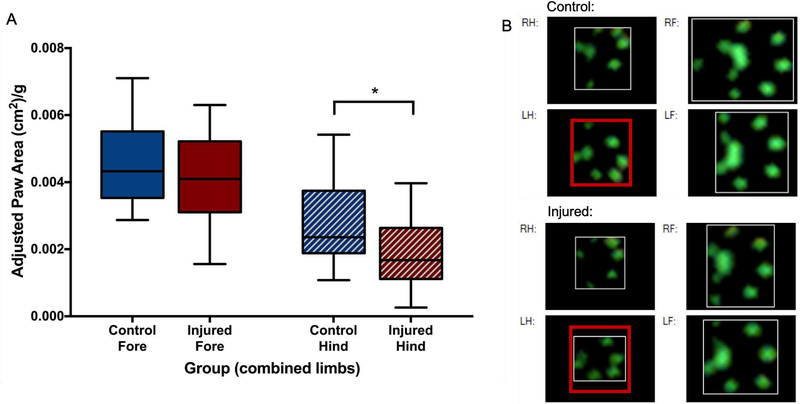
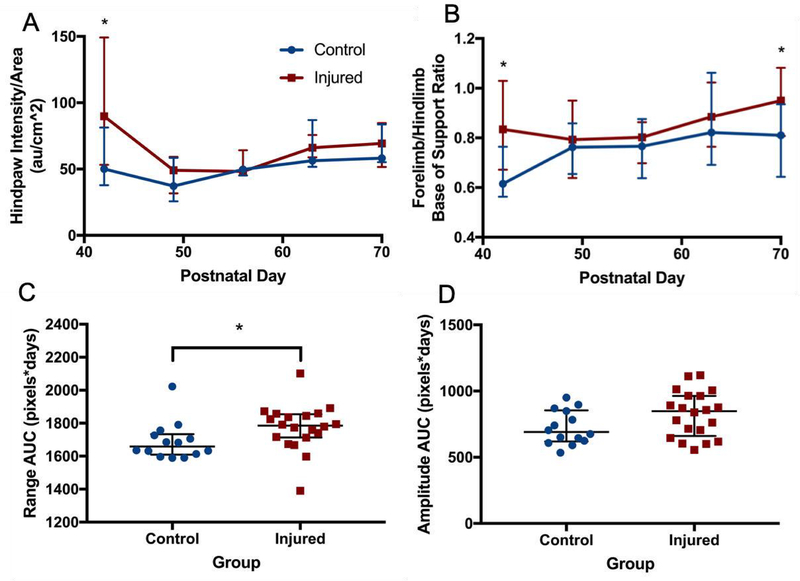
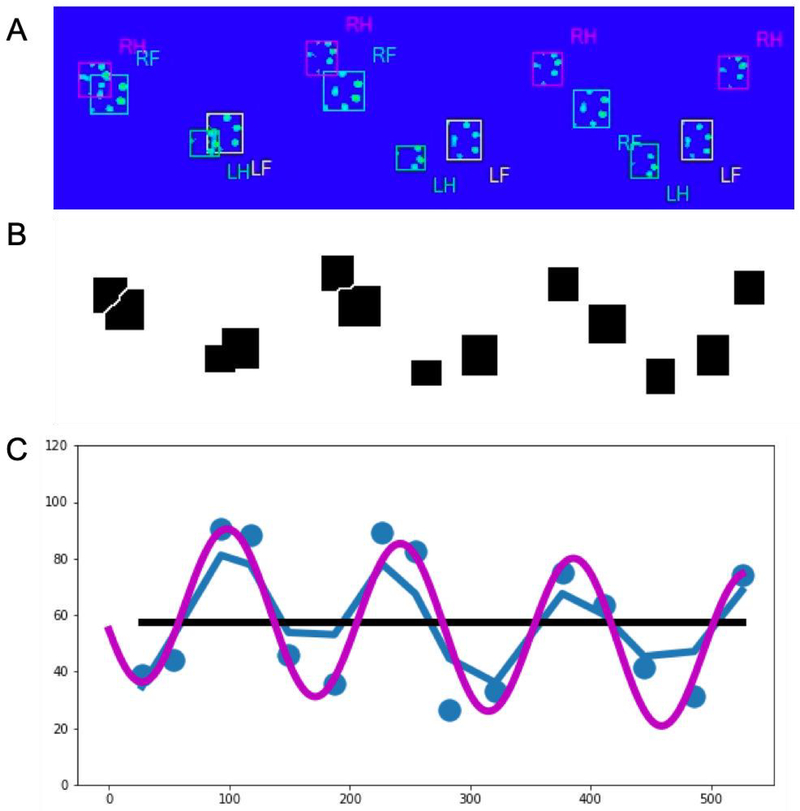
The greatest difference between the groups was seen at P42, with many deficits improving from P49 onwards. On P42, the weight-adjusted median (IQR) area of the hind paws of injured animals (1.68 cm2/kg, 1.11–2.64 cm2/kg) was significantly smaller than that of control animals (2.36 cm2/kg, 1.88–3.75 cm2/kg; p=0.05, Figure 3). Similarly, this resulted in a larger ratio of the forepaws and hind paws in injured animals (2.34, 1.80–2.73) compared to controls (1.92, 1.39–2.29; p=0.04). Intensity of pressure per unit area was also higher in the hind paws of injured animals at P42 (89.8 au/cm2, 53.2–149.1 au/cm2) compared to control animals (50.1 au/cm2, 37.9–81.3 au/cm2; p=0.04, Figure 4A). At P42, the BOS of the fore paws (relative to the BOS of the hind paws) was significantly wider in injured (0.83, 0.67–1.03) animals compared to control animals (0.62, 0.56–0.76; p=0.009, Figure 4B). However, the wider BOS was not associated with any significant differences in measures of ataxic gait patterns (couplings and phase dispersions, data not shown). Instead, the gait of injured animals was characterized by an inability of injured animals to consistently maintain forward motion in a straight line (Supplemental Video 1) compared to controls (Supplemental Video 2). As measurements of lateral movement are less well defined in the CatwalkXT software, a custom Python package (FerretFit) was developed to analyze these movements from paw print images extracted from the catwalk software. Paw print range (a measure of the lateral spread of prints relative to the midline was not significantly different between groups at any time point; however, the median (IQR) range AUC across the entire testing period was significantly greater in injured animals (1786 pixels*days, 1713–1854 pixels*days) compared to control animals (1659 pixels*days, 1609–1734 pixels*days; p=0.008, Figure 4C). Using the same software package, a sine curve was fitted to the extracted paw prints from each run, and the amplitudes were compared. A trend towards a greater median (IQR) amplitude in the injured group (847.9 pixels*days, 660.3–963.7 pixels*days) was seen compared to the control group (690.5 pixels*days, 619.9–854.0 pixels*days; p=0.1, Figure 4D). Figure 5 depicts the method of image processing by the software package. To see whether early reflex performance predicted performance on the catwalk, reflex TT AUC was compared to the catwalk parameters that were significantly different in injured animals at P42. Reflex TT AUC was significantly correlated with P42 adjusted hind paw area (p=0.004, r=−0.64), fore paw/hind paw area ratio (p=0.004, r=0.65), hind paw mean pressure intensity per unit area (p=0.003, r=0.66), but not with BOS. No difference between injured male and female animals was seen at any time point.
Figure 3. Weight-adjusted paw areas.
At P42, adjusted area of the hind paws of injured animals was significantly smaller than that of control animals (A), with no difference between forepaws. Representative paw prints from the catwalk software (B) show that the hind paws of injured animals (bottom left panels) have a smaller area compared to control animals (top left panels). The red box around the left hind (LH) paw print is the same size, for comparison. * denotes p<0.05.
Figure 4. Gait differences over time.
Intensity of pressure per unit area (A) was higher in the hind paws of injured animals at P42 compared to control animals, and the base of support (BOS) ratio of the fore paws relative to the hind paws (B) was also significantly wider in injured animals. However, these differences were absent in subsequent weeks of testing. Using a custom Python package to analyze paw print trajectories, paw print range AUC (C) across the entire testing period was significantly greater in injured animals compared to control animals. A trend towards a greater median path amplitude (D) in the injured group was seen in the injured group compared to the control group. * denotes p<0.05
Figure 5. FerretFit paw print analysis.
For each catwalk run, an image showing every paw print was manually extracted from the CatwalkXT software (A). Using a specially-developed ImageJ macro, the paw print boxes were identified and separated out (B) before being analyzed using the FerretFit Python library (C) to determine the total range of paw prints, as well as the amplitude of a sine curve that best fit the trajectory of the prints.
MRI and connectome
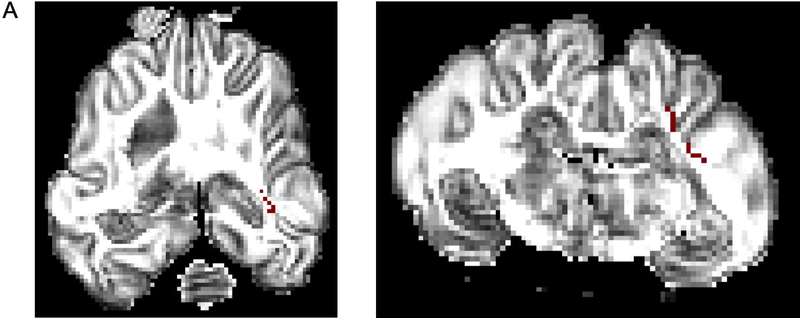
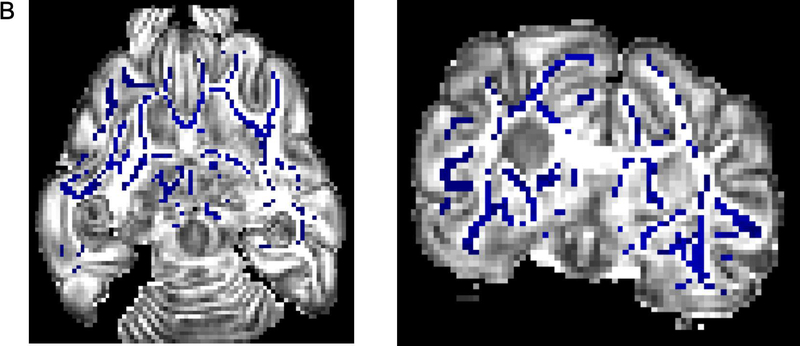
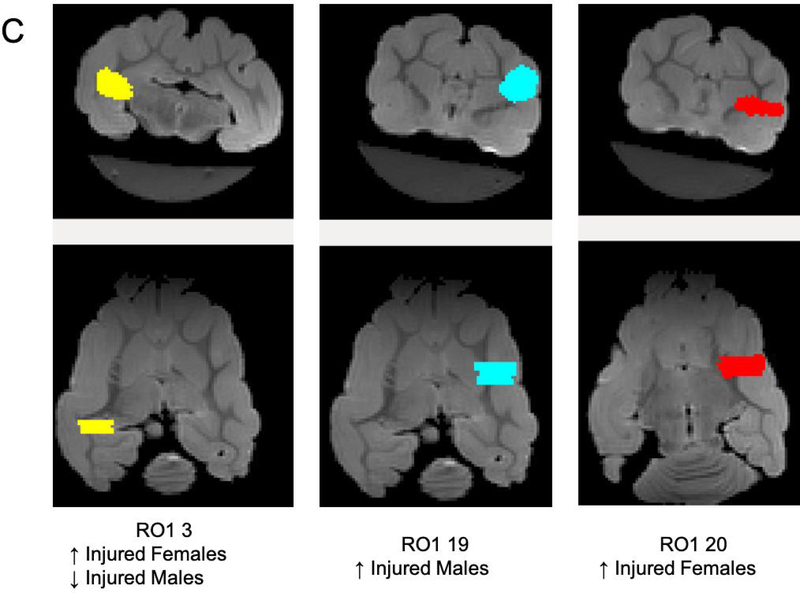
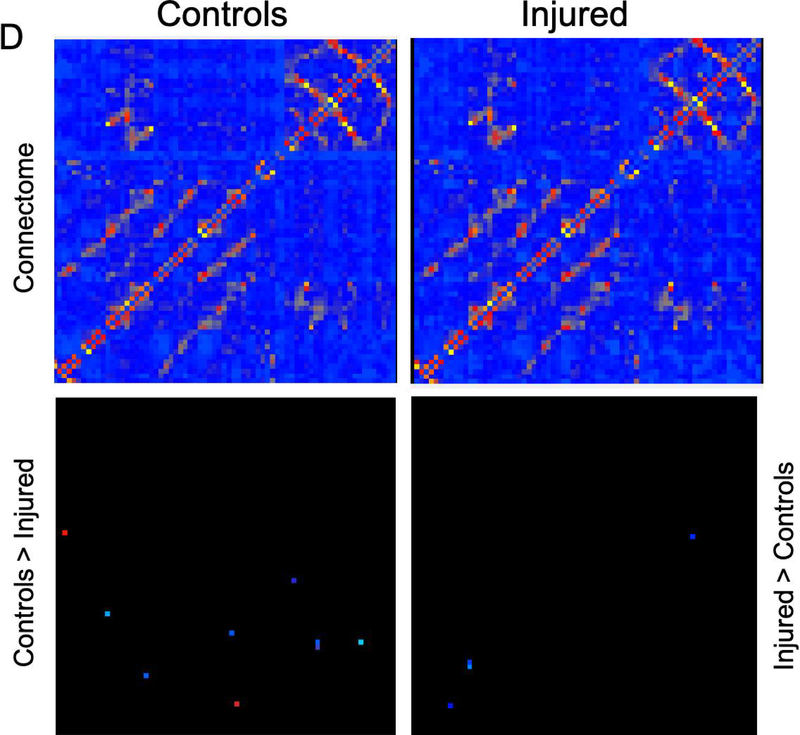
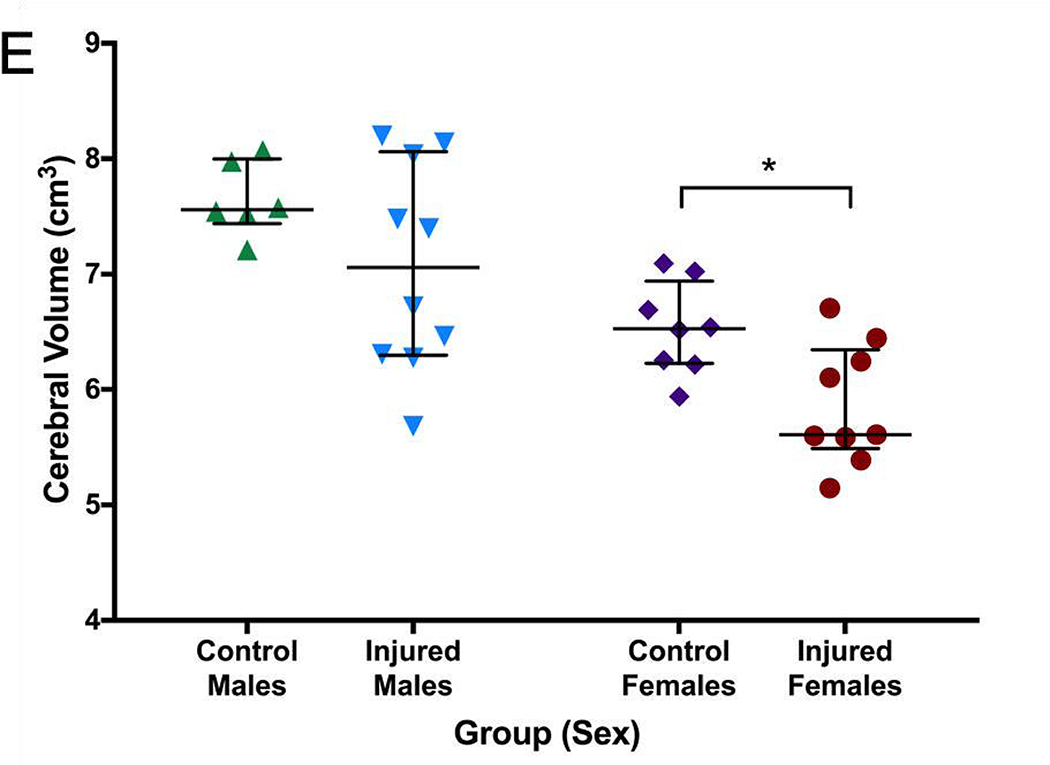
Greater FA values were seen in the control group in the right internal capsule dorsolateral to the ventricle at the level of thalamus (Figure 6A). On T2-weighted imaging, significantly greater signal intensity was seen in the injured group throughout the white matter bilaterally (Figure 6B). Network connectivity analysis showed three of 71 ROIs that were significantly different between injured and control animals (Figures 6C and 6D). In ROI 3 (right internal capsule at the level of the mesencephalon), mean (standard error) connectivity was 0.13au (0.015au) in injured females, which was significantly greater compared to control females (0.088au, 0.018au; p=0.03). In the same ROI, mean connectivity was 0.14au (0.010au), which was significantly decreased compared to control males (0.18au, 0.007au, p=0.008). In ROI 19 (left internal capsule and associated white matter at the level of the caudate nucleus), mean connectivity was 0.14au (0.006au) in injured males, which was significantly greater compared to control males (0.10au, 0.009ua; p=0.02). Similarly, in ROI 20 (left internal capsule and associated white matter at the level of the caudate nucleus, ventral to ROI 19), mean connectivity was 0.11au (0.003au) in injured females, which was significantly greater compared to control females (0.09au, 0.002au; p=0.003). Volumetric analysis from MRI outputs showed a trend towards greater cerebral volumes in control animals compared to injured animals (p=0.09, Figure 6E). In injured females, median (IQR) cerebral volume was 5.61cm3 (5.46–6.35cm3, n=9), which was significantly decreased compared to 6.53cm3 (6.23–6.94cm3; n=8, p=0.002) in control females. Median cerebral volume in injured males was 7.06cm3 (6.30–8.06 cm3, n=10), compared to 7.56cm3 (7.44–8.00 cm3, n=6) in control males, which was not significantly different (p=0.26). No difference in cerebellar volumes was seen between injured and control animals (data not shown).
Figure 6. MRI and connectome.
Greater fractional anisotropy (A) values were seen in the control group in the right internal capsule dorsolateral to the ventricle at the level of thalamus (marked in red). On T2-weighted imaging (B), significantly greater signal intensity was seen in the injured group throughout the white matter bilaterally (marked in blue). Network connectivity analysis showed three of 71 ROIs that were significantly different between injured and control animals (C). In ROI 3 (right internal capsule at the level of the mesencephalon), connectivity was greater in injured females, compared to control females. In the same ROI, connectivity in injured males was significantly decreased compared to control males. In ROI 19 (left internal capsule and associated white matter at the level of the caudate nucleus), mean connectivity was greater in injured males compared to control males. In ROI 20 (left internal capsule and associated white matter at the level of the caudate nucleus, ventral to ROI 19), mean connectivity was greater in injured females compared to control females. Overall connectivity projections (D) show control (left panels) and injured (right panels) animals, with points of increased connectivity in controls compared to injured animals (bottom left panel), and increased connectivity in injured compared to control animals (bottom right panel). Cerebral volumes (E) in injured females were significantly decreased compared to control females, but no difference in cerebral volume was seen between injured and control males. * denotes P<0.05.
Immunohistochemistry
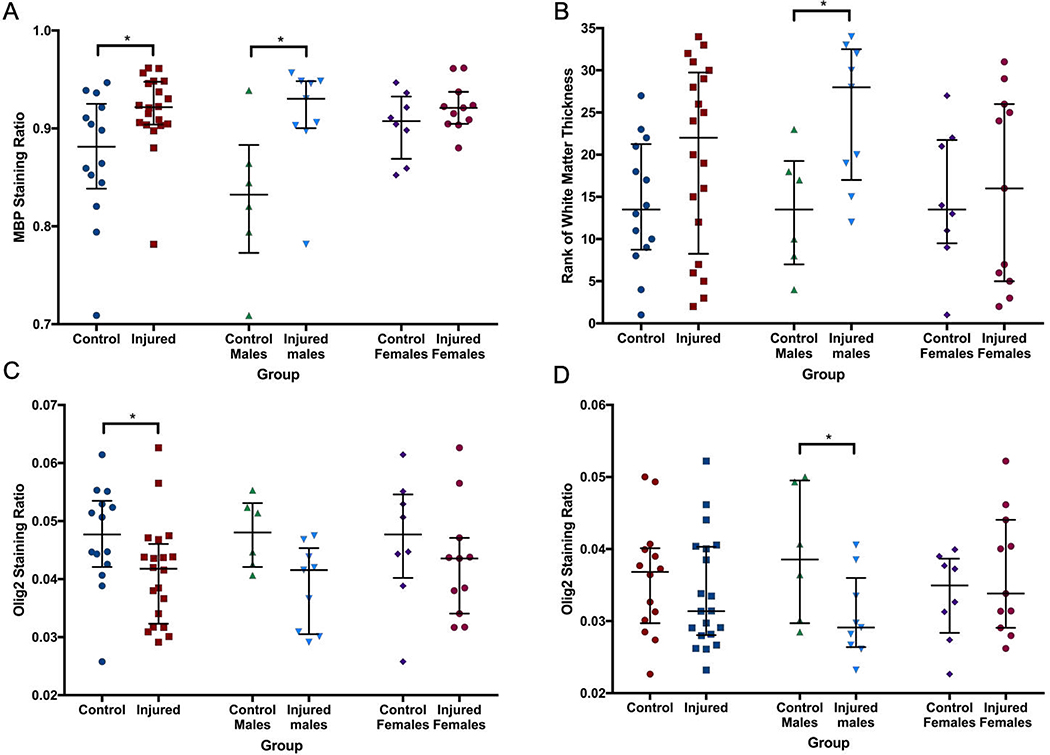
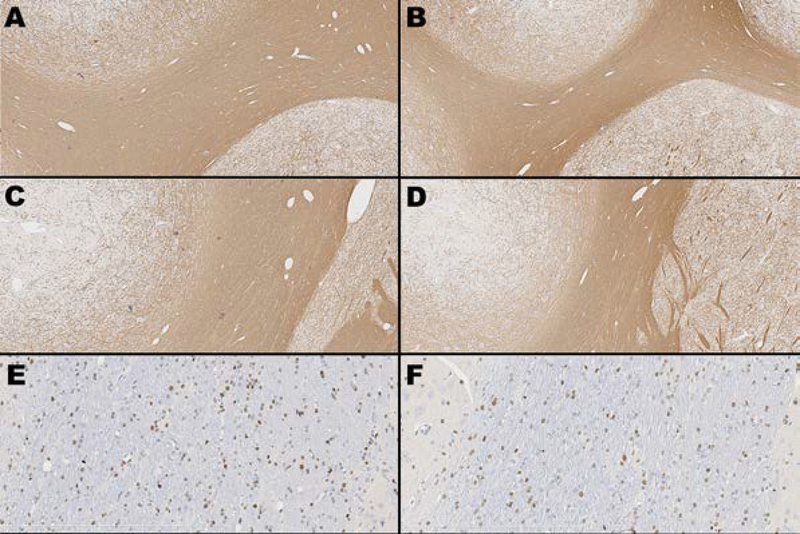
On IHC, MBP staining across an entire hemisphere, as well as within the corpus callosum (CC), was not significantly different between the two groups (data not shown). However, across two ROIs within the internal capsule (IC), median (IQR) MBP staining ratio was significantly greater and less variable in the injured group (0.92, 0.90–0.9) compared to the control group (0.88, 0.84–0.93; p=0.04). This was particularly evident in male animals (Figure 7A). The thickness of the CC and three areas of the IC at the base of consecutive sulci were then measured. Though no significant differences in thickness were seen within any individual region, a summary score based on the ranked weight-adjusted thickness of all four areas (thinner IC or CC resulted in a lower rank) suggested thinning of the white matter in injured males (p=0.026, Figure 7B). By comparison, median (IQR) Olig2 staining intensity was decreased in the CC of injured animals (0.042, 0.032–0.046) compared to control animals (0.048, 0.042–0.053; p=0.033, Figure 7C). Across two ROIs within the IC, median Olig2 staining ratio was also lower in injured males (0.031, 0.028–0.040) compared to control males (0.037, 0.030–0.040; p<0.05), but not between injured and control females (Figure 7D). Figure 8 shows images taken from animals best representing median MBP thickness and Olig2 staining for both control and injured animals. No differences in GFAP staining intensity were seen either globally or regionally (corpus callosum, internal capsule, corona radiata). H&E images at the level of the caudate nucleus and thalamus did not show substantial or consistent abnormalities in control or injured animals.
Figure 7. Quantitative immunohistochemistry.
Within the internal capsule, MBP (A) staining ratio was significantly greater and less variable in the injured group compared to the control group. This was particularly evident in male animals. The thickness of the corpus callosum and three areas of the internal capsule at the base of consecutive sulci were then measured, and a summary score based on the ranked weight-adjusted thickness of all four areas (B) suggested thinning of the white matter in injured males. Olig2 staining intensity was decreased in the corpus callosum (C) of injured animals compared to control animals. Olig2 staining ratio was also lower in injured males compared to control males within the internal capsule (D). * denotes p<0.05.
Figure 8. MBP and Olig2 immunohistochemistry.
Images taken from animals best representing median MBP thickness and Olig2 staining for both control and injured animals. Top two rows, left and right (A-D) depict anti-myelin basic protein (MBP) immunohistochemistry at the level of caudate nucleus showing two areas of the internal capsule - IC1 in a control animal (A) and an injured animal (B), and IC2 in a control (C) and treated animal (D). Original magnification 5x for all images. Positive anti-MBP staining = brown; blue = hematoxylin counterstain. Bottom row depicts anti-Olig2 immunohistochemistry at the level of the internal capsule in a control (E) and injured (F) animal. Original magnification 20x for all images. Positive anti-Olig2 staining = brown; blue = hematoxylin counterstain.
DISCUSSION
Here we present a novel model of encephalopathy of prematurity in an extremely preterm-equivalent ferret. Compared to control animals, injured ferrets displayed delayed reflex development and early gait characteristics consistent with white matter injury (WMI). At early childhood-equivalent age (P70, roughly equivalent to the 4–6 year-old human), widespread white matter changes were seen on MRI and histology, including altered cerebral network connectivity, and evidence of possible dysmaturation on immunohistochemistry.
There remains a significant need for an expanded repertoire of relevant large animal models in which to test therapeutic interventions for infants with the neurological sequelae of prematurity. Rodent models often fail to recapitulate the WMI that is pathognomonic of premature brain injury, and fewer large animal models of prematurity are available due to the relative brain development of model species at birth.27 This is particularly evident when comparing the literature on premature brain injury to term hypoxic-ischemic encephalopathy (HIE), where a wide range of models allow for the sequential translation of therapies from in vitro work to rodent models and then large animal models before application in clinical trials. This approach led to therapeutic hypothermia (TH) becoming standard of care for HIE, as well as the development of pharmacological agents such as erythropoietin (Epo) and xenon.28–32 Our work in the newborn ferret aims to address some of this gap in the preclinical literature of premature brain injury.
The ferret is an attractive species in which to model premature brain injury due to its altricial nature. At birth, ferret cerebral development is equivalent to the human brain towards the end of the first trimester, with the P10 and P21 ferret equivalent to 24–26 weeks’ gestation and term, respectively. This allows for the potential to model premature brain injury along the entire spectrum of ages seen clinically. Additionally, the ferret is amenable to long-term behavioral testing methods similar to those used in rodents.33 This allows for the analysis of more complex and long-term behavioral outcome data than is available for other larger model animals such as piglets and sheep. However, one interesting aspect of developing preclinical models in the newborn ferret is its relative resistance to brain injury. During development of the model, it became clear that standard injury mechanisms used in rodents (including pre-sensitization with LPS, hypoxia, hyperoxia, and unilateral carotid artery ligation) did not lead to significant long-term brain injury in ferrets unless applied in specific combinations. Important variables include maintaining core temperature at or above 37°C during hypoxia, ensuring adequate hypoxia without producing significant intra-hypoxic mortality, and moderating the oxygen concentration during hyperoxia; a hyperoxic oxygen concentration of 60% was used due to the fact that prolonged exposure to 80% or 100% oxygen after hypoxia resulted in acute pulmonary edema or hemorrhage. The final combination of LPS pre-sensitization and alternating hypoxia/hyperoxia/hypoxia presented here results in a relatively mild but sustained injury detectable for up to two months after the initial injury.
In early reflex testing, injured animals showed slower median reflex times in every test on every day of testing. However, significant variability was seen within both groups, as well within individual animals across testing days, and these differences were not significantly different. Day-to-day variability in the performance of individual animals may be why individual comparisons were not different between groups. By comparison, AUC calculations of reflex development were significant between groups for NG and TT, perhaps because the accumulated differences over time became clear. This difference may have been due to delayed motor development in the injured animals, delayed ability to learn the tasks, or a combination of the two. As with most small animal models of neonatal brain injury, and indeed in premature infants seen clinically, there is a certain degree of variability seen in the injury that occurs as a result of the insult. This was particularly noticeable in the early reflex testing, where AUC calculations (as a measure of rate of reflex development over time) showed a distinct bimodal distribution of injury. Roughly two-thirds of animals displayed delayed reflex development, with the remaining third performing as well as control animals. Overall reflex development (total time AUC) was also significantly correlated with a number of catwalk markers associated with injury, suggesting that early reflex testing may be able to identify injured animals early on.
Based on our experience translating reflex testing to the newborn ferret, some degree of prior stimulation is required for the animal to engage with the tasks. It is likely that highly-standardized pre-testing procedures, as well as collecting a greater number of parameters during reflex testing, will allow for more granular and consistent differences between injured and control animals. This will form part of our future work with the model as a platform to test potential neuroprotective agents.
Gait assessment showed multiple deficits in the injured animals compared to controls, particularly at the earliest time point (P42). This included a widened base of support in the fore paws, which appeared to be an artifact of an unstable gait characterized by significant lateral movement. At P42, injured animals displayed smaller paw print areas in the hind paws, with the pad of the paw often absent from the visible paw print, both of which are suggestive of the toe walking gait characteristic of spastic diplegia noted in preterm infants (Figure 3A).34 This is also described in rodent models of WMI.35 Toe walking was also associated with a greater relative intensity of paw placement in the hind paws during locomotion, as well as greater lateral movement during locomotion (measured as range and amplitude of paw prints) over the entire testing period. Despite the initial differences in gait and paw placement in injured animals at P42, the majority of these deficits disappeared from P49 onwards. This may be due to the fact that the ferret is able to adapt in spite of ongoing macroscopic brain injury. Similar results have been seen in a controlled cortical impact (CCI) model of traumatic brain injury in the adult male ferret.9 Additionally, as the ferrets remained housed with the littermates during the survival period, natural periods of play within the nest may have constituted some degree of environmental enrichment, which is known to have a neuroprotective benefit.36
Despite the variability and resolution of certain behavioral deficits, sustained WMI was seen throughout the white matter on both MRI and immunohistochemistry. Ex vivo MRI showed extensive differences in white matter signal on T2 imaging, especially in male animals. On immunohistochemistry, this translated to a greater intensity of MBP staining within the IC, as well as relative thinning of the white matter in the CC and IC. At the same time, Olig2 staining within the CC of injured animals, as well as the IC of injured males, was decreased compared to controls. Overall, this suggests a degree sexually-dimorphic white matter dysmaturation after the insult. In males particularly, the insult resulted in loss of Olig2 positive cells and reduced white matter thickness. The remaining functional oligodendrocytes then appeared to undergo accelerated myelination, with greater MBP density in the thinned white matter. However, it must be noted that white matter thickness was only assessed immunohistochemically at a single level (the caudate nucleus), and minor section-to-section variability during trimming and processing may contribute to variation in apparent thickness of the white matter tracts on 2-dimensional images. We were also unable to ascertain whether the increased MBP intensity in male animals was associated with normal MBP structure, or the mechanisms underlying the final observed histopathology. Therefore, future studies will include in-depth examination of white matter structure, including electron microscopy, as well as examination of the time course of expression of white matter markers after injury, and how this differs between the sexes.
Interestingly, and consistent with the resilience and plasticity of the ferret brain after injury, connectome changes on MRI included increased connectivity in the internal capsule in both males and females, perhaps as a response to deficits as a result of the more widespread WMI. This was particularly evident in injured female animals, where multiple areas of increased connectivity were seen despite smaller overall brain volumes compared to control female animals. However, though the brains of female injured animals showed fewer white matter abnormalities compared to injured males, overall cerebral volume was decreased in injured females despite no difference in bodyweight compared to control females.
This work does have some additional limitations. Based on our current parameters of LPS dosing and hypoxia/hyperoxia exposure, we are unable to exactly determine which factor(s) contribute most significantly to the final injury. However, based on our iterative approach to developing the model, it is likely that all of the current factors play an important role in the final injury seen. We have previously shown that LPS exposure results in microglial activation in the P10 ferret brain,11 but LPS alone did not appear to produce lasting injury. LPS exposure in near-term equivalent rodents results in a circulating inflammatory cytokine peak around 4h after exposure, which corresponds with sensitization of the brain to hypoxia-ischemia, and a significant increase in brain injury.14–16 A similar time course of inflammatory cytokine release (peak TNF-α and IL-6 release 2–4h after LPS exposure) is seen in isolated ferret peripheral blood mononuclear cells.17 This suggests that the ideal timing of LPS exposure for pre-sensitization of the brain is likely to be similar between rodents and ferrets, which was the final approach used here. However, the data here do not allow for the comparison of the effects of hypoxia/hyperoxia alone without presensitization.
Similar to the isolated effects of LPS and hypoxia, our work to date has not included multiple iterations of hyperoxia duration. As with any preclinical model, the goal was not to accurately reproduce the exposures encountered by preterm infants clinically, but to provide a confluence of the mechanistic factors thought to be involved in premature brain injury. These include inflammation, hypoxia, and production of reactive oxygen species.7 The latter is exacerbated by hyperoxia, which is particularly problematic in the premature infant due to their relatively under-developed antioxidant capacity.37,38 As such, hyperoxia was included in the protocol in order to exacerbate the production of reactive oxygen species after a period of inflammatory activation and hypoxia. We used a prolonged period of hyperoxia compared to what might be seen clinically to in order to maximize the likelihood of hyperoxia-induced oxidative stress, and increase the likelihood of sustained cerebral injury.
With respect to future use of the model, a greater initial injury severity would be desirable, such that the effects of any therapeutic intervention would be easier to detect on behavioral outcomes as well as MRI and pathology. Though no difference was seen between sexes on any behavioral measure at any time point, the differences seen on MRI suggest that differences may be detectable with larger group sizes, more severe injury, or a greater battery of testing procedures. As with other models of neonatal brain injury, it is also likely that males and females will respond differently to any neuroprotective therapies. Future studies will involve further iteration of the model to increase injury severity, as well as increasing the number of behavioral tests to include cognition and other sensory assessments.9,39 Mechanistic exploration of the ferret’s resilience to brain injury may also allow for that resilience to be “reverse-engineered” as a way to develop potential therapeutic strategies for human preterm brain injury.
In summary, we present long-term characterization of the behavioral deficits, pathology, and changes in brain structure seen after an inflammation-sensitized hypoxic/hyperoxic brain injury model in the P10 ferret. This newborn ferret model has the potential to provide an additional platform through which to assess potential therapies for encephalopathy in infants born extremely preterm.
Supplementary Material
Acknowledgements
The authors would like to acknowledge Brian Johnson, Juliet Hahn and Megan Larmore in the University of Washington Histology and Imaging Core for their assistance in section preparation, immunohistochemistry, whole slide imaging and quantitative image analysis.” We would also like to thank Vivienne Acuna, Simar Virk, Olivia White, and Alair Holden-Hunt for their assistance with animal handling and behavioral testing.
Funding sources
This work was supported by NICHD grant no. 5R21NS093154.
Footnotes
Disclosure statement
The authors have no conflicts of interest to declare.
Statement of ethics
The authors confirm that all animal experiments were performed in accordance with the ARRIVE (Animal Research: Reporting of In Vivo Experiments) guidelines and the NIH Guide for the Care and Use of Laboratory Animals, and were part of a protocol approved by the University of Washington Institutional Animal Care and Use Committee.
REFERENCES
- 1.Martin JA, Hamilton BE, Osterman MJK, et al. Births: Final Data for 2016. National vital statistics reports : from the Centers for Disease Control and Prevention, National Center for Health Statistics, National Vital Statistics System. 2018;67(1):1–55. [PubMed] [Google Scholar]
- 2.Younge N, Goldstein RF, Bann CM, et al. Survival and Neurodevelopmental Outcomes among Periviable Infants. The New England journal of medicine. 2017;376(7):617–28. [DOI] [PMC free article] [PubMed] [Google Scholar]
- 3.Johnson S, Marlow N. Early and long-term outcome of infants born extremely preterm. Archives of Disease in Childhood. 2017;102(1):97. [DOI] [PubMed] [Google Scholar]
- 4.Galinsky R, Polglase GR, Hooper SB, et al. The Consequences of Chorioamnionitis: Preterm Birth and Effects on Development. Journal of Pregnancy. 2013;2013:11. [DOI] [PMC free article] [PubMed] [Google Scholar]
- 5.Reich B, Hoeber D, Bendix I, Felderhoff-Mueser U. Hyperoxia and the Immature Brain. Developmental neuroscience. 2016;38(5):311–30. [DOI] [PubMed] [Google Scholar]
- 6.Bennet L, Dhillon S, Lear CA, et al. Chronic inflammation and impaired development of the preterm brain. Journal of Reproductive Immunology. 2018;125:45–55. [DOI] [PubMed] [Google Scholar]
- 7.Galinsky R, Lear CA, Dean JM, et al. Complex interactions between hypoxia-ischemia and inflammation in preterm brain injury. Developmental medicine and child neurology. 2018;60(2):126–33. [DOI] [PubMed] [Google Scholar]
- 8.Empie K, Rangarajan V, Juul SE. Is the ferret a suitable species for studying perinatal brain injury? International journal of developmental neuroscience : the official journal of the International Society for Developmental Neuroscience. 2015;45:2–10. [DOI] [PMC free article] [PubMed] [Google Scholar]
- 9.Schwerin SC, Chatterjee M, Imam-Fulani AO, et al. Progression of histopathological and behavioral abnormalities following mild traumatic brain injury in the male ferret. Journal of neuroscience research. 2018;96(4):556–72. [DOI] [PubMed] [Google Scholar]
- 10.Rafaels KA, Bass CR, Panzer MB, et al. Brain injury risk from primary blast. The journal of trauma and acute care surgery. 2012;73(4):895–901. [DOI] [PubMed] [Google Scholar]
- 11.Snyder JM, Wood TR, Corry K, et al. Ontogeny of white matter, toll-like receptor expression, and motor skills in the neonatal ferret. International journal of developmental neuroscience : the official journal of the International Society for Developmental Neuroscience. 2018;70:25–33. [DOI] [PMC free article] [PubMed] [Google Scholar]
- 12.Barnette AR, Neil JJ, Kroenke CD, et al. Characterization of Brain Development in the Ferret via Magnetic Resonance Imaging. Pediatric research. 2009;66(1):80–4. [DOI] [PMC free article] [PubMed] [Google Scholar]
- 13.Noctor SC, Scholnicoff NJ, Juliano SL. Histogenesis of ferret somatosensory cortex. Journal of Comparative Neurology. 1998;387(2):179–93. [PubMed] [Google Scholar]
- 14.Eklind S, Mallard C, Leverin AL, et al. Bacterial endotoxin sensitizes the immature brain to hypoxic--ischaemic injury. The European journal of neuroscience. 2001;13(6):1101–6. [DOI] [PubMed] [Google Scholar]
- 15.Falck M, Osredkar D, Wood TR, et al. Neonatal Systemic Inflammation Induces Inflammatory Reactions and Brain Apoptosis in a Pathogen-Specific Manner. Neonatology. 2018;113(3):212–20. [DOI] [PubMed] [Google Scholar]
- 16.Osredkar D, Sabir H, Falck M, et al. Hypothermia Does Not Reverse Cellular Responses Caused by Lipopolysaccharide in Neonatal Hypoxic-Ischaemic Brain Injury. Developmental neuroscience. 2015;37(4–5):390–7. [DOI] [PubMed] [Google Scholar]
- 17.Nakata M, Itou T, Sakai T. Quantitative analysis of inflammatory cytokines expression in peripheral blood mononuclear cells of the ferret (Mustela putorius furo) using real-time PCR. Veterinary immunology and immunopathology. 2009;130(1–2):88–91. [DOI] [PubMed] [Google Scholar]
- 18.Rubinov M, Sporns O. Complex network measures of brain connectivity: Uses and interpretations. NeuroImage. 2010;52(3):1059–69. [DOI] [PubMed] [Google Scholar]
- 19.Fair DA, Cohen AL, Dosenbach NUF, et al. The maturing architecture of the brain’s default network. Proceedings of the National Academy of Sciences of the United States of America. 2008;105(10):4028–32. [DOI] [PMC free article] [PubMed] [Google Scholar]
- 20.Fair DA, Cohen AL, Power JD, et al. Functional brain networks develop from a “local to distributed” organization. PLoS computational biology. 2009;5(5):e1000381–e. [DOI] [PMC free article] [PubMed] [Google Scholar]
- 21.Fair DA, Dosenbach NUF, Church JA, et al. Development of distinct control networks through segregation and integration. Proceedings of the National Academy of Sciences of the United States of America. 2007;104(33):13507–12.17679691 [Google Scholar]
- 22.Gong G, Rosa-Neto P, Carbonell F, et al. Age- and gender-related differences in the cortical anatomical network. The Journal of neuroscience : the official journal of the Society for Neuroscience. 2009;29(50):15684–93. [DOI] [PMC free article] [PubMed] [Google Scholar]
- 23.Meunier D, Achard S, Morcom A, Bullmore E. Age-related changes in modular organization of human brain functional networks. NeuroImage. 2009;44(3):715–23. [DOI] [PubMed] [Google Scholar]
- 24.Buckner RL, Sepulcre J, Talukdar T, et al. Cortical hubs revealed by intrinsic functional connectivity: mapping, assessment of stability, and relation to Alzheimer’s disease. The Journal of neuroscience : the official journal of the Society for Neuroscience. 2009;29(6):1860–73. [DOI] [PMC free article] [PubMed] [Google Scholar]
- 25.Liu Y, Liang M, Zhou Y, et al. Disrupted small-world networks in schizophrenia. Brain. 2008;131(4):945–61. [DOI] [PubMed] [Google Scholar]
- 26.Wang L, Zhu C, He Y, et al. Altered small-world brain functional networks in children with attention-deficit/hyperactivity disorder. Human Brain Mapping. 2009;30(2):638–49. [DOI] [PMC free article] [PubMed] [Google Scholar]
- 27.Dobbing J, Sands J. Comparative aspects of the brain growth spurt. Early human development. 1979;3(1):79–83. [DOI] [PubMed] [Google Scholar]
- 28.McPherson RJ, Juul SE. Erythropoietin for infants with hypoxic-ischemic encephalopathy. Current opinion in pediatrics. 2010;22(2):139–45. [DOI] [PMC free article] [PubMed] [Google Scholar]
- 29.Traudt CM, McPherson RJ, Bauer LA, et al. Concurrent erythropoietin and hypothermia treatment improve outcomes in a term nonhuman primate model of perinatal asphyxia. Developmental neuroscience. 2013;35(6):491–503. [DOI] [PMC free article] [PubMed] [Google Scholar]
- 30.Chakkarapani E, Dingley J, Aquilina K, et al. Effects of xenon and hypothermia on cerebrovascular pressure reactivity in newborn global hypoxic-ischemic pig model. Journal of cerebral blood flow and metabolism : official journal of the International Society of Cerebral Blood Flow and Metabolism. 2013;33(11):1752–60. [DOI] [PMC free article] [PubMed] [Google Scholar]
- 31.Dingley J, Tooley J, Liu X, et al. Xenon Ventilation During Therapeutic Hypothermia in Neonatal Encephalopathy: A Feasibility Study. Pediatrics. 2014;133(5):809. [DOI] [PubMed] [Google Scholar]
- 32.Thoresen M, Hobbs CE, Wood T, et al. Cooling Combined with Immediate or Delayed Xenon Inhalation Provides Equivalent Long-Term Neuroprotection after Neonatal Hypoxia—Ischemia. Journal of Cerebral Blood Flow & Metabolism. 2009;29(4):707–14. [DOI] [PubMed] [Google Scholar]
- 33.Snyder JM, Wood TR, Corry K, et al. Ontogeny of white matter, toll-like receptor expression, and motor skills in the neonatal ferret. International journal of developmental neuroscience : the official journal of the International Society for Developmental Neuroscience. 2018. [DOI] [PMC free article] [PubMed] [Google Scholar]
- 34.Zhou J, Butler EE, Rose J. Neurologic Correlates of Gait Abnormalities in Cerebral Palsy: Implications for Treatment. Frontiers in human neuroscience. 2017;11:103-. [DOI] [PMC free article] [PubMed] [Google Scholar]
- 35.Jantzie LL, Robinson S. Preclinical Models of Encephalopathy of Prematurity. Developmental neuroscience. 2015;37(4–5):277–88. [DOI] [PMC free article] [PubMed] [Google Scholar]
- 36.Durán-Carabali LE, Arcego DM, Odorcyk FK, et al. Prenatal and Early Postnatal Environmental Enrichment Reduce Acute Cell Death and Prevent Neurodevelopment and Memory Impairments in Rats Submitted to Neonatal Hypoxia Ischemia. Molecular Neurobiology. 2018;55(5):3627–41. [DOI] [PubMed] [Google Scholar]
- 37.Johnston MV, Fatemi A, Wilson MA, Northington F. Treatment advances in neonatal neuroprotection and neurointensive care. The Lancet Neurology. 2011;10(4):372–82. [DOI] [PMC free article] [PubMed] [Google Scholar]
- 38.Sheldon RA, Aminoff A, Lee CL, et al. Hypoxic Preconditioning Reverses Protection After Neonatal Hypoxia-Ischemia in Glutathione Peroxidase Transgenic Murine Brain. Pediatric research. 2007;61:666. [DOI] [PubMed] [Google Scholar]
- 39.Garipis N, Hoffmann KP. Visual field defects in albino ferrets (Mustela putorius furo). Vision Research. 2003;43(7):793–800. [DOI] [PubMed] [Google Scholar]
Associated Data
This section collects any data citations, data availability statements, or supplementary materials included in this article.


