

Abstract
Motivation
Single-cell RNA-sequencing (scRNA-seq) offers unprecedented resolution for studying cellular decision-making processes. Robust inference of cell state transition paths and probabilities is an important yet challenging step in the analysis of these data.
Results
Here we present scEpath, an algorithm that calculates energy landscapes and probabilistic directed graphs in order to reconstruct developmental trajectories. We quantify the energy landscape using ‘single-cell energy’ and distance-based measures, and find that the combination of these enables robust inference of the transition probabilities and lineage relationships between cell states. We also identify marker genes and gene expression patterns associated with cell state transitions. Our approach produces pseudotemporal orderings that are—in combination—more robust and accurate than current methods, and offers higher resolution dynamics of the cell state transitions, leading to new insight into key transition events during differentiation and development. Moreover, scEpath is robust to variation in the size of the input gene set, and is broadly unsupervised, requiring few parameters to be set by the user. Applications of scEpath led to the identification of a cell-cell communication network implicated in early human embryo development, and novel transcription factors important for myoblast differentiation. scEpath allows us to identify common and specific temporal dynamics and transcriptional factor programs along branched lineages, as well as the transition probabilities that control cell fates.
Availability and implementation
A MATLAB package of scEpath is available at https://github.com/sqjin/scEpath.
Supplementary information
Supplementary data are available at Bioinformatics online.
1 Introduction
Since it first became possible to simultaneously measure thousands of genes in many single cells (Islam et al., 2011), technological developments in single-cell RNA sequencing (scRNA-seq) analyses have dramatically improved (Svensson et al., 2017). Concurrently, methods are required that are suitable for the analysis of these data, which are inherently of very large dimension, necessitating some form of computational analysis for any meaning to be drawn from them (Tanay and Regev, 2017). Such data analyses include the identification of functionally relevant (sub-)populations of cells, cell state transitions along developmental or other trajectories, hierarchical lineage relationships (e.g. stem cell differentiation) and pseudotemporal ordering.
A number of computational methods have been developed to address these tasks. Monocle was the first of a series of pseudotemporal ordering algorithms, and uses a combination of independent component analysis and a minimal spanning tree (MST) algorithm to build a differentiation trajectory (Trapnell et al., 2014). Monocle 2 has been recently released, which uses reverse graph embedding, producing more accurate trajectories than its predecessor (Qiu et al., 2017). TSCAN uses a cluster-based MST, improving upon the original Monocle (Ji and Ji, 2016). Other tools include DPT, which uses diffusion-like random walks (Haghverdi et al., 2016), Mpath, which uses neighborhood-based cell state transitions (Chen et al., 2016) and TASIC, which uses a probabilistic graphical model (Rashid et al., 2017).
The metaphorical epigenetic landscape conceived by Waddington is frequently used to depict or describe cell fate decision-making processes (Mojtahedi et al., 2016; Moris et al., 2016). As yet however, producing robust hierarchical lineage maps between cell states, and determining their corresponding transition probabilities, remains challenging. Motivated in part by such Waddington-like landscapes, recent works have sought to quantify cell fate processes such as differentiation, either using entropy to measure the current state of a cell: SCENT (Teschendorff and Enver, 2017); StemID (Grun et al., 2016); SLICE (Guo et al., 2017); Dpath (Gong et al., 2017); or by mapping cells to a landscape: HopLand (Guo and Zheng, 2017); Topslam (Zwiessele and Lawrence, 2017). These methods provide means to characterize the cell fate landscape. For example SLICE and SCENT both quantify differentiation potency, and are able to infer initial cell states a priori and without the need for feature selection. SCENT estimates the signaling entropy of single cells in the context of an interaction network (Teschendorff and Enver, 2017); a particular strength of this method, and one that we will incorporate into our method development below.
Here we introduce single cell Energy path (scEpath): a method for mapping the quantitative energy landscape of single-cell dynamical processes using statistical physics modeling, such that we can obtain transition probabilities between cell states, reconstructed lineages and pseudotemporal ordering of cells. scEpath requires neither feature selection nor the number of branches in the trajectory to be specified, and can predict initial states by inferring direction based on physical principles, i.e. that the energy will decrease towards a minimum at equilibrium (although in biology equilibria may never be reached).
Current methods for scRNA-seq analysis focus of variation between isolated genes, i.e. without accounting for statistical dependencies between genes (Babtie et al., 2017; Tanay and Regev, 2017). Underpinning our algorithm is consideration of such gene interactions within local neighborhoods, which are input to estimate the single-cell energy (scEnergy) within the context of a gene network. Similarity between (groups of) cells and thus the quantitative energy landscape can then be inferred. In order to infer the cell state lineage and transition probabilities, we combine scEnergy with a distance-based measure. scEpath also performs downstream analyses including identification of marker genes and transcription factors important for specific cell clusters over pseudotime.
The rest of the paper is organized as follows: in the next section we summarize the methods used in scEpath (full details of the methods are given in the Supplementary Methods). We then assess the performance of scEpath on a simulated dataset and three biological scRNA-seq datasets studying human early embryo development, lung epithelial development and myoblast differentiation. We assess scEpath against current state-of-the-art tools, and conclude with a discussion.
2 Materials and methods
scEpath takes X = (xij) as input, where X is an expression matrix in which columns correspond to cells and rows correspond to genes/transcripts. Each element of X gives the expression (e.g. TPM, FPKM or UMI values) of a gene/transcript in a given cell. We take the log2-transform, i.e. log2(X + 1), and for convenience, we still denote this preprocessed expression matrix by X. scEpath then calculates the energy landscape, cell state transition probabilities, pseudotime and pseudotime-dependent maker genes. A schematic description of the steps of the scEpath algorithm is given in Figure 1, an overview is below, and detailed description is given in Supplementary Methods.
Fig. 1.
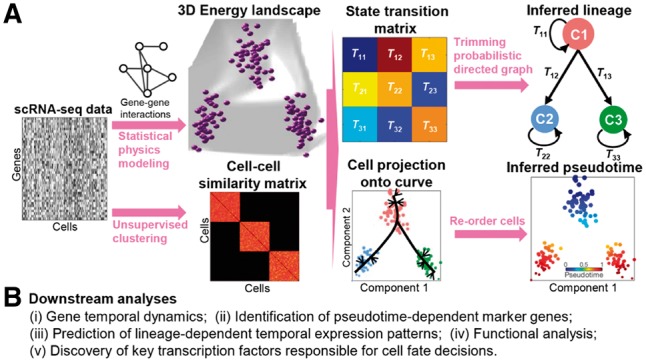
Overview of scEpath. (A) Given a gene expression matrix as input, scEpath first constructs a gene-gene interaction network, then learns a cell-cell similarity matrix using an unsupervised clustering method. Through a combination of statistical physics modeling of single cell energy and principal component analysis, gene expression patterns are then mapped on to energy landscapes, and a cell-state probabilistic transition matrix is inferred. Cell lineages are inferred by finding the maximum probability flow in the energy-directed probabilistic graph. The pseudotemporal ordering is constructed by projecting cells onto the principal curve embedded in the first two principal components and re-ordering the cells according to the position of projection points. (B) Downstream analyses that scEpath can perform to reveal additional molecular and functional mechanisms
2.1 Construction of a gene-gene interaction network
scEpath infers a correlation-based interaction network between genes, i.e. a network with n nodes (genes) that is specified by its adjacency matrix A = (aik), where aiktakes value 1 or 0 depending on the presence whether nodes i and k are linked or not (See Supplementary Methods).
2.2 Calculation of single cell energy (scEnergy)
Waddington’s epigenetic landscape is an abstract metaphor frequently used to describe lineage specification and cell fate decisions (Li et al., 2016; Moris et al., 2016), however the question of whether such a landscape can be mapped out quantitatively to infer transition probabilities between cell states and cellular trajectories remains largely unanswered. To address this question and better understand the relationship between gene expression stochasticity and phenotypic variability, we employed a statistical physics-based approach to quantitatively measure developmental states of single cells. The state of a cell j containing n genes is represented by a random vector , where Yij indicates the expression of gene i in cell j. Yjis then modeled by the Boltzmann–Gibbs distribution: where pj(y) is the probability that a system will be in a cell state j with the gene expression pattern y, Ej(y) is the scEnergy of cell j and m is the number of states accessible to the system, e.g. the number of cells.
Current methods for single cell analysis mostly do not consider statistical dependencies among genes (Babtie et al., 2017; Jin et al., 2017; Tanay and Regev, 2017). It is however reasonable to assume that if the energy of a gene depends on its expression, then it should also depend on the expression levels of genes that are closely interacting with it. Furthermore, gene expression is more promiscuous in multipotent cells, becoming restricted in differentiated cells (Banerji et al., 2013; Teschendorff and Enver, 2017; Zipori, 2004). This restriction that occurs during differentiation results in decreases in energy, as genes have fewer neighboring ‘on’ genes. Thus, given the level of functional interdependency between molecular components in a cell, following the logic of (Teschendorff and Enver, 2017) we defined an energy function incorporating nearest-neighbor correlations based on maximum-entropy and statistical thermodynamics (Presse et al., 2013; Rietman et al., 2017):
| (1) |
where yijrepresents the normalized expression level (rescaled between 0 and 1) of gene i in cell j and N(i) is the neighborhood of node i (including i) in the network. We define Eij(y) = 0 when yij = 0. In addition, this model shows that not only each cell has an associated value representing its scEnergy (Ej), but also each gene is assigned a local energy state Eij. We define the normalized scEnergy as:
| (2) |
where is the average scEnergy across all the cells; the normalized scEnergy is used throughout scEpath.
2.3 Energy landscape visualization via principal component analysis and structural clustering
To visualize the energy landscape, scEpath performs Principal Component Analysis (PCA) on the energy matrix E = (Eij). We then fit a surface using piecewise linear interpolation over the first two PCA components and energy of each cell. In addition, we plot scEnergy against energy distance, which is defined as the distance (L1 norm) from the cell with the maximum scEnergy to each other cell in the low-dimensional space. To identify the cell states, scEpath performs structural clustering using an unsupervised framework called single-cell interpretation via multikernel learning (SIMLR) (Wang et al., 2017). scEpath uses gap properties of the eigenvalue spectrum (von Luxburg, 2007) to determine the number of desired clusters by analyzing the Laplacian matrix derived from the cell-to-cell similarity matrix learned by SIMLR. Generally, the number of clusters N is usually given by the value of N that maximizes the eigen-gap (difference between consecutive eigenvalues) (for full details see Supplementary Methods).
2.4 Inference of transition probabilities
scEpath defines the metacell as the set of cells that occupies θ1 percent of the total energy in each cluster, and we set θ1= 80% by default. scEpath employs Tukey's trimean (TM) to estimate the energy of a metacell: . The energy of a metacell k is then the TM of the energies of the cells composing that metacell. The expression of a gene in a metacell is the TM of the expression values for that gene in all cells comprising that metacell. The probability that a given system will be in metacell k with energy can be calculated from the Boltzmann–Gibbs distribution:
| (3) |
where N is the number of metacells. The probability that the system leaves this metacell is thus . Next we assume that the probability of entering a state l from state k is inversely proportional to the pair-wise distance in reduced dimensional space. Since we argue that any distance-based transition probability should be symmetrical, we define a symmetrical transition matrix based on pair-wise distances between metacells, which is given by:
| (4) |
where π is the stationary distribution for the asymmetrical transition matrix that is derived using the Markov chains theory (see Supplementary Methods). Combining Eqs. (3) and (4), scEpath defines the transition probability Tkl between metacell k and metacell l as follows:
| (5) |
2.5 Inference of cell lineage hierarchy via probabilistic directed graph construction
scEpath constructs a probabilistic directed graph in which nodes represent metacells and edges connecting metacells are weighted by the transition probability between these metacells. Each metacell has an associated energy, and edge direction on the graph is inferred by comparing metacell energies. Since energy is expected to decrease during developmental processes, directionality of the edges is determined by significant decreases in energy; here significance is determined by a two-sided Wilcoxon rank-sum test, where the null hypothesis states that energies of the cells included in the metacells under comparison have equal medians. scEpath rejects the null hypothesis at the α significance level (Default: α = 0.01). If it fails to reject the null hypothesis, the edge is marked as bidirectional. Taken together, the weighted matrix W of the inferred probabilistic directed graph is given by
| (6) |
where indicates P-value returned from the two-sided Wilcoxon rank sum test of metacells k and l.
In the probabilistic directed graph derived by scEpath, some connections (particularly those with low transition probabilities) can be artifacts due the unavoidable technical noise in single-cell experiments (Tanay and Regev, 2017), to account for which, scEpath removes the connections with low transition probabilities by learning a maximum probability flow in the probabilistic directed graph defined by a weighted matrix W. This problem is equivalent to find a minimum directed spanning tree (MDST) by setting the edge weights to be 1-W. A MDST rooted at r is a directed spanning tree rooted at r of minimum weights. scEpath determines the root node (initial state) as the metacell with highest energy. As this method tends to connect metacells that are close (measured by high transition probability, i.e. high expression similarity) to each other to achieve the maximum probability flow and minimal number of edges, the resulting tree approximates the cell state transition network.
2.6 Reconstruction of pseudotime
Once the cell lineage structure has been determined, scEpath reconstructs pseudotime by ordering individual cells along developmental trajectories. scEpath orders cells separately for each lineage branch via a principal curve-based approach. A smooth one-dimensional curve that passes through the middle of the data in reduced dimensional space is fit. Each cell is projected onto the principal curve such that the projected point is closest to the cell in an orthogonal sense. In this way, all cells can be placed in order according to the projected positions. Once cells are ordered, pseudotime is computed for each lineage path. Then scEpath rescales the pseudotime such that it is bounded in [0, 1].
To measure the accuracy of the reconstructed pseudotime based on the ordering expected by independent sources of information (e.g. true data collection time), we define a pseudotime reconstruction score (PRS)
| (7) |
where c and c′ are the number of concordant and disconcordant pairs of cells, respectively.
2.7 Discovery of molecular and functional mechanisms responsible for cell fate decisions
scEpath also identifies pseudotime-dependent marker genes that are significantly changed along pseudotime by creating a smoothed version of gene expression. To discover key transcription factor programs responsible for cell states and state transitions during development, we first collected the TFs that are annotated in the Animal Transcription Factor Database (AnimalTFDB 2.0) (Zhang et al., 2015) among the identified pseudotime-dependent genes. scEpath then declares potentially important TFs for directing cell fate choices if these TFs are differentially expressed between consecutive clusters on one lineage path. In addition, transcription factor regulatory networks are inferred to study cell-state transitions at the network level. Moreover, multiscale transition dynamics can be explored using scEpath by performing hierarchical clustering of pseudotime-dependent genes and functional enrichment analysis of the derived gene clusters (See details in Supplementary Methods).
3 Results
We tested the performance of scEpath using a simulated dataset (see Supplementary Note 1 and Fig. S1) and three independent published scRNA-seq datasets that have been previously used for comparison and validation of pseudotime inference. These consist of cells from human early embryos (HEE) (GSE36552) (Yan et al., 2013), from mouse lung epithelium specification (LES) (GSE52583) (Treutlein et al., 2014) and from human skeletal muscle myoblasts (HSMM) (GSE52529) (Trapnell et al., 2014).
3.1 scEpath identifies transcriptional dynamics on multiple scales during human early embryo development
To test the effectiveness of scEpath, we first used scRNA-seq data consisting of 88 cells from seven stages (from oocytes to blastocyst) in human early embryos (HEE) (Yan et al., 2013). To construct a gene co-expression network, we investigated the relationship between the number of nodes (genes)/edges and the threshold, and chose the highest threshold without a significant reduction in the total number of genes of the constructed network. We hence selected a threshold 0.5, giving a network consisting of 16, 664 genes (Supplementary Fig. S2). Then the scEnergy of each cell is calculated using Eqs. (1) and (2), and visualized using principal components (Fig. 2A, Supplementary Fig. S11A). Unsupervised clustering identified six metacells (Supplementary Fig. S8A); of these six, one comprises oocytes, zygotes and 2-cell embryos, the 4-cell, 8-cell and morula stages cluster into distinct metacells, and two metacells represent the late blastocyst stage (Fig. 2A and B). Figure 2C–E depict the 3D energy path, showing how cells transition from oocytes to blastocysts along landscape ‘valleys’.
Fig. 2.

scEpath reconstructed the developmental lineage and a high-resolution view of the transcriptional programs of human early embryos. (A) Cells visualized on the first two principal components, colored by their experimentally verified developmental stage. (B) Cells are colored according to unsupervised clustering. Cell size is proportional to scEnergy. (C) Overall energy landscape view in 3D. The developmental trajectories are shown by a curve: white indicates initial and blue indicates later stages. (D) Energy landscape view from another aspect, showing the transition path during late stages. (E) Contour plot of the energy landscape: solid blue line denotes actual transition path; dashed blue lines indicate other possible paths according to the locations of landscape ‘valleys’; numbers represent transition probabilities between two metacells. (F) Cells visualized on the scEnergy distance–scEnergy space (the distance was normalized). Inset: Comparison of energy distributions among the identified cell clusters. ‘***’: P-value < 0.001, ‘*’: 0.01 < P-value < 0.05, ‘n.s.’: not significant. (G) Left panel: ‘Rolling wave’ plot shows the normalized-smoothed expression pattern of pseudotime-dependent genes (n = 9545) clustered into nine groups (I–IX). Right panel: Average expression of the nine gene clusters along pseudotime. (H) Transcriptional factor co-expression network, showing putative activating (inhibiting) relationships according to significant positive (negative) correlations. The node size is proportional to their betweenness centrality reflecting the contribution to the communication between two subnetworks. (J) scEpath revealed a linear lineage in which transition probabilities are shown and node size corresponds to the energy (Color version of this figure is available at Bioinformatics online.)
Significant decreases were found at each consecutive step from C2 to C6, however we found no significant differences between the energy distributions of the first two metacells C1 and C2 (by a two-sided Wilcoxon rank sum test, Fig. 2F Inset). In an attempt to resolve the difference between C1 and C2, we plot the scEnergy distance against the scEnergy, which suggests a separation between these two clusters in this two-dimensional space (Fig. 2F). We also used SCENT to calculate the signaling entropy for C1 and C2, and found that it was higher for C1 than C2, although this difference was not significant (Supplementary Fig. S30A). If we compare these results to the original data, we see that C1 contains oocytes, thus does indeed represent the initial state. Although the energy landscape is immediately suggestive of permissible transitions (e.g. by following valleys from C1/C2 to C5, or from C3 to C6; Fig. 2E), we find that the lineage is best determined by combining the energy landscape with a transition matrix. The resulting transition probabilities that scEpath predicts indicate that the probabilities of transitions from C2 to C3, and from C3 to C4, are much higher than the examples listed above (i.e. C2 to C5, or C3 to C6) (Fig. 2E). scEpath then predicted a linear lineage from C1 to C6 [the stable state which had the lowest scEnergy and the largest metacell probability (probability of remaining in this state)] (Fig. 2J). This de novo reconstruction closely follows the known progression of human early embryos from oocyte to late blastocyst. Analysis of known markers collected from (Yan et al., 2013) were in very good agreement with the pseudotemporal ordering predicted by scEpath, with, e.g. LIN28B, FGFR4 and CLDN10 being upregulated while DPPA3 and SALL2 are downregulated during development (Supplementary Fig. S9).
To investigate molecular mechanisms driving cell state transitions, scEpath identifies pseudotime-dependent marker genes along the lineage path. Hierarchical clustering of the pseudotime-dependent genes resulted in nine temporal ‘rolling wave’ clusters of transcriptional changes during development (Fig. 2G, Supplementary Fig. S10A). Several gene clusters were downregulated on different time scales; and enriched common or specific gene function signatures can be found (Supplementary Fig. S11C). Gene clusters I, III and IV were all enriched for ‘cell cycle’, while notably, gene cluster III (downregulated late), was specifically enriched for ‘neurogenesis’ and ‘chromatin modification’. Cluster V exhibited interesting transient dynamics: gradually increasing in expression until the 8-cell stage before downregulation. In human embryos the major maternal-zygotic transition happens at the 8-cell stage (Braude et al., 1988). Combining clusters produces a high-resolution picture of the transcriptional spectrum in which we can identify several different time scales. Our results thus depict a detailed view of the transcriptional dynamics during human early embryo development.
scEpath can be used to identify TFs important for cell state transitions, as we demonstrate here in human embryos (Supplementary Fig. S10C). The temporal expression dynamics of 40 representative TFs are shown in Supplementary Figure S11B, suggesting continuously transcription regulatory profiles during embryonic development. scEpath found that several well known pre-implantation-specific regulators such as UBTFL1, NANOG, SOX2, KLF4 and GATA2 were successively upregulated along this lineage path. In addition, scEpath also predicted novel TFs, such as ZNF736, KLF10, IRX5 and SNAI1, which exhibited very similar expression pattern to known TFs and thus represent attractive targets for future studies. Finally, we constructed a TF regulation network based on pairwise correlation of expression levels across all stages of development (see Supplementary Methods). This revealed three densely connected subnetworks, regulating early, intermediate and late development respectively (Fig. 2H).
3.2 scEpath infers a branched lineage during murine lung development, with branch-specific transcriptional patterns
Next, we applied scEpath to data describing the development of mouse lung epithelium. Cells were collected from embryonic mouse lung at four developmental stages: E14.5, E16.5, E18.5 and adult (Treutlein et al., 2014), totaling 155 cells. We studied cells comprising the mouse lung alveolar type 2 (AT2) branch in isolation, to investigate the development of this lineage branch before considering the full system (see Supplementary Note 2 and Figs S12–S14).
Applying scEpath to all the full dataset (155 epithelial cells), we identified six metacells including various progenitors and differentiated cell types: early EPs (early progenitor), late EPs, BPs (bipotential progenitors), AT1, nascent AT2 and mature AT2 (Fig. 3B, see details in Supplementary Note 3), which is good agreement with previous studies (Treutlein et al., 2014). The energy landscape (Fig. 3C) shows a path from the highest cells in C1 (early EPs), through C2 (late EPs) and C3 (BPs), to the lowest wells denoting C4 (AT1) and C6 (mature AT2); with statistically significant differences between clusters (Fig. 3F Inset). Therefore, energy landscapes define the developmental and cellular hierarchy of the distal mouse lung epithelium, suggesting the potential paths for the maturation of progenitors along both AT1 and AT2 lineages. Although there is no significant scEnergy difference between C3 and C4, we observed a significant difference in the scEnergy distance (Fig. 3F), suggesting that C4 constitutes a distinct branch, bifurcating from C5/C6 at C3. We also calculated the signaling entropies of C3 and C4 using SCENT (Teschendorff and Enver, 2017), and found that significant difference of signaling entropies was observed (P-value < 0.001) (Supplementary Fig. S30C). Furthermore, scEpath inferred AT1 and AT2 lineages emerging from a common BP (Fig. 3G), which is spread on the landscape (Fig. 3D). Each lineage exhibited consistently decreased energies during differentiation. Moreover, scEpath revealed that there is a higher probability of differentiation from BPs into AT1 lineage than to AT2 lineage, which is consistent with the facts that cells in clusters C3 and C4 are from the same developmental stage (E18.5) and that the scEnergies between them are similar.
Fig. 3.

scEpath reconstructed a branched lineage and their distinct transcriptional spectrum during lung epithelial specification. (A) Cells colored by unsupervised clustering. (B) Expression levels of known markers. (C) Overall energy landscape view in 3D. (D) Zoom in on to cells surrounding the branching point on the energy landscape; the oval indicates cells on a ‘flat’ part of the landscape, suggestive of a transition state. (E) Contour plot of the energy landscape. Dashed blue lines indicate another possible path. (F) Cells visualized on the scEnergy distance–scEnergy space. Inset: Comparison of energy distribution. (G) scEpath revealed a branched lineage path in which transition probabilities are shown. (H) Left panel: ‘Rolling wave’ plot of pseudotime-dependent genes (n = 2159) clustered into eight groups (I–VIII). Right panel: Average expressions of the gene clusters along pseudotime in AT1 and AT2 path respectively. (J) Smoothed expression pattern of the identified TFs. TFs indicated by a triangle have been previously described as relevant for lung epithelial specification (Color version of this figure is available at Bioinformatics online.)
scEpath found eight temporal ‘rolling wave’ clusters of transcriptional changes during lung epithelial specification (Fig. 3H, Supplementary Fig. S15A). Three clusters (V, VI and VIII) of genes showed distinct expression kinetics along the AT1 versus AT2 branches while the remaining clusters followed very similar dynamical trends on both branches. In addition, enriched common or specific gene function signatures can also be discovered (see Supplementary Note 3 and Fig. S17).
Moreover, scEpath revealed 32 TFs important for state transitions. Figure 3J and Supplementary Figure S15B demonstrated that the differentiation process is accurately regulated by cell state-specific TFs. Several well-known regulators such as Smad5, Sox11, Sox9 and Hmga1-rs1 were rapidly downregulated in progenitor cells of both lineages. We also observed switch-like inactivation of several TFs such as Id1, Foxp2, Arid4b, Kdm5b and Gtf2i, which are the potential critical events in the differentiation of progenitors and lead to the activation of key regulators (e.g. Klf5, Hopx, Tead1 and Runx1) in AT1 path and key regulators (e.g. Etv5) in AT2 path. Attractively, a recent study demonstrated that Etv5 is essential for the maintenance of AT2 cells and deletion of Etv5 from AT2 cells produced gene and protein signatures characteristic of differentiated AT1 cells (Zhang et al., 2017). In addition, several regulators (e.g. Runx1, Foxn2, Foxn3, Klf5, Id3) have been shown to play critical roles in differentiation (Logan et al., 2015; Ustiyan et al., 2012), but no studies reported their roles in mouse lung epithelial specification (see details in Supplementary Note 3).
3.3 scEpath reveals the myoblast differentiated trajectory and pinpoints the timing of key regulatory events
We applied scEpath to the differentiation of 271 primary human skeletal muscle myoblasts (HSMM) captured using scRNA sequencing. scEpath identified four metacells including: two clusters (C1 and C4) that expressed markers of actively proliferating cells such as CDK1 and CDC20, one cluster (C2) that expressed markers of myogenesis such as MYOG and ENO3, and finally one cluster (C3) that lacked myogenic markers but expressed PDGFRA and PLD1 (Fig. 4B), suggesting that they are interstitial mesenchymal cells (Chen et al., 2016; Trapnell et al., 2014).
Fig. 4.

scEpath revealed the myoblast differentiated trajectory and pinpointed the timing of key regulatory events of myoblast differentiation. (A) Cells colored by unsupervised clustering. (B) Expression levels of known markers in each cluster. (C) Overall energy landscape view in 3D. (D) Inferred lineage path in which transition probabilities are shown. C3 was not shown because only path C1-C4-C2 differentiated into muscle cells while C3 contained contaminating interstitial mesenchymal cells. (E) Comparison of expression patterns of pseudotime-dependent genes (n = 1116; clustered into five groups: I–V) between cluster C3 (left; cells are randomly ordered) and muscle path (middle; cells are ordered according to pseudotime). Right panel: Average expressions of the five gene clusters along pseudotime in muscle path. (F) Smoothed expression pattern of the important TFs delineated by scEpath (Color version of this figure is available at Bioinformatics online.)
The energy landscape of myoblast differentiation (Fig. 4C) shows high heterogeneity, suggesting a complex interplay of cellular processes including proliferation and differentiation. Statistical tests indicate significant decreases of energy from C1 to C4 or C3 (Supplementary Fig. S18A). The scEnergy distance–scEnergy plot suggests a transition path from C1, through C4, to C2 (Supplementary Fig. S18). scEpath predicted a branched lineage starting from C1: with one branch corresponding to myoblast specification (C4 and C2), and the other proceeding from C1 to C3. Analysis highlighted that C3 is composed of contaminating interstitial mesenchymal cells, which were excluded from further analyses in the original work (Trapnell et al., 2014) as well as other studies (Guo et al., 2017; Ji and Ji, 2016). Thus, we remove C3 from further analyses.
scEpath revealed two gene clusters (IV and V) that strongly mark for myoblast differentiation, by comparing expression patterns of myogenic branch with cluster C3 (Fig. 4E, Supplementary Figs S19 and S20). Functional enrichment analysis identified established gene function signatures (e.g. muscle development processes and muscle cell differentiation) in gene clusters IV and V (see Supplementary Note 4 and Fig. S18D). In addition, scEpath identified 31 TFs as important for cell state transitions (Fig. 4F and Supplementary Fig. S20B). Several regulators such as MYOG, MYF5, MYF6, HES6 and ID2 have been previously demonstrated as critical in regulating myogenic differentiation (Buckingham and Rigby, 2014; Trapnell et al., 2014). Figure 4F shows that they were significantly upregulated in muscle path while downregulated in non-muscle path. HMGB2 exhibited immediate downregulation, consistent with previous findings that an HMGB2 knockdown inhibited myoblast proliferation and stimulated differentiation (Zhou et al., 2016). We predict several novel TFs to also be important here due to their similarity in expression pattern with HMGB2, including HMGB3, MYBL2, E2F7, POU5F1 and FOXM1. Moreover, we observed switch-like inactivation of several TFs, such as MYF5, ID2 and SOX11, which are the potential critical events in the muscle differentiation and lead to the activation of key regulators (e.g. HES6, MYOG and KLF5). A previous study showed that switch-like inactivation of ID1 leads to the activation of MYOG (Trapnell et al., 2014). More recently, it was demonstrated that Klf5 regulated muscle differentiation by directly targeting muscle-specific genes in cooperation with MyoD in mice (Hayashi et al., 2016), suggesting that KLF5 is a promising regulator of primary human skeletal muscle myoblasts. Thus, scEpath can pinpoint the timing of key regulatory events and identify novel regulators of differentiation.
3.4 Comparison of scEpath with existing algorithms for pseudotime inference
We compared the performance of scEpath with four current pseudotime inference algorithms: Monocle 1/Monocle 2 (Qiu et al., 2017; Trapnell et al., 2014), TSCAN (Ji and Ji, 2016) and DPT (Haghverdi et al., 2016) on the four experimental datasets discussed above. We use a combination of qualitative and quantitative measures to assess method performance; no one measure is sufficient when little is known about the biological truth. Applying current methods to the two linear trajectories (HEE data and AT2 data), all can successfully reconstruct the trajectories (Supplementary Fig. S21). For LES, only scEpath and Monocle 1/2 can separate the AT1 and AT2 branches (Supplementary Fig. S22A). For the HSMM data, only scEpath, Monocle 1/2 and TSCAN can isolate the mesenchymal cells from the myoblast lineage, while DPT failed (Supplementary Fig. S22B). By comparing the pseudotime reconstruction score (PRS) of the inferred pseudotime with the true time orderings, where known, we can assess the accuracy of those methods. We found that scEpath outperformed Monocle 1 and DPT, and produced trajectories that were overall comparable in accuracy with Monocle 2 and TSCAN (Fig. 5A).
Fig. 5.
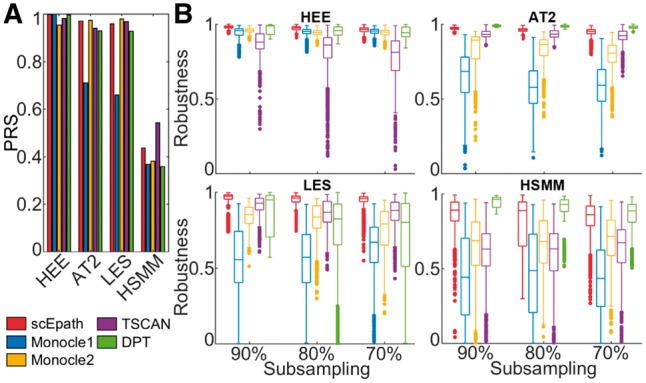
Comparison of scEpath with existing algorithms for pseudotime inference. (A) Comparison of the accuracy of pseudotemporal ordering, measured by Pseudotime Reconstruction Score (PRS). (B) Comparison of robustness (by PRS) of pseudotemporal ordering under repeated subsampling of the cells from each dataset
Next we used two measures (PRS and Pearson Correlation Coefficient) to assess the agreement between pairs of pseudotemporal ordering runs under repeated subsampling (50 times independently) of 90, 80, or 70% of the total number of cells in each dataset (Fig. 5B and Supplementary Fig. S23). These results show that scEpath is more robust than Monocle 1/2 and TSCAN in all cases, and comparable to DPT overall (insignificant differences for HEE and AT2; outperforms DPT for LES; slightly underperforms against DPT for HSMM). We also found that scEpath produced robust results when varying the number of input genes for lineage reconstruction (Supplementary Note 5 and Figs S4–S7), demonstrating that feature selection is not required for successful inference here. These results show that tested against either accuracy or robustness, scEpath performs at least as well as current methods, and if we consider both measures together, then scEpath performs better than current methods. scEpath is thus able to reconstruct pseudotime robustly and (to the best of current knowledge) accurately, without feature selection.
4 Discussion
Increasingly, distinguishing between cell types is fraught with difficulty, as data reveal new phenotypes and different cell states move closer to one another in phenotypic space (Moris et al., 2016; Tanay and Regev, 2017). There is thus a pressing need for measures with which to distinguish between cell states. Here, by introducing the concept of single cell energy (scEnergy) and combining dimension reduction with energy landscape construction we sought to characterize such states along axes of development or lineage specification. We were able to construct 3D energy landscapes of cells, and then in combination with distance measure, we reconstructed lineages, along with cell state transition probabilities, and ordered cells along pseudotime. Downstream analyses by scEpath allow visualization of the transcriptional dynamics, and demonstrate that gene clusters (functional modules) are tightly regulated on different time scales. These outputs allow for the discovery of common and specific gene clusters, temporal dynamics and functional diversification along branched lineages.
Using scEpath we identified a cell-cell communication network implicated in early human embryo specification, involving three transcriptional subnetworks (respectively for early, intermediate and late stages) with strong inhibition between subnetwork motifs and putative activation within each subnetwork. Applying scEpath to mouse lung specification, distinct gene expression dynamics and functional signatures of the two epithelial branches were revealed. Finally, we applied our methods to myoblast differentiation, and found that scEpath was able to isolate mesenchymal cells from the myoblast lineage, and identify novel transcription factors (TFs) (e.g. HMGB3, MYBL2, POU5F1) whose expression patterns closely follow those of known TFs, as well as TFs whose inactivation is strongly implicated in lineage choice (e.g. MYF5, ID2, SOX11).
scEpath is broadly unsupervised, requiring few parameters to be set by the user. In the network construction, we investigated the relationship between the number of nodes (genes)/edges and the threshold, and then chose the highest threshold without a significant reduction in the total number of genes of the constructed network (Supplementary Fig. S2). This approach enables some network pruning (to be more conservative in determining edges) while retaining a large portion of the transcriptome for energy calculations (i.e. reducing information loss). Moreover, we systematically explored the threshold, and found that within a certain range the results derived using scEpath are most consistent and robust (Supplementary Note 6 and Figs S3–S7). Within this range, the networks exhibit approximate scale-free topology based on the degree distribution (Supplementary Fig. S24). The reason behind this may be related to the findings of (Teschendorff et al., 2015) that reveal relationships between signaling entropy, network topology, and cell plasticity. As an alternative approach to study gene networks, rather than construct a network de novo, resources [e.g. BioGRID (Chatr-Aryamontri et al., 2017)] could be used to input interaction network information. We set two parameters (θ1 and θ2) to define cells within a metacell; these thresholds, set for the energy and the distance, respectively, are used to exclude outliers from the metacell. We found that scEpath is robust to these parameters (Supplementary Note 6 and Figs S25–S29), thus adjustment from default values ought to be rarely required.
A crucial aspect of scEpath is its combination of energy-based and distance-based measures, supported by an underlying interaction network, in order to predict pseudotemporal ordering of cells and cell state transition probabilities. Drawing on the success of previous methods that incorporates network information into the calculation of cellular quantities (in the case of SCENT, signaling entropy) (Teschendorff and Enver, 2017), the scEnergy is calculated within the context of a larger gene network. This makes the resulting inferences much less prone to perturbation-driven variation [e.g. gene dropout (Pierson and Yau, 2015) or changes in the input gene sets]. We assessed what benefits the incorporation of network information could offer to scEpath, and found that both the discriminative ability and the robustness of pseudotemporal ordering were improved (Supplementary Note 7 and Fig. S32). Resulting from this network-based approach, scEpath achieves robust and accurate predictions of pseudotime without feature selection (Fig. 5 and Supplementary Fig. S23).
In contrast to most current methods for pseudotime inference [such as Monocle 2, TSCAN, DPT, Bayesian GPLVM (Campbell and Yau, 2016)], scEpath seeks to infer the initial state and the direction of the trajectory without prior knowledge such as marker gene expression. Entropy-based approaches for single-cell analysis—such as SCENT and SLICE (Guo et al., 2017; Teschendorff and Enver, 2017)—can also infer initial states. While scEpath predicts an initial state in the majority of cases, we observed in the human embryonic dataset that there was no significant scEnergy difference between clusters C1 and C2. We found higher entropies for C1 (compared with C2) using SCENT and SLICE, although these differences were also not significant (Supplementary Fig. S30A). This is probably due to the small number of cells (each cluster has only 12 cells). Automatically defining the initial state with confidence thus remains challenging in some cases, and better methods are required. Here, when differences in scEnergy are not significant, other approaches to discriminate these states include using signaling entropy (SCENT), or using marker genes to identify the most plausible initial state biologically, or indeed using other means altogether. There may also be cases for which the initial state is not unique, depending on the biological system and the question of focus (e.g. in the case of quiescent and cycling stem cells).
The cellular energy landscapes constructed in scEpath imply a clear direction of flow from peaks to troughs. Comparing scEnergy with entropy-based measures (e.g. SCENT, SLICE, StemID) that have been used to successfully quantify developmental trajectories, we find high correlations between the measures proposed by SCENT and SLICE (Supplementary Fig. S30), although the transcriptomic entropy proposed in StemID seems to be less closely correlated with developmental states (especially for the HEE and AT2 data). Of note, in some cases only SCENT finds significant differences between cellular states, where other methods including scEpath cannot; for example the bipotent (C3) and AT1 (C4) populations of lung epithelium, which we expect biologically to be different (Supplementary Fig. S30C). These strengths of SCENT motivate us to use this measure to discriminate between cell states for which we do not find significant differences using scEpath alone, ameliorating the lineage inference capabilities in scEpath. Our analyses suggest that scEnergy can discriminate between pluri/multi-potent cells and less potent cells using four different datasets (Supplementary Note 8 and Fig. S31). These results support the rationale—motivated by previous works (Banerji et al., 2013; Teschendorff and Enver, 2017)—behind the use of a network-based measure to discriminate between more and less potent states (with respectively, greater or fewer signaling interactions).
Additional challenges for scEpath offer much potential for future work. For HSMM data, scEpath (as well as other methods tested) inferred a link between proliferating cells and mesenchymal cells (not biologically supported). How to automatically detect and isolate contaminating cells—or in general any cells that are derived from a different source—remains challenging. A limitation of scEpath (shared by most current methods as far as we are aware) is the inability to describe trajectories involving multiple different progenitor cell populations, i.e. multiple initial states. We propose to add this capability by combination of multiple energy landscapes (this will require careful normalization). Its success will permit us to describe more complex biological processes, for example cancers including breast, oligodendroglioma and squamous cell carcinoma, for each of which multiple progenitor species are implicated (Tsoucas and Yuan, 2017). Here heterogeneity is known to compound analyses, and thus careful analysis of gene expression profiles for validation—as well as biological discovery—will be necessary. scEpath reports such gene expression profiles associated with pseudotime, and we find that overall there is excellent agreement between scEpath-predicted expression patterns and experimental evidence, where is it available. In addition, scEpath achieves robustness by using the full distribution of cell energies—rather than a mean value (e.g. SLICE)—to calculate differences between states. This permits generalization to more general biological processes where the energy might not be monotonically decreasing (e.g. direct reprogramming), by decreasing the significance level α in Eq. (6)), thus permitting bidirectional probabilistic graphs. The use of scEnergy to construct energy landscapes and thus infer transition probabilities is therefore warranted, and can reveal differentiation trajectories with fidelity and robustness.
Funding
This work was supported in part by the National Institute of Health [P50GM76516, R01GM107264, R01ED023050, R01NS095355, R01GM123731]; the National Science Foundation [DMS1161621, DMS1562176] and the Jayne Koskinas Ted Giovanis Foundation for Health and Policy jointly with the Breast Cancer Research Foundation.
Conflict of Interest: none declared.
Supplementary Material
References
- Babtie A.C. et al. (2017) Learning regulatory models for cell development from single cell transcriptomic data. Curr. Opin. Syst. Biol., 5, 72–81. [Google Scholar]
- Banerji C.R. et al. (2013) Cellular network entropy as the energy potential in Waddington's differentiation landscape. Sci. Rep., 3, 3039. [DOI] [PMC free article] [PubMed] [Google Scholar]
- Braude P. et al. (1988) Human gene expression first occurs between the four- and eight-cell stages of preimplantation development. Nature, 332, 459–461. [DOI] [PubMed] [Google Scholar]
- Buckingham M., Rigby P.W.J. (2014) Gene regulatory networks and transcriptional mechanisms that control myogenesis. Dev. Cell, 28, 225–238. [DOI] [PubMed] [Google Scholar]
- Campbell K.R., Yau C. (2016) Order under uncertainty: robust differential expression analysis using probabilistic models for pseudotime inference. PLoS Comput. Biol., 12, e1005212.. [DOI] [PMC free article] [PubMed] [Google Scholar]
- Chatr-Aryamontri A. et al. (2017) The BioGRID interaction database: 2017 update. Nucleic Acids Res., 45, D369–D379. [DOI] [PMC free article] [PubMed] [Google Scholar]
- Chen J. et al. (2016) Mpath maps multi-branching single-cell trajectories revealing progenitor cell progression during development. Nat. Commun., 7, 11988. [DOI] [PMC free article] [PubMed] [Google Scholar]
- Gong W. et al. (2017) Dpath software reveals hierarchical haemato-endothelial lineages of Etv2 progenitors based on single-cell transcriptome analysis. Nat. Commun., 8, 14362. [DOI] [PMC free article] [PubMed] [Google Scholar]
- Grun D. et al. (2016) De novo prediction of stem cell identity using single-cell transcriptome data. Cell Stem Cell, 19, 266–277. [DOI] [PMC free article] [PubMed] [Google Scholar]
- Guo J., Zheng J. (2017) HopLand: single-cell pseudotime recovery using continuous Hopfield network-based modeling of Waddington's epigenetic landscape. Bioinformatics, 33, i102–i109. [DOI] [PMC free article] [PubMed] [Google Scholar]
- Guo M. et al. (2017) SLICE: determining cell differentiation and lineage based on single cell entropy. Nucleic Acids Res., 45, e54. [DOI] [PMC free article] [PubMed] [Google Scholar]
- Haghverdi L. et al. (2016) Diffusion pseudotime robustly reconstructs lineage branching. Nat. Methods, 13, 845–848. [DOI] [PubMed] [Google Scholar]
- Hayashi S. et al. (2016) Klf5 regulates muscle differentiation by directly targeting muscle-specific genes in cooperation with MyoD in mice. Elife, 5, e17462.. [DOI] [PMC free article] [PubMed] [Google Scholar]
- Islam S. et al. (2011) Characterization of the single-cell transcriptional landscape by highly multiplex RNA-seq. Genome Res., 21, 1160–1167. [DOI] [PMC free article] [PubMed] [Google Scholar]
- Ji Z., Ji H. (2016) TSCAN: pseudo-time reconstruction and evaluation in single-cell RNA-seq analysis. Nucleic Acids Res., 44, e117. [DOI] [PMC free article] [PubMed] [Google Scholar]
- Jin S. et al. (2017) Domain control of nonlinear networked systems and applications to complex disease networks. Discrete Contin. Dyn. Syst. Ser. B, 22, 2169–2206. [Google Scholar]
- Li C. et al. (2016) Quantifying the landscape and kinetic paths for epithelial-mesenchymal transition from a core circuit. Phys. Chem. Chem. Phys., 18, 17949–17956. [DOI] [PMC free article] [PubMed] [Google Scholar]
- Logan T.T. et al. (2015) Runx1 promotes proliferation and neuronal differentiation in adult mouse neurosphere cultures. Stem Cell Res., 15, 554–564. [DOI] [PubMed] [Google Scholar]
- Mojtahedi M. et al. (2016) Cell fate decision as high-dmensional critical state transition. PLoS Biol., 14, e2000640. [DOI] [PMC free article] [PubMed] [Google Scholar]
- Moris N. et al. (2016) Transition states and cell fate decisions in epigenetic landscapes. Nat. Rev. Genet., 17, 693–703. [DOI] [PubMed] [Google Scholar]
- Pierson E., Yau C. (2015) ZIFA: dimensionality reduction for zero-inflated single-cell gene expression analysis. Genome Biol., 16, 241.. [DOI] [PMC free article] [PubMed] [Google Scholar]
- Presse S. et al. (2013) Principles of maximum entropy and maximum caliber in statistical physics. Rev. Mod. Phys., 85, 1115–1141. [Google Scholar]
- Qiu X. et al. (2017) Reversed graph embedding resolves complex single-cell trajectories. Nat. Methods, 14, 979–982. [DOI] [PMC free article] [PubMed] [Google Scholar]
- Rashid S. et al. (2017) TASIC: determining branching models from time series single cell data. Bioinformatics, 33, 2504–2512. [DOI] [PubMed] [Google Scholar]
- Rietman E.A. et al. (2017) Personalized anticancer therapy selection using molecular landscape topology and thermodynamics. Oncotarget, 8, 18735–18745. [DOI] [PMC free article] [PubMed] [Google Scholar]
- Svensson V. et al. (2017) Exponential scaling of single-cell RNA-seq in the last decade, arXiv: 1704.01379. [DOI] [PubMed]
- Tanay A., Regev A. (2017) Scaling single-cell genomics from phenomenology to mechanism. Nature, 541, 331–338. [DOI] [PMC free article] [PubMed] [Google Scholar]
- Teschendorff A.E. et al. (2015) Increased signaling entropy in cancer requires the scale-free property of protein interaction networks. Sci. Rep., 5, 9646. [DOI] [PMC free article] [PubMed] [Google Scholar]
- Teschendorff A.E., Enver T. (2017) Single-cell entropy for accurate estimation of differentiation potency from a cell's transcriptome. Nat. Commun., 8, 15599. [DOI] [PMC free article] [PubMed] [Google Scholar]
- Trapnell C. et al. (2014) The dynamics and regulators of cell fate decisions are revealed by pseudotemporal ordering of single cells. Nat. Biotechnol., 32, 381–386. [DOI] [PMC free article] [PubMed] [Google Scholar]
- Treutlein B. et al. (2014) Reconstructing lineage hierarchies of the distal lung epithelium using single-cell RNA-seq. Nature, 509, 371–375. [DOI] [PMC free article] [PubMed] [Google Scholar]
- Tsoucas D., Yuan G.C. (2017) Recent progress in single-cell cancer genomics. Curr. Opin. Genet. Dev., 42, 22–32. [DOI] [PMC free article] [PubMed] [Google Scholar]
- Ustiyan V. et al. (2012) Foxm1 transcription factor is critical for proliferation and differentiation of Clara cells during development of conducting airways. Dev. Biol., 370, 198–212. [DOI] [PMC free article] [PubMed] [Google Scholar]
- von Luxburg U. (2007) A tutorial on spectral clustering. Stat. Comput., 17, 395–416. [Google Scholar]
- Wang B. et al. (2017) Visualization and analysis of single-cell RNA-seq data by kernel-based similarity learning. Nat. Methods, 14, 414–416. [DOI] [PubMed] [Google Scholar]
- Yan L. et al. (2013) Single-cell RNA-Seq profiling of human preimplantation embryos and embryonic stem cells. Nat. Struct. Mol. Biol., 20, 1131–1139. [DOI] [PubMed] [Google Scholar]
- Zhang H.M. et al. (2015) AnimalTFDB 2.0: a resource for expression, prediction and functional study of animal transcription factors. Nucleic Acids Res., 43, D76–D81. [DOI] [PMC free article] [PubMed] [Google Scholar]
- Zhang Z. et al. (2017) Transcription factor Etv5 is essential for the maintenance of alveolar type II cells. Proc. Natl. Acad. Sci. USA, 114, 3903–3908. [DOI] [PMC free article] [PubMed] [Google Scholar]
- Zhou X. et al. (2016) HMGB2 regulates satellite-cell-mediated skeletal muscle regeneration through IGF2BP2. J. Cell Sci., 129, 4305–4316. [DOI] [PubMed] [Google Scholar]
- Zipori D. (2004) The nature of stem cells: state rather than entity. Nat. Rev. Genet., 5, 873–878. [DOI] [PubMed] [Google Scholar]
- Zwiessele M., Lawrence N.D. (2017) Topslam: Waddington landscape recovery for single cell experiments, bioRxiv, 057778.
Associated Data
This section collects any data citations, data availability statements, or supplementary materials included in this article.