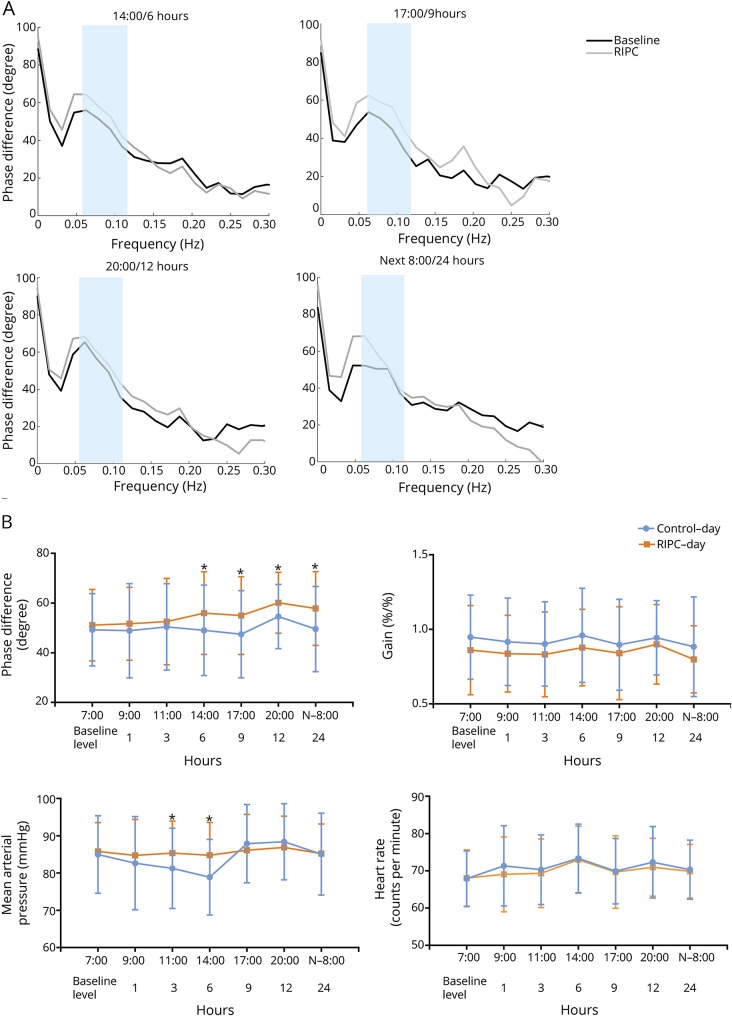
Figure 2. Autoregulatory parameter and statistical analysis of dCA, MAP, and HR.
(A) Autoregulatory parameter derived from the transfer function analysis. (B) Statistical analysis of dynamic cerebral autoregulation (dCA), mean arterial pressure (MAP), and heart rate (HR) by serial measurements. *p < 0.05 for comparison between the control day and remote ischemic preconditioning (RIPC) day.

