

Abstract
Background
Previous studies of human and animal models indicate that inflammation alters lipid metabolism. The pro-protein convertase subtilisin kexin type 9 (PCSK9) plays an important role in lipid metabolism.
Material/Methods
We examined the effect of inflammation on PCSK9 expression and lipid deposition in the kidneys of mice with Adriamycin-induced nephropathy.
Results
The results indicated an increased expression of inflammatory cytokines and lipid deposition over 12 weeks. During this time, the expression of PCSK9 and its transcriptional activator (hepatocyte nuclear factor 1α, HNF1α) decreased, and the expression of the low-density lipoprotein receptor (LDLR) and its transcriptional activator (sterol regulatory element binding protein-2, SREBP-2) increased. Exogenous inflammation appeared to further aggravate this process.
Conclusions
Our mouse model of nephropathy suggests that a key step in the inflammation-induced deposition of lipids in the kidneys is the downregulation renal PCSK9 expression.
MeSH Keywords: Inflammation; Lipid Metabolism; Nephrotic Syndrome; Proprotein Convertases; Receptors, LDL
Background
Nephrotic syndrome is characterized by the co-occurrence of multiple signs and symptoms due to kidney damage; primary nephrotic syndrome (PNS) is diagnosed after the exclusion of secondary causes. Hyperlipidemia (elevated plasma total cholesterol [TC] and low-density lipoprotein [LDL]) is a major pathophysiological feature of PNS [1,2]. When a patient with PNS develops renal sclerosis, the kidneys and plasma typically have increased levels of numerous inflammatory factors. Inflammation can also promote the deposition of lipids in innate renal cells, leading to the proliferation of renal foam cells, the accumulation of extracellular matrix, and eventually to renal sclerosis [3–5]. However, the molecular mechanism by which lipid deposition in intrinsic renal cells induces inflammation is not fully understood.
The LDL receptor (LDLR) is a major plasma membrane protein that binds to LDL in the blood and is a key regulator of LDL and cholesterol metabolism. The uptake of unmodified LDL induces the formation of lipid-filled foam cells, and alters the level of serum cholesterol [5,6]. The LDLR also has high expression on the plasma membranes of renal cells, such as mesangial cells and podocytes [6,7]. Transcription and protein degradation are mainly responsible for regulating the level of LDLR in vivo. The sterol regulatory element binding protein 2 (SREBP2) acts as a key transcription factor that regulates LDLR expression. In particular, SREBP2 binds specifically to the sterol-regulatory element (SRE) on the LDLR promoter, and increases LDLR transcription. SREBP2 also plays an important role in the feedback regulation of LDLR, and mediates intracellular cholesterol homeostasis [7,8]. A previous study found that inflammatory factors increased the expression of SREBP2 in renal mesangial cells and podocytes, leading to increased LDLR transcription and foam cell formation [6–9].
Recent studies found that the proprotein convertase subtilisin/kexin type 9 (PCSK9) can promote the degradation of LDLR in the cytoplasm and lysosomes by binding to the epidermal growth factor domain A (EGF-A) of the LDLR protein [10,11]. Thus, PCSK9 is a major endogenous promoter of LDLR degradation. PCSK9 is mainly expressed in the liver, small intestine, and kidney, and is a major regulator of cholesterol homeostasis within cells [10–12]. The upstream 28 bp region of the PCSK9 gene contains a highly conserved sequence, the hepatocyte nuclear factor 1 (HNF1) binding site, and transcription factor HNF1α increases PCSK9 transcription by binding to this site. Previous research reported that transcription of PCSK9 was lower when there was decreased expression of HNF1α and decreased binding of HNF1α to the HNF1 site in PSCK9 promoter [10–13]. Hence, HNF1α is a key regulator of PCSK9 transcription. Clinical studies indicated that the transcription factor HNF1α has high expression in the kidneys, where it has an important role in the metabolism of lipids, including cholesterol. Several inflammatory factors can downregulate the expression of HNF1α in vivo, and thereby regulate the expression of several related genes [10–15].
We hypothesize that inflammation reduces the transcription of PCSK9 by downregulating the expression of HNF1α, and this leads to reduced degradation of LDLR in innate renal cells. We also hypothesize that inflammation increases the expression of SREBP2, leading to an increase of LDLR transcription and eventually to increased deposition of lipids in the kidney.
Material and Methods
Animals
Ninety-six male BALB/c mice (6-weeks-old, provided by the Center for Experimental Animals, Chongqing Medical University, China) were randomly divided into 4 groups (24 mice per group): a control (CTL) group, an inflammation (IFM) group, an Adriamycin-induced nephrosis (ADR) group, and an Adriamycin-induced nephrosis with inflammation (AWI) group. Mice in the CTL group each received an intravenous injection of 0.9% saline (same volume as the ADR group). Mice in the IFM group each received subcutaneous injections of 0.5 mL 10% casein every other day until sacrifice at 4, 8, or 12 weeks [13,14]. Mice in the ADR group each received an intravenous injection of Adriamycin (10.5 mg/kg body weight; diluted to 10% with 0.9% saline; Pharmacia, Italy). Mice in the AWI group each received an intravenous injection of Adriamycin (aforementioned), and 1 week later received subcutaneous injections of 0.5 mL of 10% casein every other day until sacrifice at 4, 8, or 12 weeks. All study protocols were reviewed and approved by the Chongqing Medical University Institutional Animal Care and Use Committee.
Kidney collection
Mice were sacrificed after 4, 8, or 12 weeks. Kidneys were harvested, and perfused with 0.9% saline until they were pale in color. The upper poles of the left kidneys were preserved in 4% paraformaldehyde for oil red O and immunohistochemical staining. The remaining kidney samples were used for measurements of RNAs, TC, and triglycerides.
Measurement of TC
The TC content of kidneys was determined using a cholesterol enzymatic assay according to the manufacturer’s instructions (Total Cholesterol Test Box, Jiancheng, Nanjing, China).
Oil red O staining
Fresh kidney tissue was cut into 15 μm-thick frozen sections, fixed with 10% neutral formaldehyde for 20 minutes, and washed twice with phosphate-buffered saline (PBS) for 5 minutes. Tissue sections were stained with Oil red O (Sigma, USA) in a dark box for 30 minutes, rinsed with 60% ethanol for 3 seconds, and immediately rinsed twice in distilled water for 5 minutes. Hematoxylin was added for 10 minutes, and then the sections were rinsed in running water for 5 minutes and then covered with glass at room temperature and allowed to dry. Then, 1 to 2 drops of neutral gum were added around the tissue, it was covered with a slide, and lipid deposition was observed immediately under a light microscope (Eclipse E100, Nikon, Japan) at 200-fold.
Immunohistochemistry
Immunohistochemistry (IHC) was used to examine the expression of interleukin (IL)-1β, transforming growth factor beta 1 (TGF-β1), HNF1α, PCSK9, LDLR, and SREBP2 using the following antibodies: rabbit anti-rat IL-1β antibody (working dilution 1: 100; sc-7884, Santa Cruz Biotechnology, USA), rabbit anti-rat TGF-β1 (working dilution 1: 100; sc-146, Santa Cruz Biotechnology), mouse anti-human SREBP2 antibody (working dilution 1: 100; sc-271615, Santa Cruz Biotechnology), mouse anti-human HNF1 α antibody (working dilution 1: 100; sc-393668, Santa Cruz Biotechnology,), rabbit anti-rat LDLR antibody (working dilution 1: 100; ab30532, Abcam, UK), rabbit anti-rat PCSK9 antibody (working dilution 1: 100; ab31762, Abcam). In these experiments, samples were incubated with primary antibodies at 4°C overnight and were then treated with horseradish peroxidase-labeled polymer conjugated to a secondary goat anti-rabbit antibody at 37°C for 30 minutes (PV-6001, Zhongshan, China). Sections were then stained with the diaminobenzidine (DAB) reagent and counterstained with hematoxylin. PBS was substituted for the primary antibodies in the negative controls, and previously confirmed positive tissue specimens were used as positive controls. The expression of all proteins was quantified as the integrated optical density (IOD) using the Image-Pro Plus System.
RNA isolation and real-time polymerase chain reaction (RT-PCR)
Total RNA was isolated from frozen kidney samples using an RNA isolation kit (RP1201, Bioteke, China) according to the manufacturer’s protocol. Reverse transcription was performed using a reverse transcription kit (DRR047A, Takara, China), and 1 μL of sample was used for reverse transcription into the complementary DNA (cDNA). The reaction volume for real-time quantitative polymerase chain reaction (RT-qPCR) was 10 μL (1 μL cDNA, 0.4 μL forward sequence primer, 0.4 μL reverse sequence primer, 5 μL SYBR, and 3.2 μL ddH2O), and PCR was performed using the following protocol: 40 cycles of denaturation at 95°C for 30 seconds, annealing at 59°C for 30 seconds, and extension at 65°C for 30 seconds, and then a final extension reaction (85°C) for 5 minutes. The specific primers were designed by TaqMan primer express (Table 1). The expression of TGF-β1, IL-1β, HNF1α, PCSK9, LDLR, and SREBP2 mRNAs are presented relative to β-actin, and were determined using the 2ΔΔCt method.
Table 1.
Sequences of primers used for real-time quantitative polymerase chain reaction.
| Gene | Sequence |
|---|---|
| GAPDH | Forward 5′-CCTGGAGAAACCTGCCAAGTATG-3′ |
| Reverse 5′-GGTCCTCAGTGTAGCCCAAGATG-3′ | |
| HNF1α | Forward 5′-GCTCTGAAGATGACACGGATGAC-3′ |
| Reverse 5′-ATGGGTCCTCCTGAAGAAGTGAC-3′ | |
| LDLR | Forward 5′-TGATTCCAAACTCCACTCTATCTCC-3′ |
| Reverse 5′-ACATCTGTCCAATACACTTTGTCCTC-3′ | |
| PCSK9 | Forward 5′-TTCTTGGTGAAGATGAGCAGTGAC-3′ |
| Reverse 5′-AGGAGTCTTCCTCAATGTACTCCAC-3′ | |
| SREBP2 | Forward 5′-TGATTGTCTTGAGCGTCTTTGTG-3′ |
| Reverse 5′-GGATAAGCAGGTTTGTAGGTTGG-3′ | |
| IL-1β | Forward 5′-CCTTTTGACAGTGATGAGAATGACC-3′ |
| Reverse 5′-GATTTGAAGCTGGATGCTCTCATC-3′ | |
| TGF-β1 | Forward 5′-CGAAGCGGACTACTATGCTAAAGAG-3′ |
| Reverse 5′-CCGAATGTCTGACGTATTGAAGAAC-3′ |
GAPDH – glyceraldehyde 3-phosphate dehydrogenase; HNFIα – hepatocyte nuclear factor 1α; LDLR – low-density lipoprotein receptor; PCSK9 – pro-protein convertase subtilisin kexin type 9; SREBP2 – sterol regulatory element binding protein 2; IL-1β – interleukin 1β; TGF-β1 – transforming growth factor beta 1.
Correlation analysis
Spearman’s correlation analysis was used to determine the significance of correlations between the expression of inflammatory cytokines (TGF-β1 and IL-β1), PCSK9, and TC in the kidneys of mice in the ADR and AWI groups.
Statistical analysis
SPSS (version 18.0) software was used for data analysis. Groups of data were analyzed using one-way analysis of variance (ANOVA), followed by the Student-Newman-Keuls test. Qualitative data were analyzed using the Kruskal-Wallis test. A P-value below 0.05 was regarded as significant.
Results
Accumulation of lipids, TC, and triglycerides in kidneys
We first examined the deposition of lipids in the kidneys of mice in the 4 groups using Oil red O staining (Figures 1, 2). The CTRL group had very little lipid deposition in the CTL group from week 4 to week 12, but the other 3 groups had increasing lipid deposition over time. The IFM group had significantly more lipid deposition than the CTRL group at week 8 and week 12. At all times, the ADR and AWI groups had significantly more lipid deposition than the CTL group, and the AWI group had significantly more lipid deposition than the IFM and ADR groups.
Figure 1.

Representative oil red O staining results of renal tissues in the control (CTL) group, inflammation (IFM) group, Adriamycin-induced nephrosis (ADR) group, and Adriamycin-induced nephrosis with inflammation (AWI) group at 4, 8 and 12 weeks. Scale bar indicates 100 μm.
Figure 2.
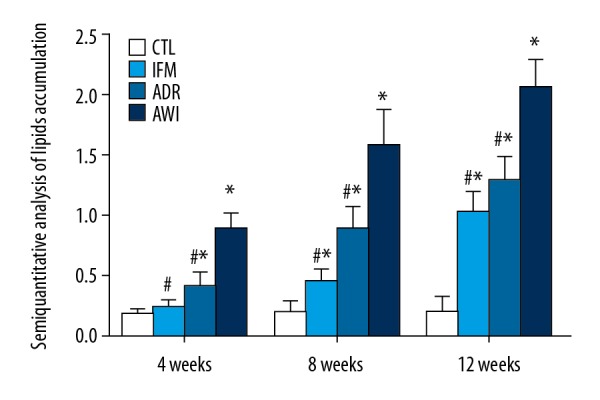
Quantitative analysis of oil red O staining results of kidneys in the 4 groups at 4, 8, and 12 weeks. Values represent means ± standard errors of mean for groups of 8 mice each. For comparisons at the same time point: * P<0.05 versus CTL group, # P<0.05 versus AWI group. CTL – control group; AWI group – Adriamycin-induced nephrosis with inflammation group.
We used an enzymatic method to measure TC levels in the kidneys of the 4 groups after 4, 8, and 12 weeks (Figure 3). From week 4 to week 12, the CTRL group had no significant changes in TC, although the TC levels gradually increased in the other 3 groups over time. The ADR and AWI groups had significantly more TC than the CTRL group at all times, and the IFM group had significantly more TC than the CTRL group at week 8 and week 12. The AWI group had significantly more TC than the IFM group at week 4, and significantly more TC than the ADR and IFM groups at week 8 and week 12.
Figure 3.
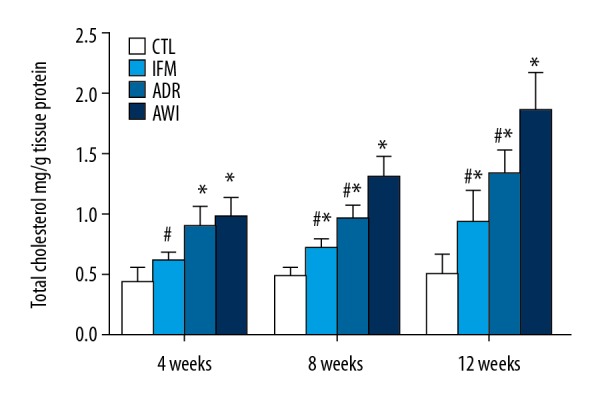
TC levels of the kidneys in the 4 groups at 4, 8, and 12 weeks. Values represent means ± standard errors of mean for groups of 8 mice each. For comparisons at the same time point: * P<0.05 versus CTL group, # P<0.05 versus AWI group. TC – total cholesterol; CTL – control group; AWI group – Adriamycin-induced nephrosis with inflammation group.
Changes in signaling molecules in kidneys
We measured changes in the levels of multiple signaling molecules over time in the 4 groups using IHC and RT-qPCR (Figures 4, 5). The 4 groups had similar changes of TGF-β1 and IL-β1 (markers of inflammation) over time. In particular, the AWI group had the greatest expression of both markers at all times, and the ADR and IFM groups had significantly higher levels than the CTL group at all times. The IFM and ADR groups had similar levels of both molecules at all times.
Figure 4.

(A–F) Renal expression of TGF-β1, IL-1β, HNF1α, PCSK9, LDLR, and SREBP2 proteins (immunohistochemical analysis software was used to analyze the optical density values in the images, and semi-quantitative values of positive expression in kidney tissues were obtained) and mRNAs (from RT-qPCR, relative to GAPDH) in the 4 groups at 4, 8, and 12 weeks. Values represent means ± standard errors of mean for groups of 8 mice each. For comparisons at the same time point: * P<0.05 versus CTL, # P<0.05 versus AWI. TGF-β1 – transforming growth factor beta 1; IL-1β – interleukin 1β; HNF1α – hepatocyte nuclear factor 1α; PCSK9 – pro-protein convertase subtilisin kexin type 9; LDLR – low-density lipoprotein receptor; SREBP2 – sterol regulatory element binding protein 2; RT-q-PCR – real-time quantitative polymerase chain reaction; GAPDH – glyceraldehyde 3-phosphate dehydrogenase; CLT – control group; AWI group – Adriamycin-induced nephrosis with inflammation group.
Figure 5.

Representative immunostaining results of renal tissues for HNF1α, PCSK9, LDLR, and SREBP2 in each group at 4, 8, and 12 weeks. Scale bars indicate 100 μm. HNF1α – hepatocyte nuclear factor 1α; PCSK9 – pro-protein convertase subtilisin kexin type 9; LDLR – low-density lipoprotein receptor; SREBP2 – sterol regulatory element binding protein 2.
The changes of HNF1α and PCSK9 were similar among the 4 groups (Figures 4, 5). The CTRL group had the greatest expression of both molecules and the AWI group had the lowest expression at all times. The IFM and ADR groups had similar expression of both molecules.
All 4 groups had similar changes of LDLR and SREBP2 expression over time (Figures 4, 5). In particular, from week 4 to week 12, the CTRL group had the lowest expression of LDLR and SREBP2, the AWI group had the greatest expression, and the ADR and IFM groups had intermediate levels of expression. The AWI group had significantly lower expression of LDLR and SREBP2 than the IFM and ADR groups at all times.
Correlation of inflammatory cytokines, PCSK9, and TC in kidneys
There was a significant positive correlation between the expression of pro-inflammatory cytokines (TGF-β1 and IL-β1) and TC levels in the kidneys of the ADR and AWI groups (P<0.05). The expression of pro-inflammatory cytokines (TGF-β1 and IL-β1) is negatively correlated with the expression of PCSK9 in the kidneys of the ADR and AWI groups (P<0.05). The expression of PCSK9 is negatively correlated with the TC levels in the kidneys of the ADR and AWI groups (P<0.05)
Discussion
Some children with PNS eventually develop chronic glomerulosclerosis, which is often accompanied by lipid deposition, inflammatory cell infiltration, and secretion of inflammatory factors in the kidneys [4,5,16]. In 1982, Moorhead and colleagues first proposed that “lipid nephrotoxicity” provided a positive feedback between altered lipid metabolism and kidney damage; in other words, kidney damage disrupts lipid metabolism, and the resulting altered lipid metabolism further aggravates kidney damage [17]. Subsequent studies found that the mechanism of glomerular sclerosis is similar to that of atherosclerosis [3,17,18], and this led to a proposal of a disease state identified as “glomerular atherosclerosis”. Additional research has confirmed that inflammatory cell infiltration and expression of inflammatory factors are involved in the processes of atherosclerosis and glomerulosclerosis [3,17,18].
In this study, we established a mouse model of chronic inflammation with nephropathy by administration of Adriamycin and subcutaneous collagen. These mice developed significantly increasing levels of local inflammatory factors in the kidneys during disease progression. In fact, the expression of inflammatory factors in the kidneys our mice were similar the levels in children with PNS. Previous research indicated the kidney cells of patients with PNS secrete a variety of inflammatory mediators, which act on the innate cells of the kidney via autocrine signaling, leading to aggregation of inflammatory cells in the glomeruli, and ultimately to glomerular inflammation [3–6].
Ruan et al. [9,19] revised the original model of “lipid nephrotoxicity” by demonstrating that inflammation is the key cause of kidney injury following abnormal lipid metabolism. Inflammatory factors play a central role in accelerating lipid-mediated kidney injury because they affect the cellular homeostasis of cholesterol. In addition, in vitro experiments [9,19] showed that IL-1β and TNFα promoted the expression of SREBP2 in human mesangial cells (HMCs) and vascular smooth muscle cells (VSMC) in a dose-dependent manner; these proteins bind to a specific promoter sequence in LDLR, thus abrogating the normal feedback regulation, and leading to accumulation of abundant unmodified LDL in mesangial cells and vascular smooth muscle cells. Intracellular accumulation of foam cells also aggravates the renal damage caused by lipid accumulation. Thus, lipid metabolism disorders and inflammation together contribute to kidney damage [1–4,9,19]
Our previous research [3] showed that inflammatory factors can aggravate lipid deposition in the kidney of children with PNS, and that deposition of lipids correlated significantly with expression of IL-1β and TGF-β1. Moreover, expression of LDLR and apoB100 were greater in kidney samples from PNS patients with inflammation than healthy controls and PNS patients without inflammation. Other research reported that expression of inflammatory factors in the kidney correlated with LDLR expression and lipid deposition [6,9,19]. However, the mechanism by which inflammatory factors increase renal LDLR expression and lipid deposition is not fully understood.
Previous research confirmed that LDLR is a key regulator of lipid homeostasis in the kidney [6–9], and that PCSK9 has an important function in LDLR degradation [7,15]. In addition, the transcription factor HNF1α regulates the transcription of PCSK9 [11–13]. The results of the present study demonstrated that when the renal expression of inflammatory factors increased, the renal expression of HFN1α and PCSK9 decreased, and the expression of LDLR increased. There is evidence that the degradation of LDLR in a line of human hepatocellular carcinoma cells (HepG2) declines as the expression of HNF1α declines, and that the binding of HNF1a with PCSK9 decreases as the expression of PCSK9 decreases [13–16]. In addition, as the expression of LDLR increased, the phagocytosis of LDL led to the accumulation of more lipids in HepG2 cells [7–13]. Therefore, we speculate that inflammatory factors may reduce the transcription of PCSK9 by downregulating the expression of HNF1α in intrinsic renal cells, and that this reduces binding of HNF1α to the PCSK9 promoter. This leads to reduced degradation of LDLR, increased levels of LDLR on the plasma membranes of intrinsic renal cells, and lipid deposition in the kidney.
SREBP2 has a key role in the promotion of LDLR transcription [8], and the interaction of 3 proteins (SCAP-SREBP2-LDLR) maintains LDLR transcription at a relatively steady state. Many previous studies [8,9,19] have reported that inflammatory factors enhance the expression of SREBP2 in renal mesangial cells and podocytes, and this allows the SCAP-SREBP2 complex to escape from the endoplasmic reticulum; SREBP2 then moves into the Golgi for lysis and activation, and this promotes LDLR transcription in mesangial cells and podocytes, and thereby increases the intracellular level of cholesterol. The present study indicated that the expression of SREP2 and LDLR in the kidneys of normal mice and mice with Adriamycin-induced nephropathy increased significantly as the expression of inflammatory factors increased. Therefore, we speculate that inflammatory factors promote the expression of LDLR by upregulating SREBP2 in intrinsic renal cells.
Conclusions
Our study of a mouse model of PNS indicated that inflammatory factors promoted lipid deposition in the kidneys of normal mice and mice with Adriamycin-induced nephropathy. Inflammatory factors apparently reduce the transcription of PCSK9 by downregulating the expression of HNF1α in intrinsic renal cells, thereby reducing the degradation of LDLR and increasing the expression of SREBP2. This ultimately leads to an increased level of LDLR on intrinsic renal cells, and increased lipid deposition in the kidneys.
Acknowledgments
We thank Dr. Xiong Z. Ruan (Renal Research Unit, Department of Nephrology, Royal Free Hospital School of Medicine, London, UK) and Yaxi Chen (Lipids Research Center, Chongqing Medical University, Chongqing, China) for their generous provision of key reagents and technical assistance.
Footnotes
Source of support: This study was financially supported by the National Natural Science Foundation of China (Grant No. 81100506)
References
- 1.Agrawal S, Zaritsky JJ, Fornoni A, Smoyer WE. Dyslipidaemia in nephrotic syndrome: Mechanisms and treatment. Nat Rev Nephrol. 2018;14(1):57–70. doi: 10.1038/nrneph.2017.155. [DOI] [PMC free article] [PubMed] [Google Scholar]
- 2.Vaziri ND. Disorders of lipid metabolism in nephrotic syndrome: Mechanisms and consequences. Kidney Int. 2016;90:41–52. doi: 10.1016/j.kint.2016.02.026. [DOI] [PMC free article] [PubMed] [Google Scholar]
- 3.Zhang GF, Li Q, Wang L, et al. The effects of inflammation on lipid accumulation in the kidneys of children with primary nephrotic syndrome. Inflammation. 2011;34(6):645–52. doi: 10.1007/s10753-010-9274-4. [DOI] [PubMed] [Google Scholar]
- 4.Nakamori A, Akagaki F, Yamaguchi Y, et al. Nephrotic syndrome with thrombocytopenia, lymphadenopathy, systemic inflammation, and splenomegaly. Intern Med. 2018;57(8):1123–29. doi: 10.2169/internalmedicine.9556-17. [DOI] [PMC free article] [PubMed] [Google Scholar]
- 5.Yang XJ, Wu Y, Li QQ, et al. CD36 promotes podocyte apoptosis by activating the pyrin domain-containing-3 (NLRP3) inflammasome in primary nephrotic syndrome. Med Sci Monit. 2018;24:6832–39. doi: 10.12659/MSM.909810. [DOI] [PMC free article] [PubMed] [Google Scholar]
- 6.Zhang GF, Li Q, Wang L, et al. Interleukin-1β enhances the intracellular accumulation of cholesterol by dysregulation of low-density lipoprotein receptor and 3-hydroxy-3-methylglutaryl coenzyme A reductase expression in podocytes. Mol Cell Biochem. 2011;346(1–2):197–204. doi: 10.1007/s11010-010-0605-4. [DOI] [PubMed] [Google Scholar]
- 7.Liu S, Vaziri ND. Role of PCSK9 and IDOL in the pathogenesis of acquired LDL receptor deficiency and hypercholesterolemia in nephrotic syndrome. Nephrol Dial Transplant. 2014;29(3):538–43. doi: 10.1093/ndt/gft439. [DOI] [PubMed] [Google Scholar]
- 8.Shimano H, Sato R. SREBP-regulated lipid metabolism: Convergent physiology – divergent pathophysiology. Nat Rev Endocrinol. 2017;13(12):710–30. doi: 10.1038/nrendo.2017.91. [DOI] [PubMed] [Google Scholar]
- 9.Zhang Y, Ma KL, Ruan XZ, Liu BC. Dysregulation of the low-density lipoprotein receptor pathway is involved in lipid disorder-mediated organ injury. Int J Biol Sci. 2016;12(5):569–79. doi: 10.7150/ijbs.14027. [DOI] [PMC free article] [PubMed] [Google Scholar]
- 10.Schulz R, Schlüter KD, Laufs U. Molecular and cellular function of the proprotein convertase subtilisin/kexin type 9 (PCSK9) Basic Res Cardiol. 2015;110:4. doi: 10.1007/s00395-015-0463-z. [DOI] [PMC free article] [PubMed] [Google Scholar]
- 11.Cui CJ, Li S, Zhu CG, et al. Enhanced pro-protein convertase subtilisin/kexin type 9 expression by C-reactive protein through p38MAPK-HNF1α pathway in HepG2 cells. J Cell Mol Med. 2016;20:2374–83. doi: 10.1111/jcmm.12931. [DOI] [PMC free article] [PubMed] [Google Scholar]
- 12.Pavlakou P, Liberopoulos E, Dounousi E, Elisaf M. PCSK9 in chronic kidney disease. Int Urol Nephrol. 2017;49:1015–24. doi: 10.1007/s11255-017-1505-2. [DOI] [PubMed] [Google Scholar]
- 13.Shende VR, Wu M, Singh AB, et al. Reduction of PCSK9 and LDL-C levels by liver-specific knockdown of HNF1alpha in normolipemic mice. J Lipid Res. 2015;56:801–9. doi: 10.1194/jlr.M052969. [DOI] [PMC free article] [PubMed] [Google Scholar]
- 14.Awanami Y, Fukuda M, Nonaka Y, et al. Successful treatment of a patient with refractory nephrotic syndrome with PCSK9 inhibitors: A case report. BMC Nephrol. 2017;18:221. doi: 10.1186/s12882-017-0644-0. [DOI] [PMC free article] [PubMed] [Google Scholar]
- 15.Ferri N, Ruscica M. Proprotein convertase subtilisin/kexin type 9 (PCSK9) and metabolic syndrome: Insights on insulin resistance, inflammation, and atherogenic dyslipidemia. Endocrine. 2016;54:588–601. doi: 10.1007/s12020-016-0939-0. [DOI] [PubMed] [Google Scholar]
- 16.Rosenberg AZ, Kopp JB. Focal segmental glomerulosclerosis. Clin J Am Soc Nephrol. 2017;12(3):502–17. doi: 10.2215/CJN.05960616. [DOI] [PMC free article] [PubMed] [Google Scholar]
- 17.Moorhead JF, Chan MK, El-Nahas M, Varghese Z. Lipid nephrotoxicity in chronic progressive glomerular and tubulo-interstitial disease. Lancet. 1982;2:1309–11. doi: 10.1016/s0140-6736(82)91513-6. [DOI] [PubMed] [Google Scholar]
- 18.Ross R. Atherosclerosis-an inflammatory disease. N Engl J Med. 1999;340:115–26. doi: 10.1056/NEJM199901143400207. [DOI] [PubMed] [Google Scholar]
- 19.Zhong S, Zhao L, Li Q, et al. Inflammatory stress exacerbated mesangial foam cell formation and renal injury via disrupting cellular cholesterol homeostasis. Inflammation. 2015;38(3):959–71. doi: 10.1007/s10753-014-0058-0. [DOI] [PubMed] [Google Scholar]