

Abstract
Mass spectrometry (MS) is one of the primary techniques used for large-scale analysis of small molecules in metabolomics studies. To date, there has been little data format standardization in this field, as different software packages export results in different formats represented in XML or plain text, making data sharing, database deposition, and reanalysis highly challenging. Working within the consortia of the Metabolomics Standards Initiative, Proteomics Standards Initiative, and the Metabolomics Society, we have created mzTab-M to act as a common output format from analytical approaches using MS on small molecules. The format has been developed over several years, with input from a wide range of stakeholders. mzTab-M is a simple tab-separated text format, but importantly, the structure is highly standardized through the design of a detailed specification document, tightly coupled to validation software, and a mandatory controlled vocabulary of terms to populate it. The format is able to represent final quantification values from analyses, as well as the evidence trail in terms of features measured directly from MS (e.g., LC-MS, GC-MS, DIMS, etc.) and different types of approaches used to identify molecules. mzTab-M allows for ambiguity in the identification of molecules to be communicated clearly to readers of the files (both people and software). There are several implementations of the format available, and we anticipate widespread adoption in the field.
Introduction
It is now commonplace for high-throughput quantitative technologies to be used for analysis of biological, biomedical, and environmental samples. Technologies include those for measurements of gene expression using microarrays or RNA sequencing (transcriptomics), proteins by mass spectrometry (MS, proteomics), and MS or nuclear magnetic resonance (NMR) spectroscopy for measuring small molecules/metabolites (metabolomics) and lipids (lipidomics). These methods can provide the source data for systems biology/medicine investigations into the complex network of interactions that reflect both their functional and dysfunctional states, as well as reflect nutritional and environmental impacts. There is now an accepted principle in scientific research that data should be made openly and easily accessible to allow groups other than the initial data generators to verify the findings or search for new interpretations. Such guidelines are now commonly referred to as the “FAIR” principles, data being findable, accessible, interoperable, and reusable.1 Furthermore, data from omics experiments are typically expensive to generate and often have potential uses beyond their initial purpose, including in meta-analyses, in data integration, or for testing and assisting in the development of new software. In omics research, there is always some heterogeneity in the approaches taken in different laboratories, such as different instrument platforms or analysis software, which usually have their own file formats. To allow data sets to be open for reuse generally requires the formulation of nonproprietary data formats, or more ideally, agreed data standards to which different producers of data must adhere. Without agreed standards (or ubiquitous formats originating from one package), data reuse is highly challenging, since informatics groups would need to write file format converters for every possible source of data, as well as keep these converters updated whenever data-producing software makes a format change. This scenario makes development of analysis software or a specific usage of public databases very challenging.
In a typical MS-based metabolomics/lipidomics pipeline, samples are analyzed by liquid or gas chromatography, coupled to MS (LC-MS/GC-MS), or by direct infusion (DIMS). Measurement of molecular intensity is typically done via software that detects features formed from isotopic patterns (or single peaks) along the time axis. For LC-MS, ionization can be performed in either positive or negative mode to produce protonated or deprotonated ions. It is also common for ion adducts to be formed, including metal adducts (Na+, K+), which have the same time elution profile but different m/z values. Many software packages perform adduct grouping, such that quantification values are reported both for individual features, as well as for the summed abundance across different adduct forms assumed to have come from the same starting molecule. For quantification across different samples, software may perform retention time alignment to ensure that the same features are quantified in each sample. In GC-MS, analysis is performed on volatile molecules and, in some cases, a derivatization step is applied to increase the volatility of compounds of interest.
Molecular identification remains challenging in metabolomics. Typically, some combination of the following steps can assist with identification via searching a pre-existing library or database: accurate neutral mass, the relative abundance of isotopomers, the retention time, masses of fragmentation products (MS/MS and MSn spectra), collisional cross section for platforms with ion mobility, etc. (see the reviews in refs (2−4) for more details). In the case of MS/MS and MSn fragmentation, the spectra can be compared against an in-house spectral library or databases storing reference spectra for molecules including Metlin,5 The Human Metabolome Database,6 Global Natural Products Social Molecular Networking7 (GNPS), MassBank,8 and others (see ref (9) for a review) or analyzed by in silico identification software.10
It is common in all approaches for many molecules to remain unannotated or for ambiguity to remain: i.e., software provides a list of possible molecules for each MS feature. Reporting standards and guidelines on these certainties have been developed in several communities.11,12 Following quantification (and identification), statistical analysis usually proceeds via univariate approaches, e.g. to find differentially expressed molecules between conditions, or multivariate/machine learning approaches to explore structure within the data and find molecules that can separate sample groups and thus act as potential biomarkers.
There exists a wide range of software, both free and commercial, for processing MS data for metabolomics/lipidomics.13,14 Most software produces output data in a unique file format, annotated to different levels of detail, often with the description of preprocessing procedures followed implicit rather than specified, making it highly challenging to compare or integrate the results of different pipelines. For public data sharing, there are several databases that host data sets in support of publications or community data sets, including the European Bioinformatics Institute (EMBL-EBI) MetaboLights database15 and the NIH Metabolomics Workbench.16
In this work, we describe a data standard for MS-based metabolomics analytical pipelines, called mzTab-M, which captures the downstream results of analysis (i.e., excluding raw data), suitable for statistical analysis, result visualization, or submission to a public repository in support of a publication. The standard has been developed in a joint and open process between members of the Metabolomics Standards Initiative (MSI),17 the Metabolomics Society Data Standards Task Group, and the Proteomics Standards Initiative (PSI), which had originally developed the mzTab format on which it is based.18 There are several related and complementary efforts, which include efforts to define minimum reporting requirements for different aspects of metabolomics.11,19 There is also general agreement among standards groups (MSI, Metabolomics Society) to promote the use of the PSI’s mzML format for raw data storage.20 mzML is an XML-based standard for MS data, either for profile data as recorded directly from the instrument or for centroided data (peak picked in the m/z domain). The freely available ProteoWizard software embeds software libraries from several vendors of MS instruments, enabling the conversion of vendor raw files into mzML.21 For NMR metabolomics, the recently released nmrML standard follows a design principle similar to that of mzML, capturing NMR spectra and some metadata within an XML-based standard.22 For the description of study design, experimental metadata, and sample processing parameters, the ISA framework,23 while generally applicable to all types of experimental design, has been particularly taken up by the metabolomics field. The PSI previously developed the mzTab format (version 1.0) to act as a simple format for quantified and/or identified peptides and proteins in MS workflows.18 mzTab version 1.0 also has a section to allow small-molecule data to be captured. However, the data model was rather simple and did not cover some important use cases for metabolomics/lipidomics and, as a result, it has not been extensively used for small molecules or lipids. The development of mzTab-M has thus branched off from the original mzTab format development, and we report it here as a new standard for metabolomics called mzTab-M (“version 2.0” to differentiate it from mzTab version 1.0). It follows design principles similar to those of mzTab 1.0, but it is not backward compatible.
Methods
The mzTab-M format was designed in a process that was open to any interested parties. All associated materials and code for processing and validating files are fully open source and are hosted on GitHub (https://github.com/HUPO-PSI/mzTab). mzTab-M started from the design of mzTab version 1.0 format but was further developed to support the specific needs of metabolomics (see the Supporting Information for more details on the relationship). The development took place via face-to-face workshops and regular conference calls. The specifications have been submitted to a formal document process for anonymous review, overseen by an editor commissioned jointly between the PSI and the Metabolomics Society. The mzTab-M format is defined by the specification document and example files that demonstrate how to encode certain features (see the GitHub repository). The specification document describes the overall structure of the format: what tables must be present, what columns and rows must be present in those tables, and what terminology is allowed as data values. For various aspects of metadata, the standard enforces (and can be checked by validation software) that controlled vocabulary (CV) terms are used (e.g. for names of software, databases, parameters, statistics, etc.), which can be sourced from the PSI-MS CV26 (https://www.ebi.ac.uk/ols/ontologies/ms), as well as other CVs where appropriate.
Results and Discussion
mzTab-M has been designed to act as a single data format for metabolomics and lipidomics, including an appropriate level of detail about the “final” results: i.e., molecules quantified across samples. The format also contains the ability to represent “intermediate” or supporting data, including the evidence trail for identifications from software (scores or statistics), as well as the quantification values derived directly from MS: i.e., prior to any adduct grouping or summarization steps. The format is represented as tab-separated text, meaning that it can be loaded directly into a spreadsheet editor or into statistical software such as R or SPSS for downstream analysis and visualization, without any need for coding, and can thus replace the use of tables (e.g., in pdf or Excel format) of supplementary data in support of publications. It is also relatively straightforward for informatics groups to develop software to add support for the standard to existing software.
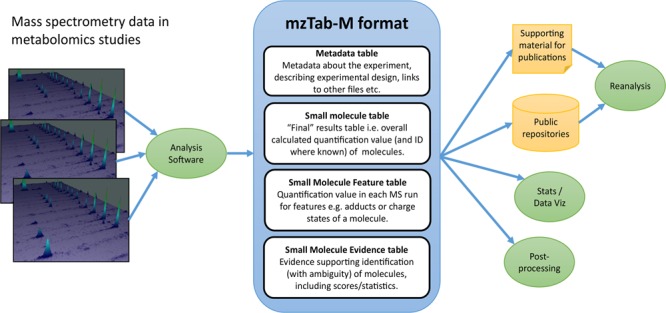
The mzTab-M format consists of four cross-referenced data tables (Figure 1): metadata (MTD), small molecule (SML), small molecule feature (SMF) and the small molecule evidence (SME). The MTD and SML tables are mandatory, and for a file to contain any evidence about how molecules were quantified or identified by software, all four tables must be present. The tables must follow the order MTD, SML, SMF, and SME, with a blank line separating each table. The structure of each table, in terms of the rows and columns that must be present, is tightly specified, as explained in the following sections and formally in the mzTab-M specification document.
Figure 1.

Overall structure of an mzTab-M file. (A) Metadata about the experiment, describing experimental design (study variables and assays), links to other files, etc.. (B) The small molecule (SML) table, capturing “final” results table: i.e., overall calculated quantification value (and identity where known) of a metabolite. (C) Quantification value in each (aligned) MS run for MS1 features: e.g., mapped to individual adducts or charge states of a molecule. (D) Evidence supporting identification (with ambiguity if needed) for molecules, using CV terms for scores/statistics where available.
Metadata (MTD) Table
The metadata table has multiple rows and exactly three columns (Figure 1A). Each row must contain (1) “MTD”, (2) a parameter name, and (3) the parameter value. The types of parameters that must or may be present are described in the specification document, and allowed values from CVs are defined in a mapping file. The MTD table must report at least a simple specification of the experimental design, in terms of the number of different measurements (i.e., usually the count of MS runs) and the groupings of those MS runs (i.e., experimental factors or groups) over which statistical analysis may be done. These values then inform the number of columns present in SML and SMF tables for which (relative or absolute) quantitative values are reported. The following concepts are specified in the MTD table so that they can be referenced and reused elsewhere in the file:
Assay: the application of a measurement about the sample (in this case through MS), producing values about small molecules or lipids. One assay is typically mapped to one ms_run element (see below), although the differentiation between assay and ms_run is present to provide a mechanism for grouping multiple MS runs together if the sample has been fractionated and different fractions run on the instrument to increase coverage. The MTD table gives the count of assays with locally unique identifiers, so that they can be referenced by other elements.
ms_run: an MS run is effectively one run on an MS instrument (e.g., by LC-MS, GC-MS, DIMS, etc.) and can be referenced from assay elements in different contexts. When an ISA-Tab document from mzTab-M is referenced, ms_run should be matched with the ISA “Assay Name” values found in an ISA “Assay Table” file (https://isa-specs.readthedocs.io/en/latest/isatab.html).
Sample: a biological material that has been analyzed, to which descriptors of species, cell/tissue type, etc. can be attached. Samples are not mandatory, since some software packages that will produce mzTab-M files cannot determine what type of sample was analyzed (e.g., whether biological or technical replication was performed), although it is noted that, without such annotations, downstream statistical analysis of the results will often not be possible.
study_variable: a “study_variable” (SV) element represents a grouping of replicates for which a quantitative value can be reported, for example following averaging of values from individual assays. More accurately, a “study_variable” element usually represents a level of some particular experimental variable, such as the value of time within a time course, dose of a drug, intervention performed on samples, etc. In other contexts, this concept is named differently: e.g., “Factor Value” in ISA format.
Clear definitions of biological and technical replicates are difficult to provide, as the commonly used terminologies are somewhat dependent upon the biological domain. However, we use the following general definitions in mzTab-M: biological replicates represent cases when different samples are analyzed by MS, and technical replicates represent cases where the same samples are analyzed multiple times by MS. As illustrated in Figure 2, a simple form of the experimental design can be captured in mzTab-M using a combination of assay, “study_variable”, and “sample”. In a complex, nested design, linkages between different study variables are not explicitly modeled but captured through the annotated values, as shown in the Supporting Information.
Figure 2.

Simple experimental designs in mzTab-M can be represented using a combination of the elements study_variable (SV), assay, ms_run, and sample. Quantitative values can be reported in files for SVs and assays. (A) SV is intended to capture different groups of replicates, which might have resulted from different levels of a given variable: e.g. control versus treated (represented as 2 SVs) and n time points over a treatment course (as n SVs). (B) assay captures a measurement made about a molecule (small molecule/lipid) where multiple assays within the same SV are taken to be replicates of some kind (biological or technical). (C) ms_run captures a single run on an MS instrument. (D) Samples are optional in mzTab, since the quantitative software may often be unaware of the biological samples that have been analyzed. If that information is available, references from assay to the same (technical, upper half) or different (biological, bottom half) samples are used to describe the type of replication performed.
The MTD table also has the (optional) capability to capture additional metadata that can be useful to interpret the study, such as limited details about the sample processing steps performed, the MS instrument, software and parameters, contact details for the study producers, etc. However, it is acknowledged that other formats may capture such details, such as referenced mzML (including instrument information and parameters), other MS data file formats, or ISA-Tab files (containing experimental design and sample processing), which may be more appropriate locations for such information.
Small Molecule (SML) Table
The small molecule (SML) table (Figure 1B) is intended to capture the “final” results of the study in terms of molecules that have been quantified (with identification data, where available). If different adduct forms or fragments of a molecule have been observed as different MS features, it is common that feature grouping is performed, and the SML table should contain the final quantitative values after summarization. Thus, SML could be viewed as the equivalent of tabular results presented in a paper for the molecules quantified in different samples. For survey-type data, it is also possible to report quantities as “null”, while still reporting identification evidence, as supported by the SME table.
The header row has “SMH” in the first column, followed by an ordered set of column headers. After the header row, each row reports one molecule, with the first cell containing “SML”, followed by the data values for each specified column. The columns include a unique local identifier for the molecule (SML_ID), followed by a cell (SMF_ID_REFS) containing references to features in the SMF table. The referenced features are the different adduct forms or in-source fragments of the molecular features actually detected by MS. The next set of columns provides different ways to identify the molecule (database_identifer, chemical_formula, smiles, inchi, chemical_name, uri, theoretical_neutral_mass; see section Identification evidence and ambiguity below).
The following columns report quantitative data for the n assays (in n columns, where n is the count of assays reported in MTD) and the m study_variable groups (in m columns) e.g. as an average (e.g., mean) across assay values within that study_variable. A value can also be provided for the variability in the study_variable quantification value reported e.g. a standard error value. A parameter in MTD specifies how to interpret the quantitative values in these columns in terms of a data type exported from a specific piece of software or where appropriate, absolute values with units.
At the right-hand end of the SML table (and SMF and SME tables), it is possible to include user-specified (optional) columns, with a method for annotating that the columns refer to the entire molecule, or the measurement of the molecule in particular assays or study_variables. The user-specified columns thus make mzTab-M extensible to support custom data types not covered in the core model.
Small Molecule Feature (SMF) Table
The SMF table contains data on what features were actually measured by the instrument and quantified by software (Figure 1C). The header row of the table has “SFH” in the first cell, followed by a set of columns. Each row of the table is one MS feature recorded across different runs, starting with the code “SMF”. It is assumed that an alignment process has taken place so that the same feature has been seen across different runs, with missing values handled as appropriate (see specification document for guidance on encoding nonaligned workflows). The next column (SME_ID_REFS) is for referencing down to the final table: Small Molecule Evidence (SME) via a set of identifier references, as well as a code telling the file reader how to interpret multiple references (SME_ID_REF_ambiguity_code), explained in Identification Evidence and Ambiguity.
The SMF table next contains information about the type of adduct and charge state observed, the experimental m/z value, the retention time of the feature (in a master or averaged run), and a method for optionally specifying if a given isotopomer has been quantified (+1 or +2 peak, 13C peak, etc.) as used in some isotopic labeling/flux studies. The following columns represent the quantitative data within each of the n assays recorded in the MTD section. For SML, a parameter in MTD also describes how to interpret the quantitative values recorded.
Small Molecule Evidence (SME) Table
The SME table represents strands of potentially heterogeneous types of evidence supporting the identification of a molecule (Figure 1D). Each row contains the result of one identification process (library search, pattern match, manual curation, etc.). The header of the table starts with “SEH” followed by a set of columns. The second column is a local identifier for a row of evidence (SME_ID), followed by a local identifier for the input data to the process (evidence_input_id). evidence_input_id is needed for the cases where different rows of evidence are reported for the same input data (MS2 spectrum, accurate mass + retention time, isotope pattern, etc.). They can be linked by sharing the same value for evidence_input_id. As in the SML table, a set of columns exists to specify the molecular identity from a variety of sources or identifier types (database_identifer, chemical_formula, smiles, inchi, chemical_name, uri). The experimental m/z value of the feature, the charge, and the theoretical m/z value (e.g., from a database) can be recorded, along with scores or confidence measures coming from the software used to support the identification. If a fragmentation spectrum has been used, there is a mechanism for referencing the exact spectrum in the source file (e.g., mzML file) and the MS level of the input data to the identification process.
Identification Evidence and Ambiguity
Small-molecule identification is a well-known challenge in MS metabolomics, and even more so in MS lipidomics, where complete structural elucidation of molecules is often not possible. Different levels of “identification” might be possible, ranging from having the accurate mass only, the chemical formula, a list of possible identifiers to molecules in a database (with the same or different formula), or a complete molecular structure resolved: e.g., if a complementary technique such as NMR has been used. mzTab-M has been designed to accommodate all the different possibilities in a simple yet flexible structure (Figure 3). For further details on how identifications of lipids and other compound classes can be represented see the Supporting Information.
Figure 3.

(A) The summary level (SML) reports the final assumed identifications, allowing for ambiguity by including “|” separated results in the relevant columns. (B) The feature level (SMF) does not explicitly report identifications but references down to the SME level. Ambiguity is propagated via referencing multiple SME rows with different identification results. (C) One SME row represents a single possible identification from some input evidence. Multiple identifications from the same input data share the same value for evidence_input_id. Ambiguity can be captured by different rows for the same input data.
In a row of the final results (SML table), the export software can include one or more identifiers from external databases: e.g., “CHEBI:16811” where the prefix is defined in MTD as referencing the ChEBI database24 (with a URL) and the identifier is the ChEBI unique identifier (in this case for methionine). Similarly, the specification allows for the chemical formula in standard notation, simplified molecular-input line-entry system (SMILES25), or InChi26 to be provided. In all cases, if ambiguity has not been resolved, then a Pipe “|” separated list of identifiers can be provided in the same cell. There are several measures for describing the confidence of identification, including the use of reliability codes such as those developed by the MSI11,12 and the score or confidence measures from identification software where available.
To trace the evidence source, references via the features (SMF table) and on to the SME table should be provided. In the case that adduct grouping (i.e., multiple SMF rows) has been performed prior to identification, then the different SMF rows will reference the same SME rows. At the SME level, if there are different rows from the same input data (e.g., different database matches), then it is expected that the SMF element(s) references multiple SME elements that share the same value for evidence_input_id. It is also possible to report different evidence streams to support identification, such as searches in different libraries. As such, SMF rows can reference multiple SME elements carrying different values of evidence_input_id. Given that these two cases would both result in multiple SME identifiers referenced from an SMF row, an extra code can be provided at the SMF level (SME_ID_REF_ambiguity_code) containing values to differentiate whether ambiguity has been resolved or still remains (see the specification document for a full description).
Using CVs and File Validation
mzTab-M extensively uses CVs to provide unambiguous terms for annotation. For parameters relating to MS and associated processing, CV terms should generally be sourced from the PSI MS CV.27 Several other CVs are recommended for describing details about sample types, species taxonomy, sample preparation, etc. (see the specification document). To ensure that valid CV terms are used, we have extended the concept of the PSI semantic validation framework.28 The framework includes a mapping file that states the groups of CV terms allowed at each position in mzTab-M, enabling the list of terms to expand over time, without changes in the standard or software. New terms can be added straightforwardly by making a request on a mailing list: e.g., for a term describing new software, scores, or statistics. A crucial part of the standard is therefore a validator to ensure that files exported from different packages fulfill the rules defined in the specification, so that they can be read without error by other software. We have developed validation software for mzTab-M, available from jmzTab (project: https://github.com/lifs-tools/jmzTab-m), which checks not only that the structure of the file is correct but also that valid and correct CV terms have been used throughout.
Implementation in Software and Databases
The specifications have been verified by both PSI and MSI formal review processes, from which the stable version (mzTab-M 2.0) has been released. It is not expected that there will be changes to the format for several years to allow implementations to be developed. A reference implementation with parser, writer, and validator (in jmzTab-m) has been developed in Java (as for mzTab 1.029). jmzTab-m provides an OpenAPI 2.0 compatible API model that serves as the basis for automatic model generation in a wide number of programming languages (C++, JavaScript, R, Python), reducing the burden of implementation. The library provides parsing, validation, and writing of mzTab-M files and object models. A web-based application (https://apps.lifs.isas.de/mztabvalidator/) provides a user-friendly user interface to perform standard and semantic validation and to display validation results. Additional implementations are under development in software including XCMS,30 Progenesis QI (Waters), Lipid Data Analyzer,31 OpenMS,32 and MetaboLights.15 Over the coming years, we will be promoting the implementation of the standard in a wide variety of both open-source and commercial software to act as a universal standard for metabolomics and lipidomics.
Conclusions
We have developed mzTab-M for metabolomics data representation and sharing. The standard has been developed in an open process with widespread consultation of different approaches taken in the field and involvement of software teams from academic research groups as well as industry. The standard has undergone a rigorous peer review process by both the MSI and PSI to ensure that the resulting standard is of high quality and is stable. The standard is expected to remain stable for several years, except for improvements to documentation and extensions to the CV, allowing research groups and commercial developers to invest time in the implementation. We also encourage other groups interested in standardizing omics data, particularly those using MS (e.g. glycomics), to adopt the mzTab model/design, CV infrastructure, and associated software.
Acknowledgments
N.H. acknowledges funding by the Ministerium für Kultur und Wissenschaft des Landes Nordrhein-Westfalen, the Regierende Bürgermeister von Berlin-inkl. Wissenschaft und Forschung, and the Bundesministerium für Bildung und Forschung (de.NBI/BMBF 031L0108A). S.N. acknowledges funding by the Bundesministerium für Bildung und Forschung (de.NBI/BMBF 031L0107). S.N., P.R.-S., K.H., and R.M.S. acknowledge funding from PhenoMeNal (H2020-EU.1.4.1.3 grant no. 654241). A.R.J. acknowledges funding from the BBSRC (BB/M020282/1, BB/L024128/1, BB/K01997X/1). J.T.M.P. was supported by the Medical Research Council and National Institute for Health Research UK through funding for the Imperial College MRC-NIHR Phenome Centre, MRC grant number MC-PC-12025. T.S. and O.A. acknowledge funding from de.NBI/BMBF (031A535A) GM from de.NBI/BMBF (031A534A). J.A.V. acknowledges funding from the BBSRC (BB/K01997X/1) and NIH (R24 GM127667-01. M.E.’s funding is related to PURE (Protein research Unit Ruhr within Europe), a project of Northrhine-Westphalia, a federal state of Germany.
Supporting Information Available
Supplementary File 1. The Supporting Information is available free of charge on the ACS Publications website at DOI: 10.1021/acs.analchem.8b04310.
Additional details on the relationship between mzTab-M and mzTab 1.0, on how lipid identifications can be reported in mzTab-M, and on the representation of complex experimental designs in mzTab-M (PDF)
The authors declare no competing financial interest.
Supplementary Material
References
- Wilkinson M. D.; Dumontier M.; Aalbersberg I. J.; Appleton G.; Axton M.; Baak A.; Blomberg N.; Boiten J.-W.; da Silva Santos L. B.; Bourne P. E.; Bouwman J.; Brookes A. J.; Clark T.; Crosas M.; Dillo I.; Dumon O.; Edmunds S.; Evelo C. T.; Finkers R.; Gonzalez-Beltran A.; Gray A. J. G.; Groth P.; Goble C.; Grethe J. S.; Heringa J.; ’t Hoen P. A. C.; Hooft R.; Kuhn T.; Kok R.; Kok J.; Lusher S. J.; Martone M. E.; Mons A.; Packer A. L.; Persson B.; Rocca-Serra P.; Roos M.; van Schaik R.; Sansone S.-A.; Schultes E.; Sengstag T.; Slater T.; Strawn G.; Swertz M. A.; Thompson M.; van der Lei J.; van Mulligen E.; Velterop J.; Waagmeester A.; Wittenburg P.; Wolstencroft K.; Zhao J.; Mons B. Sci. Data 2016, 3, 160018. 10.1038/sdata.2016.18. [DOI] [PMC free article] [PubMed] [Google Scholar]
- Holcapek M.; Liebisch G.; Ekroos K. Anal. Chem. 2018, 90, 4249–4257. 10.1021/acs.analchem.7b05395. [DOI] [PubMed] [Google Scholar]
- Blazenovic I.; Kind T.; Ji J.; Fiehn O. Metabolites 2018, 8, 31. 10.3390/metabo8020031. [DOI] [PMC free article] [PubMed] [Google Scholar]
- Bingol K.; Bruschweiler-Li L.; Li D.; Zhang B.; Xie M.; Bruschweiler R. Bioanalysis 2016, 8, 557–573. 10.4155/bio-2015-0004. [DOI] [PMC free article] [PubMed] [Google Scholar]
- Guijas C.; Montenegro-Burke J. R.; Domingo-Almenara X.; Palermo A.; Warth B.; Hermann G.; Koellensperger G.; Huan T.; Uritboonthai W.; Aisporna A. E.; Wolan D. W.; Spilker M. E.; Benton H. P.; Siuzdak G. Anal. Chem. 2018, 90, 3156–3164. 10.1021/acs.analchem.7b04424. [DOI] [PMC free article] [PubMed] [Google Scholar]
- Wishart D. S.; Knox C.; Guo A. C.; Eisner R.; Young N.; Gautam B.; Hau D. D.; Psychogios N.; Dong E.; Bouatra S.; Mandal R.; Sinelnikov I.; Xia J.; Jia L.; Cruz J. A.; Lim E.; Sobsey C. A.; Shrivastava S.; Huang P.; Liu P.; Fang L.; Peng J.; Fradette R.; Cheng D.; Tzur D.; Clements M.; Lewis A.; De Souza A.; Zuniga A.; Dawe M.; Xiong Y.; Clive D.; Greiner R.; Nazyrova A.; Shaykhutdinov R.; Li L.; Vogel H. J.; Forsythe I. Nucleic Acids Res. 2009, 37, D603–610. 10.1093/nar/gkn810. [DOI] [PMC free article] [PubMed] [Google Scholar]
- Wang M.; Carver J. J.; Phelan V. V.; Sanchez L. M.; Garg N.; Peng Y.; Nguyen D. D.; Watrous J.; Kapono C. A.; Luzzatto-Knaan T.; Porto C.; Bouslimani A.; Melnik A. V.; Meehan M. J.; Liu W. T.; Crusemann M.; Boudreau P. D.; Esquenazi E.; Sandoval-Calderon M.; Kersten R. D.; Pace L. A.; Quinn R. A.; Duncan K. R.; Hsu C. C.; Floros D. J.; Gavilan R. G.; Kleigrewe K.; Northen T.; Dutton R. J.; Parrot D.; Carlson E. E.; Aigle B.; Michelsen C. F.; Jelsbak L.; Sohlenkamp C.; Pevzner P.; Edlund A.; McLean J.; Piel J.; Murphy B. T.; Gerwick L.; Liaw C. C.; Yang Y. L.; Humpf H. U.; Maansson M.; Keyzers R. A.; Sims A. C.; Johnson A. R.; Sidebottom A. M.; Sedio B. E.; Klitgaard A.; Larson C. B.; P C. A. B.; Torres-Mendoza D.; Gonzalez D. J.; Silva D. B.; Marques L. M.; Demarque D. P.; Pociute E.; O’Neill E. C.; Briand E.; Helfrich E. J. N.; Granatosky E. A.; Glukhov E.; Ryffel F.; Houson H.; Mohimani H.; Kharbush J. J.; Zeng Y.; Vorholt J. A.; Kurita K. L.; Charusanti P.; McPhail K. L.; Nielsen K. F.; Vuong L.; Elfeki M.; Traxler M. F.; Engene N.; Koyama N.; Vining O. B.; Baric R.; Silva R. R.; Mascuch S. J.; Tomasi S.; Jenkins S.; Macherla V.; Hoffman T.; Agarwal V.; Williams P. G.; Dai J.; Neupane R.; Gurr J.; Rodriguez A. M. C.; Lamsa A.; Zhang C.; Dorrestein K.; Duggan B. M.; Almaliti J.; Allard P. M.; Phapale P.; Nothias L. F.; Alexandrov T.; Litaudon M.; Wolfender J. L.; Kyle J. E.; Metz T. O.; Peryea T.; Nguyen D. T.; VanLeer D.; Shinn P.; Jadhav A.; Muller R.; Waters K. M.; Shi W.; Liu X.; Zhang L.; Knight R.; Jensen P. R.; Palsson B. O.; Pogliano K.; Linington R. G.; Gutierrez M.; Lopes N. P.; Gerwick W. H.; Moore B. S.; Dorrestein P. C.; Bandeira N. Nat. Biotechnol. 2016, 34, 828–837. 10.1038/nbt.3597. [DOI] [PMC free article] [PubMed] [Google Scholar]
- Horai H.; Arita M.; Kanaya S.; Nihei Y.; Ikeda T.; Suwa K.; Ojima Y.; Tanaka K.; Tanaka S.; Aoshima K.; Oda Y.; Kakazu Y.; Kusano M.; Tohge T.; Matsuda F.; Sawada Y.; Hirai M. Y.; Nakanishi H.; Ikeda K.; Akimoto N.; Maoka T.; Takahashi H.; Ara T.; Sakurai N.; Suzuki H.; Shibata D.; Neumann S.; Iida T.; Tanaka K.; Funatsu K.; Matsuura F.; Soga T.; Taguchi R.; Saito K.; Nishioka T. J. Mass Spectrom. 2010, 45, 703–714. 10.1002/jms.1777. [DOI] [PubMed] [Google Scholar]
- Vinaixa M.; Schymanski E. L.; Neumann S.; Navarro M.; Salek R. M.; Yanes O. TrAC, Trends Anal. Chem. 2016, 78, 23–35. 10.1016/j.trac.2015.09.005. [DOI] [Google Scholar]
- Nguyen D. H.; Nguyen C. H.; Mamitsuka H. Briefings Bioinf. 2018, bby066–bby067. 10.1093/bib/bby066. [DOI] [Google Scholar]
- Sumner L. W.; Amberg A.; Barrett D.; Beale M. H.; Beger R.; Daykin C. A.; Fan T. W. M.; Fiehn O.; Goodacre R.; Griffin J. L.; Hankemeier T.; Hardy N.; Harnly J.; Higashi R.; Kopka J.; Lane A. N.; Lindon J. C.; Marriott P.; Nicholls A. W.; Reily M. D.; Thaden J. J.; Viant M. R. Metabolomics 2007, 3, 211–221. 10.1007/s11306-007-0082-2. [DOI] [PMC free article] [PubMed] [Google Scholar]
- Schymanski E. L.; Jeon J.; Gulde R.; Fenner K.; Ruff M.; Singer H. P.; Hollender J. Environ. Sci. Technol. 2014, 48, 2097–2098. 10.1021/es5002105. [DOI] [PubMed] [Google Scholar]
- Misra B. B. Electrophoresis 2018, 39, 909–923. 10.1002/elps.201700441. [DOI] [PubMed] [Google Scholar]
- Spicer R.; Salek R. M.; Moreno P.; Cañueto D.; Steinbeck C. Metabolomics 2017, 13, 106. 10.1007/s11306-017-1242-7. [DOI] [PMC free article] [PubMed] [Google Scholar]
- Haug K.; Salek R. M.; Conesa P.; Hastings J.; de Matos P.; Rijnbeek M.; Mahendraker T.; Williams M.; Neumann S.; Rocca-Serra P.; Maguire E.; Gonzalez-Beltran A.; Sansone S. A.; Griffin J. L.; Steinbeck C. Nucleic Acids Res. 2013, 41, D781–786. 10.1093/nar/gks1004. [DOI] [PMC free article] [PubMed] [Google Scholar]
- Sud M.; Fahy E.; Cotter D.; Azam K.; Vadivelu I.; Burant C.; Edison A.; Fiehn O.; Higashi R.; Nair K. S.; Sumner S.; Subramaniam S. Nucleic Acids Res. 2016, 44, D463–D470. 10.1093/nar/gkv1042. [DOI] [PMC free article] [PubMed] [Google Scholar]
- Nat. Biotechnol. 2007, 25, 846–848. 10.1038/nbt0807-846b. [DOI] [PubMed] [Google Scholar]
- Griss J.; Jones A. R.; Sachsenberg T.; Walzer M.; Gatto L.; Hartler J.; Thallinger G. G.; Salek R. M.; Steinbeck C.; Neuhauser N.; Cox J.; Neumann S.; Fan J.; Reisinger F.; Xu Q. W.; Del Toro N.; Perez-Riverol Y.; Ghali F.; Bandeira N.; Xenarios I.; Kohlbacher O.; Vizcaino J. A.; Hermjakob H. Mol. Cell. Proteomics 2014, 13, 2765–2775. 10.1074/mcp.O113.036681. [DOI] [PMC free article] [PubMed] [Google Scholar]
- Goodacre R.; Broadhurst D.; Smilde A. K.; Kristal B. S.; Baker J. D.; Beger R.; Bessant C.; Connor S.; Capuani G.; Craig A.; Ebbels T.; Kell D. B.; Manetti C.; Newton J.; Paternostro G.; Somorjai R.; Sjöström M.; Trygg J.; Wulfert F. Metabolomics 2007, 3, 231–241. 10.1007/s11306-007-0081-3. [DOI] [Google Scholar]
- Martens L.; Chambers M.; Sturm M.; Kessner D.; Levander F.; Shofstahl J.; Tang W. H.; Römpp A.; Neumann S.; Pizarro A. D.; Montecchi-Palazzi L.; Tasman N.; Coleman M.; Reisinger F.; Souda P.; Hermjakob H.; Binz P.-A.; Deutsch E. W. Mol. Cell. Proteomics 2011, 10, R110.000133. 10.1074/mcp.R110.000133. [DOI] [PMC free article] [PubMed] [Google Scholar]
- Chambers M. C.; Maclean B.; Burke R.; Amodei D.; Ruderman D. L.; Neumann S.; Gatto L.; Fischer B.; Pratt B.; Egertson J.; Hoff K.; Kessner D.; Tasman N.; Shulman N.; Frewen B.; Baker T. A.; Brusniak M.-Y.; Paulse C.; Creasy D.; Flashner L.; Kani K.; Moulding C.; Seymour S. L.; Nuwaysir L. M.; Lefebvre B.; Kuhlmann F.; Roark J.; Rainer P.; Detlev S.; Hemenway T.; Huhmer A.; Langridge J.; Connolly B.; Chadick T.; Holly K.; Eckels J.; Deutsch E. W.; Moritz R. L.; Katz J. E.; Agus D. B.; MacCoss M.; Tabb D. L.; Mallick P. Nat. Biotechnol. 2012, 30, 918–920. 10.1038/nbt.2377. [DOI] [PMC free article] [PubMed] [Google Scholar]
- Schober D.; Jacob D.; Wilson M.; Cruz J. A.; Marcu A.; Grant J. R.; Moing A.; Deborde C.; de Figueiredo L. F.; Haug K.; Rocca-Serra P.; Easton J. M.; Ebbels T. M. D.; Hao J.; Ludwig C.; Gunther U. L.; Rosato A.; Klein M. S.; Lewis I.; Luchinat C.; Jones A. R.; Grauslys A.; Larralde M.; Yokochi M.; Kobayashi N.; Porzel A.; Griffin J.; Viant M. R.; Wishart D. S.; Steinbeck C.; Salek R. M.; Neumann S. Anal. Chem. 2018, 90, 649. 10.1021/acs.analchem.7b02795. [DOI] [PubMed] [Google Scholar]
- Sansone S.-A.; Rocca-Serra P.; Field D.; Maguire E.; Taylor C.; Hofmann O.; Fang H.; Neumann S.; Tong W.; Amaral-Zettler L.; Begley K.; Booth T.; Bougueleret L.; Burns G.; Chapman B.; Clark T.; Coleman L.-A.; Copeland J.; Das S.; de Daruvar A.; de Matos P.; Dix I.; Edmunds S.; Evelo C. T.; Forster M. J.; Gaudet P.; Gilbert J.; Goble C.; Griffin J. L.; Jacob D.; Kleinjans J.; Harland L.; Haug K.; Hermjakob H.; Sui S. J. H.; Laederach A.; Liang S.; Marshall S.; McGrath A.; Merrill E.; Reilly D.; Roux M.; Shamu C. E.; Shang C. A.; Steinbeck C.; Trefethen A.; Williams-Jones B.; Wolstencroft K.; Xenarios I.; Hide W. Nat. Genet. 2012, 44, 121. 10.1038/ng.1054. [DOI] [PMC free article] [PubMed] [Google Scholar]
- Hastings J.; Owen G.; Dekker A.; Ennis M.; Kale N.; Muthukrishnan V.; Turner S.; Swainston N.; Mendes P.; Steinbeck C. Nucleic Acids Res. 2016, 44, D1214–1219. 10.1093/nar/gkv1031. [DOI] [PMC free article] [PubMed] [Google Scholar]
- Weininger D. J. Chem. Inf. Model. 1988, 28, 31–36. 10.1021/ci00057a005. [DOI] [Google Scholar]
- Heller S.; McNaught A.; Stein S.; Tchekhovskoi D.; Pletnev I. J. Cheminf. 2013, 5, 7. 10.1186/1758-2946-5-7. [DOI] [PMC free article] [PubMed] [Google Scholar]
- Mayer G.; Montecchi-Palazzi L.; Ovelleiro D.; Jones A. R.; Binz P.-A.; Deutsch E. W.; Chambers M.; Kallhardt M.; Levander F.; Shofstahl J.; Orchard S.; Antonio Vizcaíno J.; Hermjakob H.; Stephan C.; Meyer H. E.; Eisenacher M. Database 2013, 2013, bat009. 10.1093/database/bat009. [DOI] [PMC free article] [PubMed] [Google Scholar]
- Montecchi-Palazzi L.; Kerrien S.; Reisinger F.; Aranda B.; Jones A. R.; Martens L.; Hermjakob H. Proteomics 2009, 9, 5112–5119. 10.1002/pmic.200900189. [DOI] [PubMed] [Google Scholar]
- Xu Q.-W.; Griss J.; Wang R.; Jones A. R.; Hermjakob H.; Vizcaíno J. A. Proteomics 2014, 14, 1328–1332. 10.1002/pmic.201300560. [DOI] [PMC free article] [PubMed] [Google Scholar]
- Smith C. A.; Want E. J.; O’Maille G.; Abagyan R.; Siuzdak G. Anal. Chem. 2006, 78, 779–787. 10.1021/ac051437y. [DOI] [PubMed] [Google Scholar]
- Hartler J.; Triebl A.; Ziegl A.; Trotzmuller M.; Rechberger G. N.; Zeleznik O. A.; Zierler K. A.; Torta F.; Cazenave-Gassiot A.; Wenk M. R.; Fauland A.; Wheelock C. E.; Armando A. M.; Quehenberger O.; Zhang Q.; Wakelam M. J. O.; Haemmerle G.; Spener F.; Kofeler H. C.; Thallinger G. G. Nat. Methods 2017, 14, 1171–1174. 10.1038/nmeth.4470. [DOI] [PMC free article] [PubMed] [Google Scholar]
- Rost H. L.; Sachsenberg T.; Aiche S.; Bielow C.; Weisser H.; Aicheler F.; Andreotti S.; Ehrlich H.-C.; Gutenbrunner P.; Kenar E.; Liang X.; Nahnsen S.; Nilse L.; Pfeuffer J.; Rosenberger G.; Rurik M.; Schmitt U.; Veit J.; Walzer M.; Wojnar D.; Wolski W. E.; Schilling O.; Choudhary J. S.; Malmstrom L.; Aebersold R.; Reinert K.; Kohlbacher O. Nat. Methods 2016, 13, 741–748. 10.1038/nmeth.3959. [DOI] [PubMed] [Google Scholar]
Associated Data
This section collects any data citations, data availability statements, or supplementary materials included in this article.