

Abstract
Aims:
To examine the relationship between food insecurity and emergency department (ED) visits, hospitalizations, A1c, and diabetes medication adherence over one year of follow-up among individuals > 65 years with diabetes mellitus.
Methods:
We conducted a longitudinal cohort study of adults > 65 years with diabetes who did (n=742) or did not (n=2,226) report food insecurity at baseline. We used conditional logistic regression for the ED visits or hospitalization outcomes, and mixed effects models for A1c and non-insulin diabetes medication adherence.
Results:
In bivariate analyses, individuals with food insecurity were more likely to have an ED visit (OR=1.40, 95% CI 1.15-1.72) or hospitalization (OR=1.41, 95% CI 1.11-1.78) in the year after the food security assessment. In addition, A1c was higher (7.5% vs. 7.2%, p<0.001). There was no difference in medication adherence. These differences persisted with adjustment for basic demographic and clinical characteristics, but were attenuated with further adjustment for socioeconomic status.
Conclusions:
Differences in diabetes outcomes by food insecurity status were attenuated by adjustment for socioeconomic status. Adverse outcomes in individuals with diabetes and food insecurity may be driven by effects of food insecurity per se or be mediated by a constellation of basic resource needs or lower socioeconomic status.
Keywords: diabetes mellitus, food insecurity, socioeconomic status, hemoglobin A1c, hospitalization, medication adherence
1. Introduction
Food insecurity is defined as a lack of access to adequate food because of limited money or other resources (1). In the United States, food insecurity is particularly prevalent among individuals with chronic conditions such as diabetes (1-3). Nationwide 19.5% of individuals with diabetes have food insecurity, compared to 11.5% of individuals without diabetes (2). In diabetes, food insecurity has been associated with a variety of poor diabetes outcomes, including higher hemoglobin A1c (2, 4-8), higher rates of hypoglycemia (9-13), decreased medication adherence (7, 9, 10, 14), and increased healthcare utilization (4, 15). Food insecurity can impede diabetes self-management through a variety of mechanisms: substitution of low-nutrient, high carbohydrate foods for healthy foods; skipping meals; inability to afford diabetes medications leading to poor medication adherence or use of less optimal medication regimens; and inability to afford diabetes supplies leading to decreased blood glucose testing (16).
Most studies of diabetes and food insecurity have been cross-sectional and were unable to examine the relationship between diabetes and future outcomes. The aim of this study was to examine the relationship between food insecurity and emergency department (ED) visits, inpatient hospitalizations, hemoglobin A1c, and diabetes medication adherence over one year of follow-up in a cohort of individuals aged 65 years and older with diabetes mellitus. To conduct this study, we used data from food security screening conducted at Kaiser Permanente Colorado (KPCO) in conjunction with the annual wellness visit for Medicare members.
2. Subjects, Materials and Methods
2.1. Study population
Kaiser Permanente Colorado (KPCO) is an integrated delivery system that provides health insurance and clinical services to approximately 650,000 individuals in the metropolitan Denver area, including approximately 110,000 members aged 65 and older. To meet CMS requirements for Medicare Advantage annual wellness visits, KPCO developed a Medicare Total Health Assessment (MTHA) tool, which has been offered to members annually since January 2012 (17, 18). The MTHA is delivered in a variety of formats (including online, telephone, and paper), and KPCO members aged 65 and older are asked to complete the MTHA annually. Data from the MTHA was combined with data from the KPCO Virtual Data Warehouse (VDW), which contains data from the electronic health record, claims, pharmacy, and laboratory results (19).
We limited our analyses to KPCO members aged 65 years and older with diabetes who completed at least one MTHA between 1/1/2012 and 6/30/2016. Diabetes was defined using diagnosis codes, medications, and lab results, as previously described (20, 21). Specifically, we defined the diabetes recognition date as the earlier of one inpatient diagnosis (ICD-9-CM 250.x, 357.2, 366.41, 362.01–362.07; ICD-10 E10, E11, either primary or secondary) or any combination of two of the following events, using the date of the first event in the pair as the identification date: 1) A1c ≥ 6.5%; 2) fasting plasma glucose ≥ 126 mg/dl; 3) random plasma glucose ≥ 200 mg/dl; 4) outpatient diagnosis code (same codes as for inpatient); 5) any anti-hyperglycemic medication dispensing. When the two events were from the same source (e.g. two outpatient diagnoses or two elevated laboratory values), we required them to occur on separate days no more than two years apart. Medication fills for metformin or thiazolidinediones with no other indication of diabetes were not included because these agents could be used for diabetes prevention or to treat polycystic ovarian syndrome.
We required that individuals have 365 days of enrollment prior to the index date, so that we could accurately define baseline covariates.
2.2. Assessment of food insecurity
Food insecurity was assessed using a single question: “Do you always have enough money to buy the food you need?” with a yes or no response option. This question was drawn from the Nutrition Health Screener of the Nutrition Screening Initiative, a validated instrument to assess nutrition in older adults (22). Individuals were considered to have food insecurity if they responded yes to the food insecurity screening question on one or more MTHAs. We used the date of the first MTHA where an individual reported food insecurity as the index date.
In order to account for secular trends by having similar MTHA dates for exposure and unexposed individuals, we identified up to 3 people who had completed an MTHA within 7 days of each exposed individual’s index date and had never reported having food insecurity. Sampling was done without replacement.
2.3. Baseline covariates
Baseline covariates included information from the VDW (demographics, body mass index (BMI), laboratory values, medications, diagnosis codes, insurance status, hospitalizations, and ED visits) and from the MTHA (tobacco and alcohol use, education, marital status and living situation, general health, and geriatric syndromes). For BMI and A1c, the closest measurement on or preceding the index date was used.
Hypertension was identified using hypertension diagnosis codes (ICD-9 401–405; ICD-10 I10-I13, I15), medication orders, and elevated blood pressures (>140/90). Individuals met the hypertension definition if one or more of the following criteria were met: 1) two visits with a hypertension diagnosis, on different days; 2) one visit with a hypertension diagnosis and one medication order; 3) one visit with a hypertension diagnosis and one elevated blood pressure; 4) two consecutive elevated blood. pressures, on different days (23). An individual was considered to have chronic kidney disease if the most recent estimated glomerular filtration rate (eGFR) was less than 60 mL/min/1.73m2 and at least two consecutive eGFRs at least 91 days apart were less than 60 mL/min/1.73m2. We used the CKD-EPI equation to calculate the estimate glomerular filtration rate, assuming White race if race was unknown (24). For the comorbidity measure, we used the Quan-Elixhauser comorbidity index, excluding diabetes (25). For lab values (A1c, serum creatinine) we used the most recent result in the previous 365 days. Medication intensity was defined using any medication fills within the 180 days prior to the index date, and was categorized as: no diabetes medications, non-insulin medications without insulin, insulin without non-insulin medications, and insulin and non-insulin medications
Socioeconomic status was measured using four variables. Educational attainment, marital status, and living situation were all measured using self-report. Medicaid enrollment, a proxy for annual household income, was assessed using insurance coverage information in the VDW.
Geriatric syndromes included: depression; a fall in the last 12 months; problems with balance or walking; problems with teeth or mouth; urinary incontinence; problems with memory, attention, or thinking; health conditions that interfere with daily activities; and not having someone to call for help. Depression was defined using the PHQ2, with a score of 3 or more considered a positive depression screen (26). We also included a count of the number of activities of daily living (ADL) dependencies or instrumental ADL (IADL) impairments (bathing, dressing, toileting, transferring, eating, taking medications, managing money, and performing household activities) (27, 28).
Adherence was assessed using the proportion of days covered (PDC) for all non-insulin diabetes medications. PDC for a given medication is the number of days enrolled and covered by fills of the medication divided by the number of days enrolled from medication start to the earlier of medication end or end of follow-up. The weight for each medication is the total days enrolled while on the medication divided by the total days enrolled while on any non-insulin diabetes medication. The overall PDC was calculated as the weighted average of the medication-specific PDCs (29).
We also identified hyperglycemia or hypoglycemia related ED visits and hospitalizations in the previous year using primary diagnosis codes. Hyperglycemia related ED visits and hospitalizations were defined as primary diagnosis code of ICD-9: 250.02, 250.03, 250.1, 250.2, 250.3; ICD-10 E08.0x, E08.1x, E08.65, E09.0x, E09.1x, E09.65, E10.0x, E10.1x, E10.65, E11.0x, E11.1x, E11.65, E13.0x, E13.1x, E13.65. Hypoglycemia related ED visits and hospitalizations were defined as ICD-9 primary diagnosis codes of 251.0, 251.1, 251.2, 962.3, as well as primary diagnosis codes of 250.8 but without any of the following codes: 259.8, 272.7, 681.xx, 682.xx, 686.9x, 707.xx, 709.3, 730.0–730.2, and 731.8 (30). Hypoglycemia was also defined using the following ICD-10 primary diagnosis codes: E08.64x. E09.64x, E10.64x, E11.64x, E13.64x, E15, E16.0-E16.2, T38.3X.
2.4. Outcomes
Outcomes were assessed in the 365 days after the index date. We assessed: 1) any ED visit in the 365-day follow-up period, 2) any hospitalization in the same time period, 3) A1c closest and prior to 365 days after the index date, and 4) adherence as assessed by the weighted PDC for non-insulin diabetes medications. Individuals who did not have a full 365 days of follow-up (due to death or disenrollment from the health system) were included in the analysis using information up until the date of death or disenrollment.
2.5. Statistical analysis
Baseline characteristics were compared between those with and without food insecurity using t-test for continuous variables and chi-square test for categorical variables, adjusting for the matched sets of exposed and unexposed individuals (matched based on completion date of the MTHA).
Multivariable models were developed to examine the association between food insecurity and outcomes. Groups of covariates were added sequentially: Model 1: basic demographics; Model 2: clinical characteristics; Model 3: socioeconomic status; Model 4: health status; Model 5: baseline utilization, A1c, and adherence. To account for the matched sets of exposures and controls, we used generalized linear mixed models with matching ID as random effects.
Missing data ranged from 1.1 % to 3.4%, with the exception of alcohol use (15.4%), BMI (12.8%) and A1c (7.1%). To account for missing responses, we used a fully conditional specification (FCS) multiple imputation procedure based on the fraction and pattern of missing data, since variables were continuous/binary/categorical and missing patterns were arbitrary (31). We imputed 5 datasets using SAS PROC MI, ran multivariable models on each dataset, and combined parameter estimates to obtain adjusted effects of food insecurity (odds ratio or mean difference) for the final model.
All analyses were conducted using SAS version 9.4 (SAS Institute Inc., Cary, NC). This study was approved by the KPCO Institutional Review Board, with a waiver of informed consent.
3. Results
Figure 1 shows the construction of the cohort. Before requiring a period of prior enrollment, there were 1,020 individuals with food insecurity, and 11,619 individuals without food insecurity, for a prevalence of food insecurity of 8.1% (1,020/12,639). After requiring a period of prior enrollment, there were 742 individuals with food insecurity, with a prevalence of food insecurity of 7.4% (742/10,052). All 742 individuals with food insecurity were successfully matched to three individuals without food insecurity.
Figure 1. Study cohort.
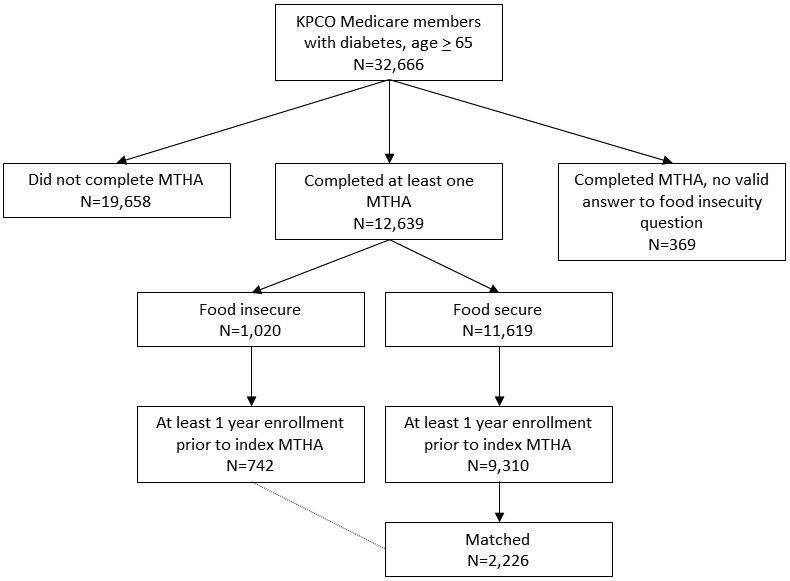
KPCO = Kaiser Permanente Colorado; MTHA = Medicare Total Health Assessment
As shown in Table 1, individuals with and without food insecurity differed in many important characteristics. Individuals with food insecurity were more likely to be female and a member of a racial or ethnic minority. They had a higher BMI, were more likely to be current smokers, and had more comorbidities. The prevalence of hypertension and chronic kidney disease was high, and did not differ between the groups. Individuals with food insecurity were more likely to be taking diabetes medication than individuals without food insecurity (70.5% vs. 63.6%) and were more likely to be taking insulin (25.4% vs. 19.4%). Individuals with food insecurity were more likely to have a lower level of education, to be single, and to have dual Medicaid/Medicare coverage. Individuals with food insecurity reported a lower level of general health and quality of life, a higher prevalence of geriatric conditions such as problems with balance or walking, and were less likely to have somebody they could call if they needed assistance. Individuals with food insecurity were more likely to have an ED visit in the year prior to the index date, with a non-statistically significant trend towards being more likely to have a hospitalization in the prior year. Individuals with food insecurity had a higher A1c at baseline, with almost double the prevalence of A1c ≥ 9% (75 mmol/mol) compared to those without food insecurity (12.0% vs 6.3%). Adherence could only be calculated on the 1,706 (57.4%) individuals on non-insulin diabetes medications, and did not differ by food insecurity status. While there was more missing data for MTHA’s completed by those with food insecurity than for those without food insecurity, overall the level of missing data was low (Supplemental Table S1).
Table 1.
Baseline characteristics by food insecurity status among adults aged 65 years and older with diabetes, Kaiser Permanente Colorado, 2012-2016
| Food insecure (N= 742) |
Food secure (N= 2,226) |
P value | |
|---|---|---|---|
| Demographics | |||
| Age, years, mean (SD) | 73.2 (6.1) | 73.9 (6.8) | 0.01 |
| Female gender, n (%) | 450 (60.6%) | 1,041 (46.8%) | <0.001 |
| Race, n (%) | |||
| Black | 67 (9.0%) | 88 (4.0%) | <0.001 |
| Hispanic | 174 (23.5%) | 278 (12.5%) | |
| Non-Hispanic White | 454 (61.2%) | 1,705 (76.6%) | |
| Other | 32 (4.3%) | 120 (5.4%) | |
| Unknown | 15 (2.0%) | 35 (1.6%) | |
| Clinical characteristics | |||
| BMI, kg/m2, mean, SD | 31.4 (6.9) | 30.2 (5.8) | <0.001 |
| Tobacco use, n (%) | |||
| Current | 84 (11.6%) | 151 (6.8%) | <0.001 |
| Former | 326 (44.9%) | 1,080 (48.9%) | |
| Never | 316 (43.5%) | 978 (44.3%) | |
| Alcohol, n (%) | |||
| Heavy use | 8 (1.4%) | 50 (2.6%) | <0.001 |
| Moderate use | 135 (23.2%) | 690 (35.8%) | |
| Never/rarely | 439 (75.4%) | 1,187 (61.6%) | |
| Hypertension, n (%) | 670 (90.3%) | 1,994 (89.6%) | 0.57 |
| Chronic kidney disease, n (%) | 219 (29.5%) | 697 (31.3%) | 0.36 |
| Quan-Elixhauser comorbidity index, mean (SD) | 2.2 (2.1) | 1.9 (1.9) | <0.001 |
| Diabetes medications, n (%) | |||
| Insulin + oral | 117 (15.8%) | 245 (11.0%) | |
| Insulin alone | 71 (9.6%) | 188 (8.4%) | <0.001 |
| Oral | 335 (45.1%) | 983 (44.2%) | |
| None | 219 (29.5%) | 810 (36.4%) | |
| Socioeconomic characteristics | |||
| Education, n (%) | |||
| Less than high school | 148 (21.2%) | 195 (9.0%) | <0.001 |
| High school | 205 (29.4%) | 583 (26.9%) | |
| Some college / college graduate | 271 (38.9%) | 993 (45.8%) | |
| Beyond college | 73 (10.5%) | 399 (18.4%) | |
| Marital status – single, n (%) | 346 (49.6%) | 723 (33.0%) | <0.001 |
| Living situation, n (%) | 0.36 | ||
| Retirement/assisted living facility | 13 (1.8%) | 36 (1.6%) | |
| With relative/friend | 95 (13.2%) | 356 (16.3%) | |
| Other | 72 (10.0%) | 225 (10.3%) | |
| Independent | 537 (74.9%) | 1,573 (71.8%) | |
| Medicaid, n (%) | 122 (16.4%) | 71 (3.2%) | <0.001 |
| General health/geriatric conditions | |||
| General health, n (%) | |||
| Fair/poor | 209 (29.2%) | 367 (16.7%) | <0.001 |
| Good | 333 (46.5%) | 1,024 (46.7%) | |
| Very good/excellent | 174 (24.3%) | 802 (36.6%) | |
| Quality of life, n (%) | |||
| Fair/poor | 167 (23.6%) | 231 (10.5%) | <0.001 |
| Good | 303 (42.9%) | 777 (35.4%) | |
| Very good/excellent | 237 (33.5%) | 1,188 (54.1%) | |
| Depression, n (%) | 181 (24.8%) | 199 (9.1%) | <0.001 |
| Fall in the last 12 months, n (%) | 238 (32.5%) | 544 (24.7%) | <0.001 |
| Problems with balance or walking, n (%) | 371 (50.8%) | 877 (39.8%) | <0.001 |
| Problems with teeth or mouth, n (%) | 181 (25.0%)) | 251 (11.4%) | <0.001 |
| Urinary incontinence, n (%) | 371 (50.8%) | 899 (40.9%) | <0.001 |
| Problems with memory, attention, or thinking, n (%) | 178 (24.5%) | 345 (15.8%) | <0.001 |
| Health conditions interfere with daily activities, n (%) | 385 (54.3%) | 823 (37.7%) | <0.001 |
| Have someone to call for help | 668 (94.0%) | 2,133 (98.4%) | <0.001 |
| Number of ADL or IADL difficulties, mean (SD) | 0.88 (1.4) | 0.45 (1.0) | <0.001 |
| Utilization | |||
| Any ED in the 1 year prior to index date, n (%) | 141 (19.0%) | 310 (13.9%) | <0.001 |
| Any hospitalization in the 1 year prior to index date, n (%) | 64 (8.6%) | 155 (7.0%) | 0.13 |
| Hemoglobin A1c | |||
| A1c at baseline, n (%) | |||
| ≥ 9% | 83 (12.0%) | 130 (6.3%) | <0.001 |
| 8 to 9% | 86 (12.5%) | 205 (9.9%) | |
| 7 to 8% | 208 (30.1%) | 610 (29.5%) | |
| 6 to 7% | 275 (39.9%) | 983 (47.6%) | |
| 6% | 38 (5.5%) | 138 (6.7%) | |
| A1c at baseline, %, mean (SD) | 7.4 (1.4) | 7.1 (1.1) | <0.001 |
| Adherence | |||
| N | 460 | 1246 | |
| Adherence to oral DM meds at baseline (PDC), n (%) | 0.54 | ||
| 60% | 198 (43.0%) | 516 (41.4%) | |
| 60-80% | 150 (32.6%) | 391 (31.4%) | |
| > 80% | 112 (24.3%) | 339 (27.2%) | |
| Adherence to oral DM meds at baseline, PDC, mean (SD) | 61.1 (23.1) | 62.2 (23.6) | 0.37 |
ADL = activity of daily living; DM = diabetes mellitus; ED = emergency department; HS = high school; IADL = instrumental activity of daily living; NH = non-Hispanic; PDC = proportion of days covered. To convert A1c % to mmol/mol: mmol/mol = (10.93* A1c %) – 23.50. For BMI and A1c, the closest measurement on or preceding the index date was used.
ED visits and hospitalizations for hyperglycemia and hypoglycemia were rare, but more common among those with food insecurity. In the one-year prior to the index date, there were 3 individuals with an ED visit or hospitalization for hyperglycemia (1 among those with food insecurity) and 14 individuals with an ED visit or hospitalization for hypoglycemia (6 among those with food insecurity). The differences between those with and without food insecurity were not statistically significant.
Loss to follow-up over the year follow-up period was low and similar among those with and without food insecurity. Among the 742 individuals with food insecurity, there were 20 (2.7%) deaths and 23 (3.1%) disenrollments in the year following the index date. Among the 2226 individuals without food insecurity, there were 50 (2.3%) deaths and 58 (2.6%) disenrollments.
In bivariate analyses, in the one year following baseline, individuals with food insecurity were more likely to have an ED visit (23.9% vs. 18.2%, p<0.001) or hospitalization (16.0% vs. 11.9%, p=0.005) than those without food insecurity (Table 2). Individuals with food insecurity had a higher A1c (7.5% [58 mmol/mol] vs. 7.2% [55 mmol/mol], p=<0.001). There was no difference in adherence to non-insulin diabetes medications, as assessed by the proportion of days covered.
Table 2.
Outcomes in the one year after baseline by food insecurity status, n=2,968.
| Food insecure (N= 742) |
Food secure (N= 2,226) |
P value | |
|---|---|---|---|
| ED visit, n (%) | 177 (23.9%) | 406 (18.2%) | <0.001 |
| Hospitalization, n (%) | 119 (16.0%) | 266 (11.9%) | 0.005 |
| A1c, mean (SD) | 7.5 (1.4) | 7.2 (1.2) | <0.001 |
| Adherence to non-insulin diabetes medications, mean (SD) | 59.4 (22.3) | 61.0 (24.1) | 0.23 |
ED = emergency department. Adherence is measured by the weighted proportion of days covered for all non-insulin diabetes medications. To convert A1c % to mmol/mol: mmol/mol = (10.93* A1c %) – 23.50.
Table 3 and Supplemental Tables S2-S5 show the sequential adjusted models for ED visits, hospitalizations, A1c, and adherence after one year of follow-up. Crude odds ratios for ED visits were statistically significant. Adjustment for basic demographics and clinical characteristics somewhat attenuated the relationships, while the addition of socioeconomic variables further attenuated the odds ratios such that they were no longer statistically significant. A similar pattern was seen for hospitalizations.
Table 3.
Adjusted odds ratios (95% confidence interval) and linear differences (95% confidence interval) by food insecurity status, N=2,968
| ED visit Odds ratio (95% CI) |
Hospitalization Odds ratio (95% CI) |
A1c Linear difference (95% CI) |
Adherence Linear difference (95% CI) |
|
|---|---|---|---|---|
| Crude | 1.40 (1.15, 1.72) | 1.41 (1.11, 1.78) | 0.27 (0.16, 0.37) | −1.54 (−4.05, 0.98) |
| Model 1: Basic demographics | 1.43 (1.17, 1.76) | 1.50 (1.18, 1.91) | 0.23 (0.12, 0.33) | −1.00 (−3.57, 1.56) |
| Model 2: Clinical characteristics | 1.30 (1.05, 1.61) | 1.38 (1.07, 1.77) | 0.15 (0.05, 0.25) | −0.71 (−3.29, 1.87) |
| Model 3: Socioeconomic status | 1.16 (0.93, 1.45) | 1.22 (0.94, 1.60) | 0.15 (0.05, 0.25) | −0.83 (−3.51, 1.84) |
| Model 4: general health and geriatric conditions | 1.10 (0.87, 1.38) | 1.15 (0.87, 1.51) | 0.17 (0.06, 0.27) | −0.49 (−3.22, 2.24) |
| Model 5: Baseline utilization, A1c, adherence | 1.07 (0.85, 1.35) | 1.14 (0.86, 1.50) | 0.07 (−0.02, 0.16) | −0.38 (−3.08, 2.31) |
Model 1 contains age, gender, and race. Model 2 additionally contains BMI, tobacco use, alcohol use, hypertension, chronic kidney disease, Quan score, and diabetes treatment intensity. Model 3 additionally contains education, marital status, living situation, and Medicaid enrollment. Model 4 additionally contains health status, depression, geriatric syndromes (problems with falls, problems with balance/walking, problems with hearing, dental problems, urinary incontinence, difficulties with memory or attention, health conditions interfering with daily life), social isolation, ADLs/IADLs. Model 5 additionally contains baseline ED visits, baseline hospitalizations, baseline A1c, and baseline adherence.
ADL = activity of daily living; CI = confidence interval; ED = emergency department. IADL = instrumental activity of daily living. Adherence is measured by the weighted proportion of days covered for all non-insulin diabetes medications. To convert A1c % to mmol/mol: mmol/mol = (10.93* A1c %) – 23.50.
The crude difference in A1c between those with and without food insecurity was 0.27% (95% CI 0.16, 0.37) [3.0 mmol/mol (95% CI 1.7, 4.0)]. Addition of basic demographics, clinical characteristics, socioeconomic status, and geriatric syndromes attenuated the relationship. After addition of baseline utilization, A1c, and adherence, the relationship was no longer statistically significant.
In the one-year follow-up period, there were 11 individuals with an ED visit or hospitalization for hyperglycemia (6 among those with food insecurity) and 19 individuals with an ED visit or hospitalization for hypoglycemia (9 among those with food insecurity). These differences between individuals with and without food insecurity were statistically significant during the follow-up period, but must be interpreted with caution since the small numbers precluded any multivariable modeling.
4. Discussion
In this population of adults aged 65 years and older with diabetes, 8.1% reported food insecurity during a 4.5-year period. Older adults with diabetes with and without food insecurity differed on important clinical and socioeconomic characteristics, generally reflecting poorer health status among those with food insecurity. In the one-year follow-up period, individuals with diabetes and food insecurity were more likely to visit the ED or be hospitalized and have a higher A1c compared to those without food insecurity. These differences persisted after adjusting for basic demographic and clinical characteristics, but were eliminated after further adjustment for socioeconomic status.
Food insecurity is highly prevalent among individuals with diabetes. For example, NHANES data from 2005–2012 found age-standardized rates of food insecurity of 19.5% in individuals with diabetes compared to 11.5% in those without diabetes. Furthermore, rates of food insecurity have increased over that period (2). Patients with diabetes in KPCO had higher rates of food insecurity than the general population of older adults in KPCO (32), but these rates were lower than NHANES estimates. Individuals for whom the health system has no information about food insecurity may differ from those for whom there is information about food insecurity, although previous work adjusting for participant non-response did not meaningfully change our estimate of the prevalence of food insecurity (32).
Multiple cross-sectional studies have found higher A1c’s or lower rates of glycemic control among individuals with diabetes and food insecurity (2, 4-7), although this has not been entirely consistent (9). Food insecurity has also been associated with prior increased healthcare utilization, although this has varied based on the type of utilization (4, 15), and lower medication adherence (7, 9, 10, 14). In addition, food insecurity in diabetes has been associated with prior self-reported severe hypoglycemic episodes (9-11). An interesting line of analyses has shown higher rates of healthcare encounters among individuals with diabetes at the end of the month, an association that was limited to low-income individuals (12, 13). The authors hypothesized that a monthly “pay cycle” results in individuals with food insecurity exhausting their food budgets at the end of each month. However, longitudinal studies of food insecurity and diabetes outcomes are limited. In one longitudinal study with mean of 3 years of follow-up, Berkowitz et al found that food insecurity was associated with higher A1c (8).
Controlled interventions to address food insecurity in the setting of diabetes are difficult to conduct due to ethical issues in having a control group. A six-month food pantry-based intervention that included diabetes-appropriate food, blood sugar monitoring, primary care referral, and self-management assistance resulted in improvements in glycemic control, fruit and vegetable intake, self-efficacy, and medication adherence (33). Another intervention that provided meals and snacks resulted in improvement in diabetes distress and perceived diabetes self-management, but no change in acute-care utilization or A1c (34). A program to screen and address unmet basic needs, including food insecurity, did not find improvement in A1c among people with diabetes, although there were improvements in blood pressure among people with hypertension and in LDL cholesterol among people with an indication for LDL lowering (35). None of these interventions had a control group.
Since food insecurity is strongly associated with other material needs (4) and with poverty more generally, it can be hard to disentangle the effects of different basic resource needs on diabetes outcomes. Our baseline comparisons show that individuals with food insecurity generally have poorer health status, and our crude associations show higher rates of ED visits and hospitalizations and hemoglobin A1c among individuals with food insecurity. We found that the relationship between food insecurity and ED visits and hospitalizations was no longer statistically significant after adjusting for other socioeconomic factors (education, marital status, living situation, and Medicaid). The relationship between food insecurity and A1c persisted after additional adjustment, and adjusting for socioeconomic factors had little effect after adjusting for basic demographics and clinical characteristics. However, the differences in A1c were small (less than 0.3% [3.3 mmol/mol]).
Two limitations with regards to our assessment of food insecurity deserve mention. First, we assessed food insecurity using a single question whose validity has not been determined (22, 32), and which does not assess other related concepts (nutrition insecurity, undernutrition, hunger) which may be relevant in diabetes (36). Our food insecurity question was drawn from the Nutrition Health Screener of the Nutrition Screening Initiative, a validated instrument to assess nutrition in older adults (22). Previous work has shown that this item correlates well with known predictors of food insecurity (32). In a survey of 110 individuals with positive responses to the food insecurity question on the MTHA, 74% responded “sometimes” or “often” to one or both of the 2 questions in the Hunger Vital Sign (ref) (37, 38). Other work has also shown fair to good agreement between different single-question food insecurity questions and more comprehensive assessments, with sensitivity of 83% and specificity of 80% in one study (39) and sensitivity of 59% and specificity of 87% in another study (40).
In addition, food insecurity changes over time (4, 41). Due to limitations in the number of people with multiple food security assessments, we used a single assessment. Thus we do not know whether participants remained food insecure during the follow-up period. Conversely, individuals may have had long standing food insecurity, and thus their baseline utilization, A1c, and adherence data may already reflect the effect of food insecurity. In this case, adjusting for these baseline variables would represent over adjustment.
Since the data for this study was derived from a survey limited to the Medicare population, we do not have comparable data on younger KPCO members. Elderly individuals are at high risk of food insecurity, however, and make up over 40% of individuals with diabetes (1, 42). Relationships between food insecurity and emergency department visits, hospitalizations, A1c, and medication adherence may be different in younger populations. In addition, due to competing risks, individuals with more severe diabetes who do not survive to age 65 or individuals with increased mortality due to food insecurity are not included in our analysis. Due to the age range of our cohort, we also were unable to assess the impact of differences in insurance coverage, as would be seen in younger age groups. Additionally, other than Medicaid coverage, we did not have information on income, wealth, or other material needs (housing, ability to pay for mediations, etc.). Finally, with observational data it can be difficult to draw causal inference. As our findings illustrate, the relationship between food insecurity and diabetes outcomes is complex.
5. Conclusions
As one of the few studies of food insecurity and diabetes outcomes, this study adds considerably to the existing literature. We found that individuals with food insecurity and diabetes have more frequent ED visits and hospitalizations and higher A1c, although these differences were ameliorated by adjustment for other socioeconomic factors. This illustrates that adverse outcomes in individuals with diabetes and food insecurity may be driven by the effect of food insecurity per se or may be mediated by a constellation of basic resource needs or other effects of lower socioeconomic status. Food insecurity may directly affect diabetes self-management, for example through skipping meals. However, food insecurity does not exist in a vacuum, and thus associations must be interpreted with recognition of the financial and time tradeoffs that food insecure individuals must make every day – between food and health care, food and housing, and food and other basic material needs.
Supplementary Material
Acknowledgements
This study was supported by unrestricted funds from the Community Benefit Program, Kaiser Foundation Health Plan. E.B.S. was supported by grant K23 DK099237 from the National Institute for Diabetes and Digestive and Kidney Diseases. The content is solely the responsibility of the authors and does not necessarily represent the official views of Kaiser Foundation Health Plan or of the National Institutes of Health. A portion of this material was presented at the American Diabetes Association 78th Scientific Sessions, June 22–26, 2018 in Orlando, FL.
References
- 1.Coleman-Jensen A, Rabbitt MP, Gregory CA, Singh A. Household food insecurity in the United States in 2016, ERR-237. U.S. Department of Agriculture, Economic Research Service, 2017. Accessed at https://www.ers.usda.gov/publications/pub-details/?pubid=84972 on 5/31/2018. [Google Scholar]
- 2.Berkowitz SA, Berkowitz TSZ, Meigs JB, Wexler DJ. Trends in food insecurity for adults with cardiometabolic disease in the United States: 2005–2012. PLoS One 2017;12:e0179172. [DOI] [PMC free article] [PubMed] [Google Scholar]
- 3.Gregory CA, Coleman-Jensen A. Food insecurity, chronic disease, and health among working-age adults, ERR-235. U.S. Department of Agriculture, Economic Research Service, 2017. Accessed at https://www.ers.usda.gov/publications/pub-details/?pubid=84466 on 5/31/2018. [Google Scholar]
- 4.Berkowitz SA, Meigs JB, DeWalt D, et al. Material need insecurities, control of diabetes mellitus, and use of health care resources: results of the Measuring Economic Insecurity in Diabetes study. JAMA Intern Med 2015;175:257–265 [DOI] [PMC free article] [PubMed] [Google Scholar]
- 5.Mayer VL, McDonough K, Seligman H, Mitra N, Long JA. Food insecurity, coping strategies and glucose control in low-income patients with diabetes. Public Health Nutr 2016;19:1103–1111 [DOI] [PMC free article] [PubMed] [Google Scholar]
- 6.Seligman HK, Jacobs EA, Lopez A, Tschann J, Fernandez A. Food insecurity and glycemic control among low-income patients with type 2 diabetes. Diabetes Care 2012;35:233–238 [DOI] [PMC free article] [PubMed] [Google Scholar]
- 7.Silverman J, Krieger J, Kiefer M, Hebert P, Robinson J, Nelson K. The relationship between food insecurity and depression, diabetes distress and medication adherence among low-income patients with poorly-controlled diabetes. J Gen Intern Med 2015;30:1476–1480 [DOI] [PMC free article] [PubMed] [Google Scholar]
- 8.Berkowitz SA, Karter AJ, Corbie-Smith G, et al. Food insecurity, food “deserts,” and glycemic control in patients with diabetes: a longitudinal analysis. Diabetes Care 2018;41:1188–1195 [DOI] [PMC free article] [PubMed] [Google Scholar]
- 9.Ippolito MM, Lyles CR, Prendergast K, Marshall MB, Waxman E, Seligman HK. Food insecurity and diabetes self-management among food pantry clients. Public Health Nutr 2017;20:183–189 [DOI] [PMC free article] [PubMed] [Google Scholar]
- 10.Seligman HK, Davis TC, Schillinger D, Wolf MS. Food insecurity is associated with hypoglycemia and poor diabetes self-management in a low-income sample with diabetes. J Health Care Poor Underserved 2010;21:1227–1233 [DOI] [PMC free article] [PubMed] [Google Scholar]
- 11.Seligman HK, Jacobs EA, Lopez A, Sarkar U, Tschann J, Fernandez A. Food insecurity and hypoglycemia among safety net patients with diabetes. Arch Intern Med 2011;171:1204–1206 [DOI] [PMC free article] [PubMed] [Google Scholar]
- 12.Seligman HK, Bolger AF, Guzman D, Lopez A, Bibbins-Domingo K. Exhaustion of food budgets at month’s end and hospital admissions for hypoglycemia. Health Aff (Millwood) 2014;33:116–123 [DOI] [PMC free article] [PubMed] [Google Scholar]
- 13.Basu S, Berkowitz SA, Seligman H. The monthly cycle of hypoglycemia: an observational claims-based study of emergency room visits, hospital admissions, and costs in a commercially insured population. Med Care 2017;55:639–645 [DOI] [PMC free article] [PubMed] [Google Scholar]
- 14.Billimek J, Sorkin DH. Food insecurity, processes of care, and self-reported medication underuse in patients with type 2 diabetes: results from the California Health Interview Survey. Health Serv Res 2012;47:2159–2168 [DOI] [PMC free article] [PubMed] [Google Scholar]
- 15.Nelson K, Cunningham W, Andersen R, Harrison G, Gelberg L. Is food insufficiency associated with health status and health care utilization among adults with diabetes? J Gen Intern Med 2001;16:404–411 [DOI] [PMC free article] [PubMed] [Google Scholar]
- 16.Gucciardi E, Vahabi M, Norris N, Del Monte JP, Farnum C. The intersection between food insecurity and diabetes: a review. Curr Nutr Rep 2014;3:324–332 [DOI] [PMC free article] [PubMed] [Google Scholar]
- 17.Centers for Medicare and Medicaid Services. The ABCs of the annual wellness visit, 2017. Accessed at https://www.cms.gov/Outreach-and-Education/Medicare-Learning-Network-MLN/MLNProducts/downloads/AWV_chart_ICN905706.pdf on 5/15/2017 2017.
- 18.Goetzel RZ, Staley P, Ogden L, et al. A framework for patient-centered health risk assessments – providing health promotion and disease prevention services to Medicare beneficiaries. Atlanta, GA: US Department of Health and Human Services, Centers for Disease Control and Prevention, 2011. Accessed at https://www.cdc.gov/policy/hst/hra/FrameworkForHRA.pdf on 5/15/2017. [Google Scholar]
- 19.Ross TR, Ng D, Brown JS, Pardee R, et al. The HMO Research Network Virtual Data Warehouse: a public data model to support collaboration. EGEMS. (Wash. DC.) 2014;2:1049. [DOI] [PMC free article] [PubMed] [Google Scholar]
- 20.Nichols GA, Desai J, Elston LJ, et al. Construction of a multisite DataLink using electronic health records for the identification, surveillance, prevention, and management of diabetes mellitus: the SUPREME-DM Project. Prev Chronic Dis 2012;9:E110. [DOI] [PMC free article] [PubMed] [Google Scholar]
- 21.Nichols GA, Schroeder EB, Karter AJ, et al. Trends in diabetes incidence among 7 million insured adults, 2006–2011: The SUPREME-DM Project. Am J Epidemiol 2015;181:32–39 [DOI] [PMC free article] [PubMed] [Google Scholar]
- 22.Posner BM, Jette AM, Smith KW, Miller DR. Nutrition and health risks in the elderly: the nutrition screening initiative. Am J Public Health 1993;83:972–978 [DOI] [PMC free article] [PubMed] [Google Scholar]
- 23.Selby JV, Peng T, Karter AJ, et al. High rates of co-occurrence of hypertension, elevated low-density lipoprotein cholesterol, and diabetes mellitus in a large managed care population. Am J Manag Care 2004;10:163–170 [PubMed] [Google Scholar]
- 24.Levey AS, Stevens LA, Schmid CH, et al. A new equation to estimate glomerular filtration rate. Ann Intern Med 2009;150:604–612 [DOI] [PMC free article] [PubMed] [Google Scholar]
- 25.Quan H, Sundararajan V, Halfon P, et al. Coding algorithms for defining comorbidities in ICD-9-CM and ICD-10 administrative data. Med Care 2005;43:1130–1139 [DOI] [PubMed] [Google Scholar]
- 26.Lowe B, Kroenke K, Grafe K. Detecting and monitoring depression with a two-item questionnaire (PHQ-2). J Psychosom Res 2005;58:163–171 [DOI] [PubMed] [Google Scholar]
- 27.Katz S Assessing self-maintenance: activities of daily living, mobility, and instrumental activities of daily living. J Am Geriatr Soc 1983;31(12):721–727 [DOI] [PubMed] [Google Scholar]
- 28.Lawton MP, Brody EM. Assessment of older people: self-maintaining and instrumental activities of daily living. Gerontologist 1969;9:179–186 [PubMed] [Google Scholar]
- 29.Hess LM, Raebel MA, Conner DA, Malone DC. Measurement of adherence in pharmacy administrative databases: a proposal for standard definitions and preferred measures. Ann. Pharmacother 2006;40:1280–1288 [DOI] [PubMed] [Google Scholar]
- 30.Ginde AA, Blanc PG, Lieberman RM, Camargo CA Jr. Validation of ICD-9-CM coding algorithm for improved identification of hypoglycemia visits. BMC Endocr Disord 2008;8:4. [DOI] [PMC free article] [PubMed] [Google Scholar]
- 31.Liu Y, De A. Multiple imputation by fully conditional specification for dealing with missing data in a large epidemiologic study. Int J Stat Med Res 2015;4:287–295 [DOI] [PMC free article] [PubMed] [Google Scholar]
- 32.Steiner JF, Stenmark SH, Sterrett AT, et al. Food insecurity in older adults in an integrated health care system. J Am Geriatr Soc 2018;66:1017–1024 [DOI] [PubMed] [Google Scholar]
- 33.Seligman HK, Lyles C, Marshall MB, et al. A pilot food bank intervention featuring diabetes-appropriate food improved glycemic control among clients in three states. Health Aff (Millwood) 2015;34:1956–1963 [DOI] [PubMed] [Google Scholar]
- 34.Palar K, Napoles T, Hufstedler LL, et al. Comprehensive and medically appropriate food support is associated with improved HIV and diabetes health. J Urban Health 2017;94:87–99 [DOI] [PMC free article] [PubMed] [Google Scholar]
- 35.Berkowitz SA, Hulberg AC, Standish S, Reznor G, Atlas SJ. Addressing unmet basic resource needs as part of chronic cardiometabolic disease management. JAMA Intern Med 2017;177:244–252 [DOI] [PMC free article] [PubMed] [Google Scholar]
- 36.Jones AD, Ngure FM, Pelto G, Young SL. What are we assessing when we measure food insecurity? A compendium and review of current metrics. Adv Nutr 2013;4:481–505. [DOI] [PMC free article] [PubMed] [Google Scholar]
- 37.Hager ER, Quigg AM, Black MM, et al. Development and validity of a 2-item screen to identify families at risk for food insecurity. Pediatrics 2010;126:e26–32. [DOI] [PubMed] [Google Scholar]
- 38.Steiner JF, Kimpo TK, Lawton CI, et al. Measuring basic resource needs: the role of small surveys to guide operational decisions. Permanente J 2018;22:18–098. [Google Scholar]
- 39.Kleinman MD, Murphy JM, Wieneke KM, et al. Use a single-question screening tool to detect hunger in families attending a neighborhood health center. Ambulatory Pediatrics 2007;7:278–84. [DOI] [PubMed] [Google Scholar]
- 40.Lane WG, Dubowitz H, Fiegelman S, Poole G. The effectiveness of food insecurity screening in pediatric primary care. Int J Child Health Nutr. 2014;3:130–8. [DOI] [PMC free article] [PubMed] [Google Scholar]
- 41.Kushel MB, Gupta R, Gee L, Haas JS. Housing instability and food insecurity as barriers to health care among low-income Americans. J Gen Intern Med 2006;21:71–77 [DOI] [PMC free article] [PubMed] [Google Scholar]
- 42.Centers for Disease Control and Prevention.. National Diabetes Statistics Report, 2017. Atlanta, GA: Centers for Disease Control and Prevention, U.S. Department of Health and Human Services; 2017. [Google Scholar]
Associated Data
This section collects any data citations, data availability statements, or supplementary materials included in this article.