Abstract
Optical coherence tomography (OCT) is used to produce high resolution depth images of the retina and is now the standard of care for in-vivo ophthalmological assessment. In particular, OCT is used to study the changes in layer thickness across various pathologies. The automated image analysis of these OCT images has primarily been performed with graph based methods. Despite the preeminence of graph based methods, deep learning based approaches have begun to appear within the literature. Unfortunately, they cannot currently guarantee the strict biological tissue order found in human retinas. We propose a cascaded fully convolutional network (FCN) framework to segment eight retina layers and preserve the topological relationships between the layers. The first FCN serves as a segmentation network which takes retina images as input and outputs the segmentation probability maps of the layers. We next perform a topology check on the segmentation and those patches that do not satisfy the topology criterion are passed to a second FCN for topology correction. The FCNs have been trained on Heidelberg Spectralis images and validated on both Heidelberg Spectralis and Zeiss Cirrus images.
Keywords: Retina OCT, Fully convolutional network, Topology preserving
1. Introduction
Optical coherence tomography (OCT) is a widely used modality for imaging the retina as it is non-invasive, non-ionizing, and provides three-dimensional data which can be rapidly acquired [6]. OCT improves upon traditional 2D fundus photography by providing depth information, which enables measurements of layer thicknesses that are known to change with certain diseases [9]. Automated methods for measuring layer thicknesses in large-scale studies are critical since manual delineation is time consuming. In recent years, many automated methods have been developed for the segmentation of retinal layers [3, 7, 10]. The most prominent technique in use for OCT images are graph based methods coming from the work of Garvin et al. [5]. Recent developments in deep learning have made deep convolutional networks a viable alternative to this status quo and it provides a more flexible framework for abnormal retina analysis. Fang et al. [4] used a convolutional neural network to predict the central pixel label of a given image patch, and subsequently used the graph based approach to finalize the segmentation. However, such patch based pixel-wise labeling schemes use overlapped patches which introduces redundancy and a trade-off between localization accuracy and patch size.
The more elegant architectures of fully convolutional networks (FCNs) [8] have been proposed and applied to various segmentation tasks. In FCNs, the fully connected layer of traditional convolutional neural networks is replaced with convolutional layer. The network can be trained end-to-end and pixels-to-pixels, and the outputs can have high resolution. This architecture avoids patch based pixel labeling and is thus more efficient. Roy et al. [13] designed a fully convolutional network to segment retina layers and fluid filled cavities in OCT images.
Although FCN based networks have been successful in various segmentation tasks, at its core it is providing pixel-wise labeling without using higher-level priors like topological relationships between layers or layer shape, and can thus give nonsense segmentations. In the case of OCT, or medical imaging in general, there are strict anatomical relationships that should be preserved. Approaches proposed to solve this include, Chen et al. [2] using a fully connected conditional random field (CRF) as a post-processing method for the segmentation map from a deep network; however, the CRF does not utilize the topology or shape prior information. Bentaieb et al. [1] proposed a hand-designed loss function to penalize topology disorders, but the pixel-wise labeling of FCN still cannot guarantee the topology correctness and cannot fix the topology defects. Ravishankar et al. [11] used a FCN to segment kidney and cascaded a convolutional auto-encoder to regularize the shape and works well.
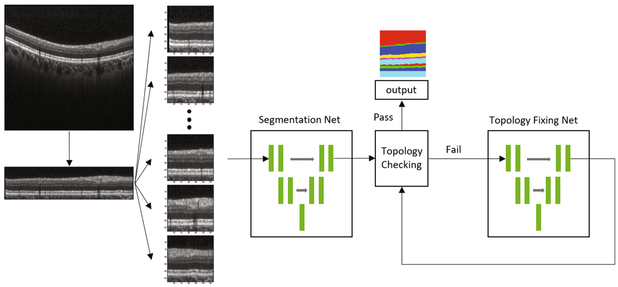
We propose to segment the retina layers as well as building a framework to correct topological defects that contradict the known anatomy of healthy human retinas. We do this by cascading two FCNs. The first FCN segments the retina layers and produce the initial segmentation masks. We also proposed an algorithm to check the topology correctness of the segmentation. We then iterate the masks with topology defects over the second FCN to fix the defects and check the topology until all the segmentation masks have the correct topology or an max iteration count is reached. Since the topology fixing net fixes most of the topology defects in the first two iterations, only a small number of masks need to iterate through the second net multiple times. There are two key differences between our approach and the work of Ravishankar et al. Firstly, we iterate over the topology correction step with successive iterations correcting 98% of defects; secondly our network is structurally similar to a segmentation style network with long skip connections and is not a convolutional auto-encoder.
2. Method
2.1. Preprocessing
We first identify the Bruch’s membrane and flatten the input images to it, which is a standard OCT pre-processing step. We then subdivide the B-scan into 128 × 128 overlapping image patches with a fixed step size (determined by the B-scan size), resulting in 10 image patches per B-scan. When we reconstruct the B-scan segmentation from those patches we average the segmentation probability map if they are overlapped. See the pre-processing portion of Fig. 1.
Fig. 1.
Our proposed cascaded FCNs, made up of a Segmentation FCN and Topology fixing FCN that we iterate over to resolve topology errors.
2.2. Segmentation Network Architecture
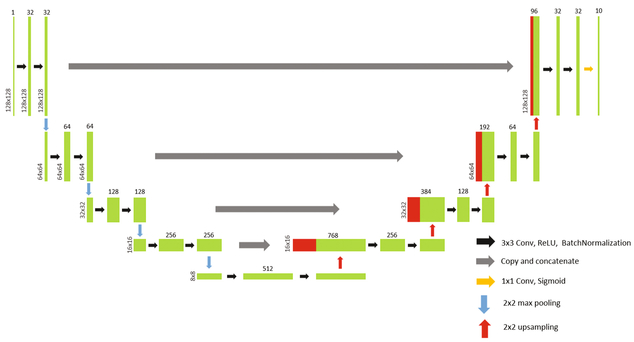
Our segmentation FCN (S-Net) is based on U-net [12], and consists of a contracting encoder and an expansive decoder. The encoder takes a 128 × 128 image patch as input and repeatedly uses 3 × 3 convolutions and rectified linear unit (ReLU) activation followed by batch normalization. We conduct 2 × 2 max pooling at four different layers in the encoder to down sample the image patches. The decoder portion of our FCN concatenates the feature map from the corresponding encoder and up-samples it repeatedly. The final output from S-Net is a 10 × 128 × 128 volume, which corresponds to probability maps for our eight layers and backgrounds above and below the retina(vitreous and choroid). Figure 2 shows a schematic of the network used, with training outlined in Sect. 2.5.
Fig. 2.
A schematic of the network structure of S-Net and T-Net.
2.3. Topology Correction Network Architecture
The topology fixing net (T-Net) shares the same structure as S-Net, with the addition of an applied dropout of 0.5 after each max pooling and up-sampling layer. T-Net tries to learn the shape and correct topology of the true segmentation and use the learnt knowledge to fix the topology identified in the output of S-Net. Training for T-Net is outlined in Sect. 2.5.
2.4. Topology Checking
The segmentation masks should have a strict topology relationship, with layers being nested, and the k-th layer should only touch the (k − 1)-th and (k + 1)-th layers with no overlaps or gaps for k = 1,…, 8 (k = 0 and 9 are the vitreous and choroid respectively). S-Net outputs a segmentation mask of size 10 × 128 × 128, which we denote as Mk (x) for k = 0,…, 9, with x the A-scan index within the 128 × 128 image patch. We build a new mask, Mt (x), as
Figure 3 shows an example Mt (x) and the corresponding profile of one A-scan. We perform a backward difference within each A-scan, if the topology is correct, there are no negative values. However, if there are hierarchical disorders, gaps, or overlaps, there will be negative values. We use this analysis to identify segmentation masks with topological defects, and such masks are passed to T-Net for correction.
Fig. 3.
Shown is an example of (a) Mt(x), the segmentation groundtruth without any topology defects. While a single (b) middle A-scan of (a), shows that we expect Mt(x) to be a strictly increasing function when there are no topological defects. (c) is the image with simulated topology defects added on (a) and the (d) middle A-scan of (c), showing the effects of topology errors.
2.5. Training
S-Net is trained based on 128 × 128 Spectralis image patches, with output 10 × 128 × 128 based on manual delineation of the OCT data. We train the FCN using back-propagation to minimize a loss function based on a modified Dice score between the ground truth and the output segmentations. T-Net, which fixes topology errors in the segmentation maps, is trained on manual delineations with simulated randomly generated topological defects. Examples of our simulated defects and the corresponding ground truth are shown in Fig. 3.
3. Experiments
3.1. Data
We have 7 Spectralis Spectral Domain OCT (SD-OCT) scans (of size 496 × 1024 × 49) and each has 8 B-scans manually delineated for training. We flatten and crop each B-scan into 128 × 1024 size images and extract overlapped 128 × 128 patches by a fixed step and obtain 69 patches from each B-scan, with 7 × 8 × 69 = 3864 total training patches. For validation, we have 10 manually delineated Spectralis scans (totaling 490 manually delineated B-scans) and 6 manually delineated Cirrus scans, each has 8 B-scans delineated (totaling 48 B-scans).
3.2. Comparison to Manual Segmentation
Spectralis.
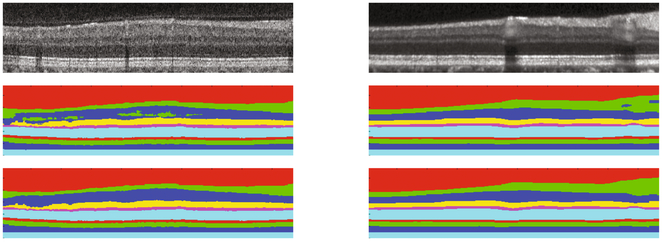
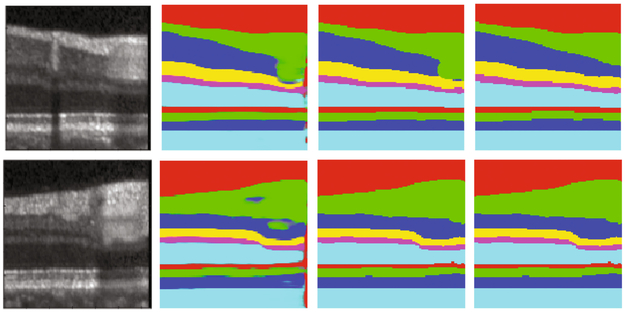
We compared the cascaded network (S-Net + T-Net) with the single segmentation network (S-Net) and a state-of-art random forest and graph cut based method (RF+Graph) [7]. The Dice coefficients between the segmentation results and manual delineation of eight retina layers are shown in Table 1. RF + Graph is still better than the deep network as the graph have been designed and refined for retina segmentation. However, the deep network (S-Net) has reached similar performance to the RF + Graph and the topology fixing (S-Net + T-Net) gives the deep network the correct anatomical structure. See Fig. 4 for example results.
Table 1.
Dice coefficients of eight layers evaluated against 490 manually delineated Spectralis B-scans.
| Layer | RNFL | GCL+IPL | INL | OPL | ONL | IS | OS | RPE |
|---|---|---|---|---|---|---|---|---|
| S-Net | 0.898 | 0.917 | 0.829 | 0.776 | 0.933 | 0.832 | 0.839 | 0.874 |
| S-Net + T-Net | 0.904 | 0.922 | 0.830 | 0.776 | 0.935 | 0.835 | 0.839 | 0.873 |
| RF + Graph | 0.914 | 0.926 | 0.831 | 0.787 | 0.939 | 0.833 | 0.844 | 0.873 |
Fig. 4.
The top row shows Cirrus and Spectralis B-scans, respectively. The second row shows the segmentation after S-Net, and the bottom row shows the effect of topology correction with the output from T-Net.
Cirrus.
The network was trained only on Spectralis images, but was also evaluated on Cirrus images, with results shown in Table 2. In this case, we used the version of RF + Graph that had been trained on Cirrus data, with graph parameters specifically chosen to optimize performance on Cirrus data. It is observed that S-Net + T-Net has reached comparable performance to that of RF + Graph, which is rather striking given that the deep network had been trained only on Spectralis data. See Fig. 4 for example results.
Table 2.
Dice coefficients of eight layers evaluated against 48 manually delineated Cirrus B-scans.
| Layer | RNFL | GCL+IPL | INL | OPL | ONL | IS | OS | RPE |
|---|---|---|---|---|---|---|---|---|
| S-Net | 0.846 | 0.927 | 0.897 | 0.773 | 0.948 | 0.792 | 0.818 | 0.901 |
| S-Net + T-Net | 0.860 | 0.939 | 0.899 | 0.776 | 0.951 | 0.800 | 0.820 | 0.844 |
| RF + Graph | 0.909 | 0.950 | 0.919 | 0.815 | 0.958 | 0.915 | 0.916 | 0.927 |
3.3. Evaluation of Topology Correction
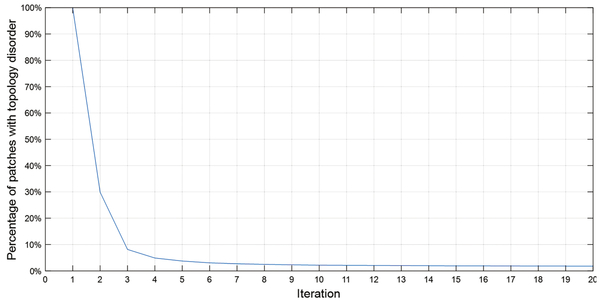
From Tables 1 and 2 we see only small improvements in the Dice coefficients after the T-Net because the topology disorders only affect a small number of pixels, but the topology disorders are greatly decreased. Figure 5 shows the relation between the percentage of patches with topology disorders and the iteration through the T-Net. After eight iterations most segmentation masks converge to the correct topology. Figure 6 shows some examples of T-Net.
Fig. 5.
Percentage of patches with topology disorder and the iterations into the topology fixing net.
Fig. 6.
From left to right: original patch, initial segmentation mask by S-Net, first iteration through T-Net, and fourth iteration through T-Net.
4. Conclusions
In the paper, we propose a cascaded FCN framework to segment both Spectralis and Cirrus retina SD-OCT images while addressing the topology relations between layers. The topology fixing net is learning the shape and topology priors of the segmentation and uses the learnt priors to fix the topology disorders. It fixes 98% of them within eight iterations. The topology errors that are not corrected are usually single wrongly labeled pixels around layer boundaries as they are not represented in the simulated training data. We expect that better topology correction can be achieved by simulating more representative topology defects and include manually selected real topology defects and original image intensities as extra information. We plan to modify the framework to incorporate the prior topological knowledge for segmenting abnormal retinas.
References
- 1.BenTaieb A, Hamarneh G: Topology aware fully convolutional networks for histology gland segmentation In: Ourselin S, Joskowicz L, Sabuncu MR, Unal G, Wells W (eds.) MICCAI 2016. LNCS, vol. 9901, pp. 460–468. Springer, Cham: (2016). doi: 10.1007/978-3-319-46723-8.53 [DOI] [Google Scholar]
- 2.Chen LC, Papandreou G, Kokkinos I, Murphy K, Yuille AL: Deeplab: semantic image segmentation with deep convolutional nets, atrous convolution, and fully connected crfs. IEEE Trans. Pattern Anal. Mach. Intell 5(99), 1 (2017) [DOI] [PubMed] [Google Scholar]
- 3.Chiu SJ, Li XT, Nicholas P, Toth CA, Izatt JA, Farsiu S: Automatic segmentation of seven retinal layers in SDOCT images congruent with expert manual segmentation. Opt. Express 18(18), 19413–19428 (2010) [DOI] [PMC free article] [PubMed] [Google Scholar]
- 4.Fang L, Cunefare D, Wang C, Guymer RH, Li S, Farsiu S: Automatic segmentation of nine retinal layer boundaries in OCT images of non-exudative AMD patients using deep learning and graph search. Biomed. Opt. Express 8(5), 2732–2744 (2017) [DOI] [PMC free article] [PubMed] [Google Scholar]
- 5.Garvin MK, Abràmoff MD, Wu X, Russell SR, Burns TL, Sonka M: Automated 3-D intraretinal layer segmentation of macular spectral-domain optical coherence tomography images. IEEE Trans. Med. Imag. 28(9), 1436–1447 (2009) [DOI] [PMC free article] [PubMed] [Google Scholar]
- 6.Hee MR, Izatt JA, Swanson EA, Huang D, Schuman JS, Lin CP, Puli- afito CA, Fujimoto JG: Optical coherence tomography of the human retina. Arch. Ophthalmol. 113(3), 325–332 (1995) [DOI] [PubMed] [Google Scholar]
- 7.Lang A, Carass A, Hauser M, Sotirchos ES, Calabresi PA, Ying HS, Prince JL: Retinal layer segmentation of macular OCT images using boundary classification. Biomed. Opt. Express 4(7), 1133–1152 (2013) [DOI] [PMC free article] [PubMed] [Google Scholar]
- 8.Long J, Shelhamer E, Darrell T: Fully convolutional networks for semantic segmentation. In: The IEEE Conference on Computer Vision and Pattern Recognition (CVPR), pp. 3431–3440, June 2015 [DOI] [PubMed] [Google Scholar]
- 9.Medeiros FA, Zangwill LM, Alencar LM, Bowd C, Sample PA, Susanna R Jr., Weinreb RN: Detection of glaucoma progression with stratus OCT retinal nerve fiber layer, optic nerve head, and macular thickness measurements. Invest. Ophthalmol. Vis. Sci 50(12), 5741–5748 (2009) [DOI] [PMC free article] [PubMed] [Google Scholar]
- 10.Novosel J, Thepass G, Lemij HG, de Boer JF, Vermeer KA, van Vliet LJ: Loosely coupled level sets for simultaneous 3D retinal layer segmentation in optical coherence tomography. Med. Image Anal 26(1), 146–158 (2015) [DOI] [PubMed] [Google Scholar]
- 11.Ravishankar H, Venkataramani R, Thiruvenkadam S, Sudhakar P, Vaidya V: Learning and incorporating shape models for semantic segmentation. In: 20th International Conference on Medical Image Computing and Computer Assisted Intervention (MICCAI 2017) LNCSc. Springer, Heidelberg (2017). https://www.researchgate.net/profile/Sheshadri_Thiruvenkadam/publication/314256462_Learning_and_incorporating_shape_models_for_semantic_segmentation/links/58be2ddc45851591c5e9c108/Learning-and-incorporating-shape-models-for-semantic-segmentation.pdf [Google Scholar]
- 12.Ronneberger O, Fischer P, Brox T: U-Net: convolutional networks for biomedical image segmentation In: Navab N, Hornegger J, Wells WM, Frangi AF (eds.) MICCAI 2015. LNCS, vol. 9351, pp. 234–241. Springer, Cham: (2015). doi: 10.1007/978-3-319-24574-4_28 [DOI] [Google Scholar]
- 13.Roy AG, Conjeti S, Karri SPK, Sheet D, Katouzian A, Wachinger C, Navab N: ReLayNet: retinal layer and fluid segmentation of macular optical coherence tomography using fully convolutional network. CoRR abs/1704.02161 (2017) [DOI] [PMC free article] [PubMed] [Google Scholar]


