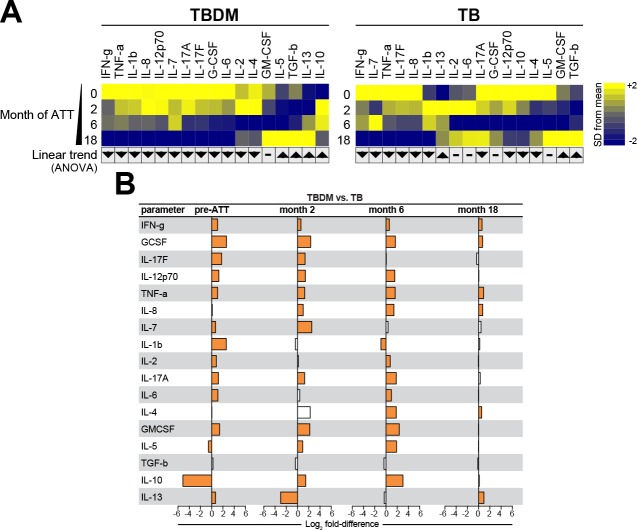
Figure 3. Biomarker profiles during anti-TB treatment in TBDM comorbidity from the India cohort.
(A) Mean log-transformed values for the indicated analytes were calculated and z-score normalized. Heatmaps with values from the India cohort grouped using hierarchical clustering (Ward’s method with 100x bootstrap) was used to illustrate the overall variation in plasma concentrations over time. In addition, one-way ANOVA with linear trans ad hoc test was used to test the direction of variation in each analyte’s concentration between study timepoints. Direction of the arrows highlight statistically significant trends, while “- “denotes differences with P values ≥ 0.05. (B) Mean fold-difference of analyte levels between the TBDM and TB groups in the India cohort. Orange bars indicated statistically significant differences (p<0.05).


