Abstract
The anti-oxidant lipoic acid (LA) is beneficial in murine models of multiple sclerosis (MS) and has recently been shown to slow brain atrophy in secondary progressive MS. The mechanism of these effects by LA is incompletely understood but may involve effects on microglia. The objective is to understand how LA affects microglial cells. We cultured primary microglial cells from C57BL/6 adult mice brains and stimulated the cells with lipopolysaccharide (LPS) and interferon gamma (IFN-γ) in the presence or absence of LA. We demonstrate the inhibition of phagocytosis, rearrangement of actin, and formation of membrane blebs in stimulated, activated microglia in the presence of LA. These experiments suggest that LA causes changes in microglial actin, which may lead to alterations in phagocytosis, mobility, and migration.
Keywords: microglia, phagocytosis, actin, blebs, cytoskeleton
1. Introduction
Several groups have demonstrated that lipoic acid (LA), an endogenously produced antioxidant, effectively suppresses and treats spinal cord inflammation and axonal degeneration in experimental autoimmune encephalomyelitis (EAE; Marracci et al. 2002; Morini et al. 2004, Wang et al. 2013). We further established that LA confers neuroprotection and decreases inflammation of optic neuritis in mice (Chaudhary et al. 2011). LA inhibits T cell migration, expression of intercellular adhesion molecule 1 (ICAM-1) and vascular cell adhesion molecule (VCAM-1) by CNS endothelial cells in EAE (Chaudhary et al. 2006). Recently, Spain et al. 2017 demonstrated that LA significantly slowed whole brain atrophy in secondary progressive multiple sclerosis (MS).
How LA mediates its therapeutic effects in EAE and secondary progressive MS is uncertain. Microglia and macrophages are important in the pathogenesis of MS. Their activation leads to production of oxygen and nitric oxide radicals that may mediate demyelination and neurodegeneration (Lassmann et al. 2014). Microglia are also involved in antigen presentation (Chastain et al. 2011), and phagocytosis (Jack et al. 2005; Huizinga et al. 2012) and they produce reactive oxygen species (ROS) during phagocytosis (Mosley and Cuzner, 1996). ROS is a major modulator of many intracellular signaling pathways, therefore therapies that modify microglia ROS may be beneficial in MS and other diseases (Rawji et al. 2013; Mishra and Yong 2016). Microglia undergo complex adaptations that allow them to respond to inflammatory conditions. Cytoskeleton structure is key to many important functions like cell division, migration, phagocytosis, intracellular trafficking, and signaling in macrophages and microglial cells. The cytoskeleton is made up of actin that provides a major force in cell movement by making lamellipod and filopod protrusions (Mitchison and Cramer 1996; May and Machesky 2001). In addition to lamellipod and filopod protrusions, cells can form blebs that are hydrostatic pressure-driven spherical protrusions on the cell surface (Paluch and Raz 2013). These membrane-bound bubbles initially lack the actin cytoskeleton. The blebs subsequently fill in with actin cortex below the plasma membrane and the blebs can then retract or form into pseudopods. The formation and function of blebs is unclear (Insall and Machesky 2009).
The effects of LA on microglial cells are not fully understood, but it has been shown that LA inhibits phagocytosis of myelin by macrophages (van der Goes et al. 1998). We therefore investigated the effects of LA on the phagocytosis and cytoskeletal structure in microglial cells. Our results indicate that LA can inhibit phagocytosis by microglia and may do so by altering the actin cytoskeleton.
2. Materials and Methods
2.1. Primary microglial cultures
Primary microglial isolation and culture was adapted from Moussaud and Draheim 2010. All procedures on mice were approved and performed according to institutional guidelines. Adult female C57BL/6 mice were anesthetized and perfused with sterile, ice cold 1X phosphate buffered saline (PBS). Brains were dissected aseptically. The cerebellum and olfactory lobes were removed. Brain tissue was processed using the gentleMACS dissociator (Miltenyi Biotech Inc, San Diego CA, 130–093-235) and neural tissue dissociation kit (Miltenyi Biotech Inc, San Diego CA, 130–092-628) as per manufacturer’s protocols. The cell suspension was agitated and passed through a 100 μm cell strainer, washed, centrifuged and supernatant aspirated. The myelin was removed by applying the cell suspension to a Percoll gradient. The resulting cell pellet was washed and re-suspended in DMEM/F12 with GlutaMax (ThermoFisher Scientific, Invitrogen, Waltham, MA USA, 10565–018) supplemented with 10% fetal bovine serum (FBS), 1% Pen Strep and granulocyte-macrophage colony-stimulating factor (GM-CSF; 5 ng/ml). Two million cells were seeded into poly-L-lysine coated T75 flasks and maintained in a 37°C, 5% CO2 incubator. Cells were allowed to become confluent with media being changed twice a week. At full confluence (day 17–21), the flasks were shaken in a hybridization oven (Boekel Scientific Model 136400) at 37°C for 2–3 hrs to release the microglia into the supernatant. The microglia were collected and used for experiments. Cells were stained with a microglial marker (rat anti-CD11b monoclonal antibody) to assess their purity prior to use. Microglia were cultured on coverslips for at least 3 days in media (DMEM/F12, 10% FBS, 1% Pen Strep) without GM-CSF prior to commencing any experiments. For most experiments cells were seeded at 3.0 × 10⁴/coverslip.
2.2. Flow cytometry
At least 50,000 microglial cells were used for flow cytometry to assess purity. The microglial cells were washed with 1 mL of 1X PBS and centrifuged. The cells were then resuspended with 300μL of 1X PBS. Cells were incubated with FITC rat anti CD11b (5 μl undiluted, BD Bioscience, CA) and APC rat anti CD45 (5 μl, 1:10 diluted, BD Bioscience, CA) at 4°C for 15 min. The cells were washed with 1mL PBS and resuspended with 300μL PBS for flow cytometry using a BD FACSCalibur.
2.3. Immunocytochemistry
Antibody staining was performed after fixation of cells with 4% paraformaldehyde. The cells were permeabilized with PBS containing 0.05% saponin. Saponin was included in all incubations and washes. Anti CD11b (1:200 dilution, Leinco, MO) or CD68 (1:1200 dilution, Bio-Rad, CA) and galectin-3 (1:200 dilution, R&D Systems, MN) were used with Alexa 488 donkey anti rat secondary antibody (A21208, 1:400 dilution, Thermo Fisher, MA) or Alexa 647 donkey anti goat secondary antibody (A21447, 1:400 dilution, MA) (supplementary Fig. 1). The cells were imaged on Zeiss confocal (LSM 780) and Zeiss Elyra PS.1 LSM 710 setup for Airyscan detection. Zen Black 2011 was used to process images.
2.4. Phagocytosis assay
Microglial cells (3 × 10⁴) were plated onto glass coverslips and treated with LPS (2.5 μg/ml, List Biological Laboratories, #304) and IFN-γ (25 Units/ml, Sigma, #I4777) to stimulate and activate the cells (Klegeris and McGeer 2001) Cells were treated with different concentrations of LA (25, 50, 100 μg/ml, Sigma, #T1395) and vehicle for 24 additional hours. Two hours before ending the incubation period, 3 μl of a fluorescent carboxylated-latex bead suspension (L3030, Sigma) in complete DMEM was added to the cultures in a 100:1 bead to cell ratio. Cells were fixed in 4% paraformaldehyde for 10 minutes at RT and processed by immunocytochemistry for the microglial marker CD11b. The cells were imaged on a Zeiss laser scanning microscope and the number of beads per CD11b positive cell were determined. Phagocytosed beads in microglial cells were counted in 4 random fields using a 20X objective. The percentage of phagocytosis-positive cells was calculated for each experimental group. To verify that the presence of beads within the cells was due to active phagocytosis, cells were imaged using z stack on a laser scanning microscope. Cell area was measured from ~ 120 CD11b positive cells.
2.5. Phalloidin staining
Phalloidin (P1951, Sigma), a fungal toxin isolated from the poisonous mushroom, Amanita phalloide, was used to label F actin (Wulf et al. 1979). The cells were fixed in 4% paraformaldehyde for 20 min and permeabilized using PBS containing 0.2% Triton X-100 for 15 min. Cells were then incubated with phalloidin diluted 1:100 in PBS for 30 min. The cells were washed in PBS and mounted in ProLong® Gold antifade reagent (Thermo Fisher Scientific, MA, # P36934). The cells were imaged on a Zeiss super-resolution microscope (Elyra PS.1 LSM 710). Zen Black 2011 was used to process SIM images and maximum intensity projection images were saved.
2.6. Wheat germ agglutinin staining
Wheat germ agglutinin (WGA; Thermo Fisher Scientific, MA, # W11262) selectively binds to N-acetylglucosamine and N-acetylneuraminic acid (sialic acid) residues and labels glycoproteins or glycolipids on cell membranes. We used WGA conjugated to Alexa 594 for staining live and 4% paraformaldehyde fixed cells following the manufacturer’s instructions. A stock solution of 1.0 mg/ml was prepared by dissolving 5.0 mg of lyophilized WGA conjugate in 5.0 ml of phosphate-buffered saline (PBS). For live cell imaging, the cells were incubated in Hanks’ balanced salt solution (HBSS) containing WGA (1:200 diluted) for 10 minutes at 37°C. Cells were washed twice with buffer to remove the labeling solution and imaged in pre-warmed HBSS buffer for imaging. Fixed cells were mounted in ProLong® Gold antifade reagent (Thermo Fisher Scientific, MA, # P36934). The cells were imaged on Zeiss confocal (LSM 780) and Zeiss super-resolution microscopes (Elyra PS.1 LSM 710). Zen Black 2011 was used to process images.
2.7. Statistical analyses
Statistical analyses were performed using the Mann–Whitney U-test or ordered logistic regression or log-binomial regression. Statistical significance was defined as p < 0.05 for all analyses.
3. Results
3.1. Effects of LA on morphology of microglia
The purity of microglial cells was greater than 90% after staining with anti CD11b and CD45 using flow cytometry. These are consistent with the findings of Moussaud and Draheim 2010. After isolation and expansion, microglial cultures on coverslips were also stained with anti CD11b. Unstimulated CD11b+ microglial cells are elongated and have small cell area. However, microglia activated by the presence of LPS/IFN-γ were flattened and enlarged (Table 1). Mean cell area in the presence of LPS/IFN-γ + LA 25 μg/ml was reduced (Table 1). Based on size, the cells were divided into small, medium and large (Table 2). Nearly 50% of cells in LPS/IFN-γ were large as compared to only 4.6% of unstimulated cells. Only 34.7% of stimulated cells in the presence of LA were large (Table 2). LA did not cause microglial cell death in our study when measured by calcein AM staining (data not shown) and therefore the small cell size in presence of LA did not appear to be because of the presence of dying cells.
Table 1.
Cell size under various treatment conditions.
| Condition | Mean cell area (μ2) |
|---|---|
| Unstimulated | 441.6 ± 25.42* |
| LPS/IFN-γ or Stimulated | 1144 ± 57.72 |
| LA 25 μg/ml | 421.7 ± 23.97 |
| LPS/IFN-γ or Stimulated + LA 25 μg/ml | 820.5 ± 50.45* |
p< 0.0001 stimulated cells vs unstimulated cells; stimulated cells vs stimulated cells + LA 25 μg/ml
Table 2.
The effect of LPS/IFN-γ in the absence and presence of LA on microglial cell size
| % small cells | % medium cells | % large cells | |
|---|---|---|---|
| Vehicle control | 67.7 | 27.7 | 4.6 |
| LPS/IFN-γ | 14.8 | 34.8 | 50.4 |
| LA 25 μg/ml | 72.1 | 23.3 | 4.6 |
| LPS/IFN-γ + LA 25 μg/ml | 38.8 | 26.5 | 34.7 |
Area was measured in about 120 to 140 cells per treatment group. The cells were divided as small 100–500 μ2, medium 501–1000 μ2, and large >1000 μ2, and percentages of cells in each category were calculated. Ordered logistic regression was used for analysis of association of cell size to treatment group, comparing treatments according to their odds of having larger cell sizes.
LA25 μg/ml vs vehicle control odds ratio 0.8 (p=0.467)
LPS/IFN-γ vs vehicle control odds ratio 11.6 (p<0.001)
LPS/IFN-γ + LA 25 μg/ml vs vehicle control odds ratio 4.5 (p<0.001)
LPS/IFN-γ + LA 25 μg/ml vs LPS/IFN-γ odds ratio 0.4 (p<0.001)
3.2. Microglia phagocytosis in presence and absence of LA
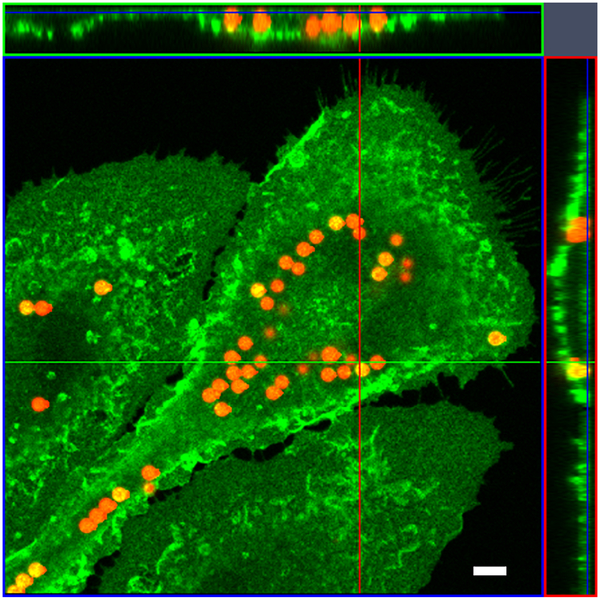
In order to determine phagocytosis in microglial cells we used fluorescent carboxylated-latex beads. The optimum number of beads and time required for phagocytosis were determined by initial experiments. For the phagocytosis assay, we had several different conditions and controls. Cells were stimulated with LPS/IFN-γ, and LA was added at various concentrations (25 μg/ml, 50 μg/ml and 100 μg/ml). The number of beads in about 100 cells were counted in each condition. The engulfment of beads was confirmed by acquiring z stack images of cells (Fig. 1). We further determined the percentage of cells with 1–5 beads and with more than 6 beads based on the observation that unstimulated cells rarely engulfed more than 5 beads whereas a high percentage of stimulated cells phagocytosed 6 or more beads (Table 3). 64% of cells engulfed beads when stimulated with LPS/IFN-γ whereas, only 46% of unstimulated cells engulfed beads. Although there was a trend that stimulated cells engulfed more beads, the difference was not significant (Table 3). Among cells stimulated with LPS/IFN-γ, 25% contained 6 and more beads and only about 1% of cells exposed to LA (25 and 50 μg/ml) had 6 or more beads. Stimulated cells exposed to 100 μg/ml LA did not engulf 6 or more beads.
Fig. 1.
Fluorescent beads engulfed by an activated microglial cell. The z stack image taken on a Zeiss confocal microscope. Ortho image assembled from a Z-stack. The image shows XZ plane (green line) and YZ plane (red line) through the stack of images. Section of the XY plane (blue) is the slice plane of the stack. The result of an orthogonal section is visible at the image margins (above and right). Scale bar 5 μm.
Table 3.
Reduction of phagocytosis in the presence of LA. The results presented are from 4 independent experiments, averaged using log-binomial regression and rounded to nearest integers.
| Total cells counted | % cells with beads | % cells with 1–5 beads | % cells with 6 or more beads | |
|---|---|---|---|---|
| Vehicle control | 117 | 46 | 42 | 4* |
| LPS/IFN-γ | 120 | 64 | 39 | 25 |
| LA 25 μg/ml | 125 | 46# | 44 | 3+ |
| LA 50 μg/ml | 134 | 55 | 52 | 3+ |
| LA 100 μg/ml | 129 | 49 | 43 | 6# |
| LPS/IFN-γ + LA 25 μg/ml | 103 | 17+ | 17# | 1+ |
| LPS/IFN-γ + LA 50 μg/ml | 122 | 18+ | 17* | 1+ |
| LPS/IFN-γ + LA 100 μg/ml | 117 | 38* | 37 | 0+ |
p value = 0.02
= 0.01
< 0.001 when compared to LPS/IFN-γ using log-binomial estimates. Percent (cells with 1–5 beads and cells with 6 or more beads) may not sum to the percent cells with beads because of rounding.
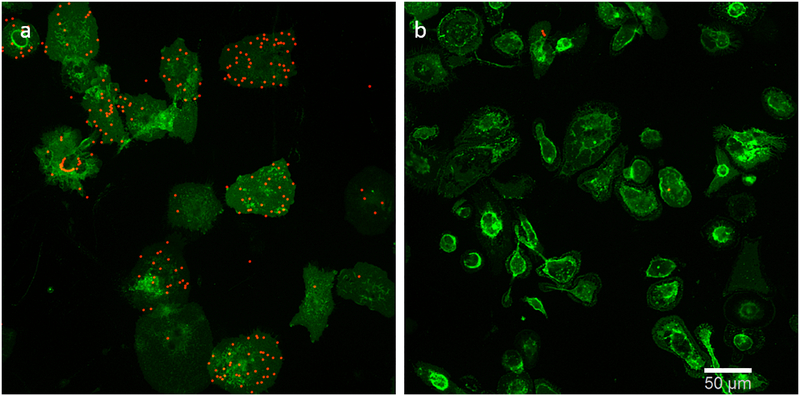
All concentrations of LA used (25, 50 and 100 μg/ml) reduced phagocytosis in stimulated cells significantly with reduction in total percentage of cells taking up beads, and cells taking up 6 or more beads. (Table 3; Fig. 2). In addition, anti galectin-3 and CD68, markers of phagocytosis, were used on cultured microglial cells after 6 hrs exposure time. Galectin-3 staining decreased in cells exposed to LPS/IFN-γ + LA 25 μg/ml as compared with LPS/IFN-γ alone (supplementary Fig. 1). CD68 showed different distribution pattern in presence of LPS/IFN-γ + LA 25 μg/ml. Quantitation of immunostaining was not carried out as the stimulated cells and LPS/IFN-γ + LA 25 μg/ml differ in size. Overall, the data supports the hypothesis that LA decreases the phagocytic ability of microglia.
Fig. 2.
LA decreases phagocytosis. a. LPS/IFN-γ stimulated cells b. LPS/IFN-γ stimulated cells in presence of LA 25 μg/ml. Beads are red and microglial cells stained with anti-CD11b are green. Scale bar 50 μm.
3.3. Cytoskeleton disruption and membrane reorganization
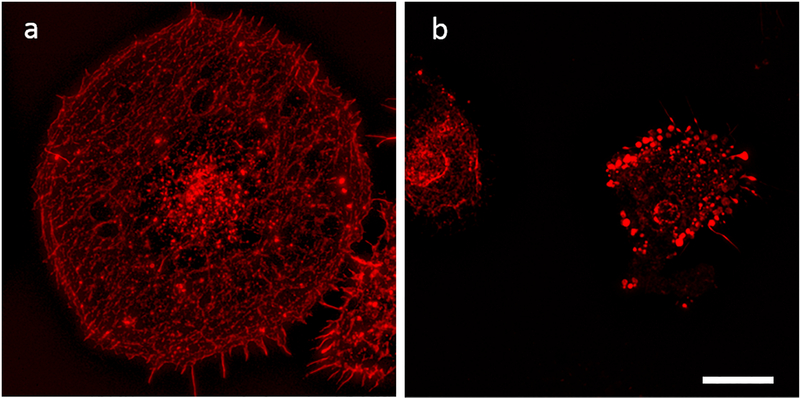
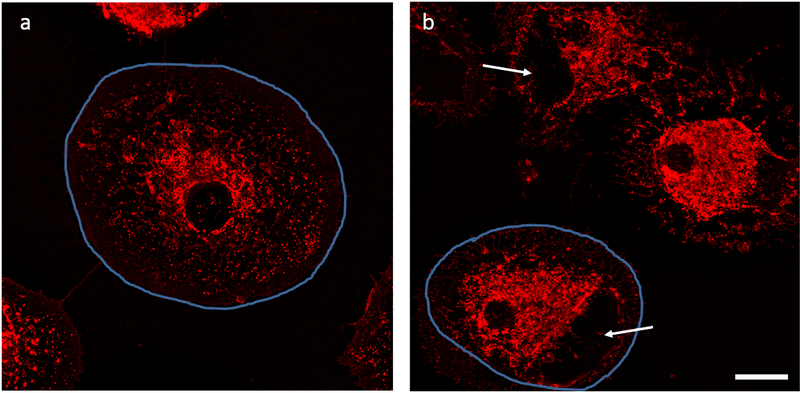
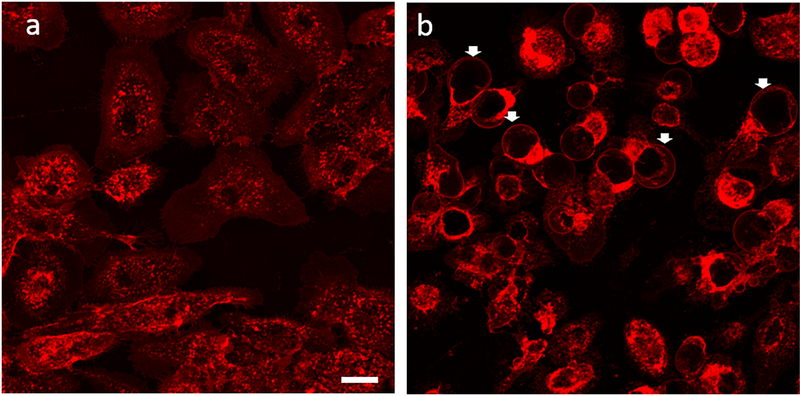
Since cells stimulated with LPS/IFN-γ in the presence of LA were smaller than those stimulated in the absence of LA, we focused on changes to membrane and cytoskeleton organization. Following exposure of microglial cells to LPS/IFN-γ in the presence or absence of LA, cells were stained with phalloidin and imaged using a super-resolution microscope (Zeiss Elyra PS.1). Qualitative analysis showed LPS/IFN-γ stimulated cells in the absence of LA were bigger in size with actin filaments evenly distributed (Fig. 3a) and stimulated cells treated with LA were smaller and had clumped actin filaments (Fig. 3b). Exposure to LA caused morphological alterations in fixed (Fig. 4b) and live (Fig. 5b) cells after staining the cell membrane with fluorescent WGA. Occasional blebs were detected in unstimulated cells in the presence of LA. However, the stimulated cells in the presence LA formed blebs at a much greater frequency (about 30%, Fig. 5b).
Fig. 3.
LA causes disorganization of actin. After 24 hours of stimulation, microglial cells were stained with phalloidin. a. LPS/IFN-γ stimulated cells shows normal fibrillary pattern of staining for actin b. LPS/IFN-γ stimulated cells co-cultured with LA 25 μg/ml shows loss of normal pattern and clumping of actin. Scale bar 10 μm.
Fig. 4.
Morphological alterations were seen in stimulated cells in absence and presence of LA. The cells are outlined in blue to highlight difference in cell size. a. LPS/IFN-γ stimulated cells b. LPS/IFN-γ stimulated cells that were also treated with LA 25 μg/ml. Microglial cells were fixed with paraformaldehyde and stained with WGA after 24 hrs. Arrows indicate blebs. Scale bar 10 μm.
Fig. 5.
LA induces the formation of blebs. After 6 hours of stimulation, live cells were stained with WGA and images were acquired on a confocal using z stack (20X, 2 zoom). Arrows show blebs. a. LPS/IFN-γ stimulated cells b. LPS/IFN-γ stimulated cells co-cultured with LA 25 μg/ml. Scale bar 20 μm.
4. Discussion
In this study, brain derived microglia increased in size when activated by LPS/IFN-γ as compared with unstimulated cells. LPS/IFN-γ exposure changed the morphology of microglia and increased phagocytosis of beads (Fig. 2a). These observed changes in cell morphology in the presence of LPS/IFN-γ accompanied by potentiation of phagocytosis, reorganization of cytoskeletal proteins and changes in actin (Fig. 3a) are similar to those reported in previous publications (Smith et al. 1998; Abd-El-Basset et al. 1995, 2004). Microglial cells exposed to LPS/IFN-γ in the presence of LA were significantly smaller, had reduced phagocytic activity (Fig. 2b, Table 3), had actin aggregation (Fig. 3b), and formed blebs (Fig. 4b and 5b). LA thus has dramatic effects on the morphology and phagocytic activity of activated microglia. In a recent study, galectin-3 was shown to control microglial morphology and phagocytic activity by regulating actin (Reichert and Rotshenker, 2019). In this study, we show that LA reduces galectin-3 (supplementary Fig. 1) thus making it a possible mechanism of action for LA. Van der Goes et al. 1998 demonstrated that LA decreased the phagocytosis of myelin by macrophages. They also showed that the phagocytosis triggered the production of reactive oxygen species (ROS) and that blocking ROS production with dihydronicotinamide-adenine dinucleotide phosphate (NADPH) inhibitors prevented the phagocytosis of myelin. Importantly, we demonstrated that LA alters organization and amount of actin and these changes may be responsible for the subsequent reduction in phagocytic activity. While focusing on actin cytoskeleton reorganization, we detected blebs. In order to confirm that blebs are not an artifact of fixation (Fig. 4) we also stained the membranes of live cells (Fig. 5). Bleb boundaries could be clearly detected in live and fixed cells and thus not an artifact of fixation. In the presence of LA, microglia formed blebs at a higher number as compared to other conditions. Further studies need to be done to understand the mechanics and regulation of bleb formation.
The mechanisms by which LA alters microglial inflammatory responses is not fully known. LA possibly has multiple effects on microglia, including inhibition of phagocytosis (Fig. 2), reorganization of actin (Fig. 3), prevention of upregulation of inducible nitric oxide synthase and inhibition of Akt/glycogen synthase kinase-3ß (Wong et al. 2001; Koriyama et al. 2013). Other anti-inflammatory drugs like benfotiamine have been shown to inhibit activation and alters cell morphology in the microglial cell line, BV-2, by inducing reorganization of F-actin cytoskeleton (Bozic et al. 2015). Oxidative stress influences many different cellular functions and is known to effect cytoskeleton organization (Valdivia et al. 2015) that may lead to changes in the plasma membrane and in the formation of blebs.
It is unclear whether invading macrophages or microglia or both clear the myelin in MS lesions due to the lack of specific identification markers (O’Loughlin et al. 2018). The ability for microglia to phagocytose alters with the release of various mediators of inflammation, thus microenvironment may play a role in microglial activation. Microglial activation is pronounced in normal appearing white matter of MS patients and increases with disease duration (Zrzavy et al. 2017). Active lesions contain microglia with pro-inflammatory phenotype, expressing molecules involved in phagocytosis and oxidative injury while in inactive lesions, the density of microglia/macrophages is reduced. Here, we demonstrate that LA has significant effects on microglia that may in part explain the therapeutic benefit of LA in EAE and potentially MS. Further investigation into the mechanisms through which LA alters microglial function is warranted.
Supplementary Material
Supplementary Fig. 1.
Distribution patterns of anti CD68 and galectin-3 in cultured microglial cells Top panel a,b,c -LPS/IFN-γ stimulated cells and bottom panel d,e,f -LPS/IFN-γ stimulated cells with LA 25 μg/ml. a, d Anti CD68 green; b, e CD68 is shown in orange; overlay c,f. Scale bar 10 μm.
Highlights.
Lipoic acid (LA) affects microglial phagocytosis and this may in part explain the therapeutic benefit of LA in experimental autoimmune encephalomyelitis and potentially multiple sclerosis.
LA causes changes in microglial cell size, membrane organization and actin
Acknowledgements
VA Portland Health Care System Biomedical Laboratory Research and Development, NIH R01 NS057433, NMSS Grant CA1055A, and the Laura Fund for Innovation in MS Research. We would like to express our thanks to Stefanie Kaech Petrie from the Advanced Light Microscopy Core (P30 NS061800) Facility at the Oregon Health & Science University and Jack Wiedrick from OHSU Biostatistics & Design Program (partially supported by UL1TR002369 [OHSU CTSA]) for data analysis expertise.
Footnotes
Potential Conflicts of Interest: Nothing to report.
Publisher's Disclaimer: This is a PDF file of an unedited manuscript that has been accepted for publication. As a service to our customers we are providing this early version of the manuscript. The manuscript will undergo copyediting, typesetting, and review of the resulting proof before it is published in its final citable form. Please note that during the production process errors may be discovered which could affect the content, and all legal disclaimers that apply to the journal pertain.
References
- 1.Abd-El-Basset E, Fedoroff S. 1995. Effect of bacterial wall lipopolysaccharide (LPS) on morphology, motility, and cytoskeletal organization of microglia in cultures. J Neurosci Res. 41(2):222–237. [DOI] [PubMed] [Google Scholar]
- 2.Abd-El-Basset EM, Prashanth J, Ananth Lakshmi KV. 2004. Up-regulation of cytoskeletal proteins in activated microglia. Med Princ Pract. 13(6):325–333. [DOI] [PubMed] [Google Scholar]
- 3.Bozic I, Savic D, Laketa D, Bjelobaba I, Milenkovic I, Pekovic S, Nedeljkovic N, Lavrnja I. 2015. Benfotiamine attenuates inflammatory response in LPS stimulated BV-2 microglia. PLoS One. 10(2):e0118372. doi: 10.1371/journal.pone.0118372. eCollection 2015. [DOI] [PMC free article] [PubMed] [Google Scholar]
- 4.Chaudhary P, Marracci GH, Bourdette DN. 2006. Lipoic acid inhibits expression of ICAM-1 and VCAM-1 by CNS endothelial cells and T cell migration into the spinal cord in experimental autoimmune encephalomyelitis. J Neuroimmunol. 175(1–2):87–96. Epub 2006 Apr 27. [DOI] [PubMed] [Google Scholar]
- 5.Chaudhary P, Marracci G, Yu X, Galipeau D, Morris B, Bourdette D. 2011. Lipoic acid decreases inflammation and confers neuroprotection in experimental autoimmune optic neuritis. J Neuroimmunol. 233(1–2):90–96. doi: 10.1016/j.jneuroim.2010.12.002. Epub 2011 Jan 7. [DOI] [PMC free article] [PubMed] [Google Scholar]
- 6.Chastain EM, Duncan DS, Rodgers JM, Miller SD. 2011. The role of antigen presenting cells in multiple sclerosis. Biochim Biophys Acta. 1812(2):265–274. doi: 10.1016/j.bbadis.2010.07.008. Epub 2010 Jul 15. Review. [DOI] [PMC free article] [PubMed] [Google Scholar]
- 7.Huizinga R, van der Star BJ, Kipp M, Jong R, Gerritsen W, Clarner T, Puentes F, Dijkstra CD, van der Valk P, Amor S. 2012. Phagocytosis of neuronal debris by microglia is associated with neuronal damage in multiple sclerosis. Glia. 60(3):422–431. doi: 10.1002/glia.22276. Epub 2011 Dec 9. [DOI] [PubMed] [Google Scholar]
- 8.Insall RH, Machesky LM. 2009. Actin dynamics at the leading edge: from simple machinery to complex networks. Dev Cell. 17(3):310–322. doi: 10.1016/j.devcel.2009.08.012. Review. [DOI] [PubMed] [Google Scholar]
- 9.Jack C, Ruffini F, Bar-Or A, Antel JP. 2005. Microglia and multiple sclerosis. J Neurosci Res. 81(3):363–373. Review. [DOI] [PubMed] [Google Scholar]
- 10.Klegeris A, McGeer PL. 2001. Inflammatory cytokine levels are influenced by interactions between THP-1 monocytic, U-373 MG astrocytic, and SH-SY5Y neuronal cell lines of human origin. Neurosci Lett 313(1–2):41–44. [DOI] [PubMed] [Google Scholar]
- 11.Koriyama Y, Nakayama Y, Matsugo S, Sugitani K, Ogai K, Takadera T, Kato S. 2013. Anti-inflammatory effects of lipoic acid through inhibition of GSK-3β in lipopolysaccharide-induced BV-2 microglial cells. Neurosci Res. 77(1–2):87–96. doi: 10.1016/j.neures.2013.07.001. Epub 2013 Jul 24. [DOI] [PubMed] [Google Scholar]
- 12.Lassmann H 2014. Mechanisms of white matter damage in multiple sclerosis. Glia. 62(11):1816–1830. doi: 10.1002/glia.22597. Epub 2014 Jan 28. Review. [DOI] [PubMed] [Google Scholar]
- 13.Marracci GH, Jones RE, McKeon GP, Bourdette DN. 2002. Alpha lipoic acid inhibits T cell migration into the spinal cord and suppresses and treats experimental autoimmune encephalomyelitis. J Neuroimmunol. 131(1–2):104–114. [DOI] [PubMed] [Google Scholar]
- 14.May RC, Machesky LM. 2001. Phagocytosis and the actin cytoskeleton. J Cell Sci. 114 (Pt 6):1061–1077. Review. [DOI] [PubMed] [Google Scholar]
- 15.Mishra MK, Yong VW. 2016. Myeloid cells - targets of medication in multiple sclerosis. Nat Rev Neurol. 12(9):539–551. doi: 10.1038/nrneurol.2016.110.Epub 2016 Aug 12. Review. [DOI] [PubMed] [Google Scholar]
- 16.Mitchison TJ, Cramer LP. 1996. Actin-based cell motility and cell locomotion. Cell. 84(3):371–379. Review. [DOI] [PubMed] [Google Scholar]
- 17.Morini M, Roccatagliata L, Dell’Eva R, Pedemonte E, Furlan R, Minghelli S, Giunti D, Pfeffer U, Marchese M, Noonan D, Mancardi G, Albini A, Uccelli A. 2004. Alpha-lipoic acid is effective in prevention and treatment of experimental autoimmune encephalomyelitis. J Neuroimmunol. 148(1–2):146–153. [DOI] [PubMed] [Google Scholar]
- 18.Mosley K, Cuzner ML. 1996. Receptor-mediated phagocytosis of myelin by macrophages and microglia: effect of opsonization and receptor blocking agents. Neurochem Res. 21(4):481–487. [DOI] [PubMed] [Google Scholar]
- 19.Moussaud S, Draheim HJ. 2010. A new method to isolate microglia from adult mice and culture them for an extended period of time. J Neurosci Methods. 187(2):243–253. doi: 10.1016/j.jneumeth.2010.01.017. Epub 2010 Jan 25. [DOI] [PubMed] [Google Scholar]
- 20.O’Loughlin E, Madore C, Lassmann H, Butovsky O. (2018) Microglial Phenotypes and Functions in Multiple Sclerosis. Cold Spring Harb Perspect Med. 8(2). pii: a028993. doi: 10.1101/cshperspect.a028993. Review. [DOI] [PMC free article] [PubMed] [Google Scholar]
- 21.Paluch EK, Raz E. 2013. The role and regulation of blebs in cell migration. Curr Opin Cell Biol. 25(5):582–590. doi: 10.1016/j.ceb.2013.05.005. Epub 2013 Jun 17. Review. [DOI] [PMC free article] [PubMed] [Google Scholar]
- 22.Rawji KS, Yong VW. 2013. The benefits and detriments of macrophages/microglia in models of multiple sclerosis. Clin Dev Immunol. 2013:948976. doi: 10.1155/2013/948976. Epub 2013 Jun 12. Review. [DOI] [PMC free article] [PubMed] [Google Scholar]
- 23.Reichert F, Rotshenker S. (2019) Galectin-3 (MAC-2) Controls Microglia Phenotype Whether Amoeboid and Phagocytic or Branched and Non-phagocytic by Regulating the Cytoskeleton. Front Cell Neurosci. 13:90. doi: 10.3389/fncel.2019.00090. eCollection 2019. [DOI] [PMC free article] [PubMed] [Google Scholar]
- 24.Smith ME, van der Maesen K, Somera FP. 1998. Macrophage and microglial responses to cytokines in vitro: phagocytic activity, proteolytic enzyme release, and free radical production. J Neurosci Res. 54(1):68–78. [DOI] [PubMed] [Google Scholar]
- 25.Spain R, Powers K, Murchison C, Heriza E, Winges K, Yadav V, Cameron M, Kim E, Horak F, Simon J, Bourdette D. 2017. Lipoic acid in secondary progressive MS: A randomized controlled pilot trial. Neurol Neuroimmunol Neuroinflamm. 4(5):e374. doi: 10.1212/NXI.0000000000000374. eCollection 2017 Sep. [DOI] [PMC free article] [PubMed] [Google Scholar]
- 26.van der Goes A, Brouwer J, Hoekstra K, Roos D, van den Berg TK, Dijkstra CD. 1998. Reactive oxygen species are required for the phagocytosis of myelin by macrophages. J Neuroimmunol. 92(1–2):67–75. [DOI] [PubMed] [Google Scholar]
- 27.Wang KC, Tsai CP, Lee CL, Chen SY, Lin GJ, Yen MH, Sytwu HK, Chen SJ. 2013. Α-Lipoic acid enhances endogenous peroxisome-proliferator-activated receptor-γ to ameliorate experimental autoimmune encephalomyelitis in mice. Clin Sci (Lond). 125(7):329–340. doi: 10.1042/CS20120560. [DOI] [PubMed] [Google Scholar]
- 28.Wong A, Dukic-Stefanovic S, Gasic-Milenkovic J, Schinzel R, Wiesinger H, Riederer P, Münch G. 2001. Anti-inflammatory antioxidants attenuate the expression of inducible nitric oxide synthase mediated by advanced glycation endproducts in murine microglia. Eur J Neurosci. 14(12):1961–1967. [DOI] [PubMed] [Google Scholar]
- 29.Wulf E, Deboben A, Bautz FA, Faulstich H, Wieland T. 1979. Fluorescent phallotoxin, a tool for the visualization of cellular actin. Proc Natl Acad Sci U S A. 76(9):4498–4502. [DOI] [PMC free article] [PubMed] [Google Scholar]
- 30.Valdivia A, Duran C, San Martin A. 2015. The role of Nox-mediated oxidation in the regulation of cytoskeletal dynamics. Curr Pharm Des. 21(41):6009–6022. Review. [DOI] [PMC free article] [PubMed] [Google Scholar]
- 31.Zrzavy T, Hametner S, Wimmer I, Butovsky O, Weiner HL, Lassmann H. 2017. Loss of ‘homeostatic’ microglia and patterns of their activation in active multiple sclerosis. Brain. 140(7):1900–1913. doi: 10.1093/brain/awx113. [DOI] [PMC free article] [PubMed] [Google Scholar]
Associated Data
This section collects any data citations, data availability statements, or supplementary materials included in this article.
Supplementary Materials
Supplementary Fig. 1.
Distribution patterns of anti CD68 and galectin-3 in cultured microglial cells Top panel a,b,c -LPS/IFN-γ stimulated cells and bottom panel d,e,f -LPS/IFN-γ stimulated cells with LA 25 μg/ml. a, d Anti CD68 green; b, e CD68 is shown in orange; overlay c,f. Scale bar 10 μm.


