

Abstract
Major depressive disorder is a heterogeneous disease involving widespread disruptions in functional brain networks, the neurobiological mechanisms of which are poorly understood. Amassing evidence supports innate immune activation as one pathophysiologic mechanism contributing to depression in a subgroup of patients with elevated inflammatory markers. Although inflammation is known to alter monoamine and glutamate neurotransmitters, little work has been done to understand its role in network dysfunction in patients with depression. Here we conducted a large-scale network-based analyses of resting-state functional magnetic resonance imaging (rfMRI) data acquired from depressed patients with varying levels of inflammation to develop a comprehensive characterization of network alterations as an effect of inflammation. Complementary approaches of global brain connectivity and parcellation-based network analysis applied to the whole brain revealed that increased plasma C-reactive protein (CRP) was associated with reduced functional connectivity in a widely-distributed network including ventral striatum, parahippocampal gyrus/amygdala, orbitofrontal and insular cortices, and posterior cingulate cortex. These broad alterations were centralized in the ventral medial prefrontal cortex (vmPFC), representing a hub for the effects of inflammation on network function in the whole brain. When feeding the identified multivariate network features into a machine learning algorithm of support vector regression, we achieved high prediction accuracies for depressive symptoms that have been associated with inflammation in previous studies including anhedonia and motor slowing. These findings extend and broaden previous observations from hypothesis-driven studies, providing further support for inflammation as a distinct contributing factor to network dysfunction and symptom severity in depression.
Keywords: depression, functional connectivity, inflammation, C-reactive protein, resting-state functional magnetic resonance imaging, ventral medial prefrontal cortex
1. Introduction
Depression is a devastating illness with social, personal, and global health consequences, affecting 322 million people worldwide (WorldHealthOrganization, 2017). While current pharmacological therapies are effective for many patients, more than 30% fail to achieve remission, and even responders exhibit significant residual symptoms such as anhedonia, a core symptom of depression that reflects a lack of motivation (Dunlop and Nemeroff, 2007; Rush et al., 2006; Trivedi et al., 2008; Vrieze et al., 2014). Development of new therapies for depression has been hindered by a fundamental lack of knowledge of the pathophysiological pathways that drive circuit dysfunction and contribute to individual differences in the severity of difficult-to-treat symptoms like anhedonia. Therefore, new conceptual frameworks integrating established neurobiological alterations with neural network changes are needed to better understand and personalize the treatment of major depressive disorder (MDD).
Relevant in this regard, one pathophysiological pathway thought to contribute to symptoms of depression is inflammation (Chamberlain et al., 2018; Felger and Treadway, 2017; Miller et al., 2017). A significant proportion of patients with MDD are reliably found to exhibit increased inflammatory markers in both the periphery and central nervous system, as measured by inflammatory cytokines and acute phase reactants such as C-reactive protein (CRP) (Dantzer et al., 2008; Felger et al., 2018; Shelton et al., 2011; Zunszain et al., 2013). Elevated CRP and other peripheral blood markers of inflammation have also been found to predict future development of depression (Au et al., 2015; Gimeno et al., 2009; Wium-Andersen et al., 2013), and to be associated with resistance to standard antidepressant therapies (Cattaneo et al., 2013; Cattaneo et al., 2016; Chamberlain et al., 2018; Haroon et al., 2018b; Strawbridge et al., 2015). Furthermore, administration of inflammatory stimuli and cytokines induces depressive symptoms, particularly those related to reduced motivation and motor slowing (Capuron et al., 2012; Eisenberger et al., 2010; Harrison et al., 2009a), and anti-inflammatory treatments have been effective in reducing such symptoms in patients with high inflammation (Kohler et al., 2014; Miller et al., 2017; Raison et al., 2013). Indeed, exogenous administration of cytokines (e.g. interferon-alpha) or cytokine inducers (e.g. endotoxin or typhoid vaccine), either as therapy in patients with medical illnesses or in laboratory experiments in healthy controls, respectively, has been shown to impact neural activation and functional connectivity (FC) in corticostriatal and limbic circuits that are altered in MDD (Capuron et al., 2012; Eisenberger et al., 2010; Harrison et al., 2009a; Harrison et al., 2016; Inagaki et al., 2012). Moreover, mechanistic work in humans and laboratory animals suggests that these inflammation-induced changes in circuit function are due to cytokine effects on dopaminergic and glutamatergic neurotransmission, especially in corticostriatal pathways, which correlate with symptoms of reduced motivation and motor slowing (Capuron et al., 2012; Felger et al., 2013; Felger et al., 2015; Haroon et al., 2015; Haroon et al., 2016).
Our recent work indicates that endogenous systemic inflammation, which can be increased by stress, trauma, aging, diet, obesity, and sedentary lifestyle, may similarly affect the brain to contribute to corticostriatal and limbic circuit dysfunction and symptom severity in MDD (Felger et al., 2016; Felger, 2018; Mehta et al., 2018; Miller et al., 2017). Using resting-state functional magnetic resonance imaging (rfMRI), we recently reported that medically-stable and medication free MDD patients with increased plasma CRP and inflammatory cytokine concentrations exhibited decreased FC within corticostriatal reward and motor circuits in association with anhedonia and motor slowing (Felger et al., 2016). However, this hypothesis-driven analysis was restricted to circuits relevant to the neurotransmitter pathways and behaviors known to be affected by peripheral inflammation, thus more widespread consequences of these effects on broadly distributed networks have yet been characterized (Leisman et al., 2014; Salamone et al., 2016). Without considering inflammation, network-based approaches have uncovered dysfunction across large-scale functional networks in MDD. For example, Sheline et al. reported increased FC across key regions of the cognitive control network (CCN), default mode network (DMN) and affective network (AN) in MDD patients compared to controls; and this increased FC overlapped in a hub region in the dorsal medial prefrontal cortex (dmPFC) termed the “dorsal nexus” (DN) (Sheline et al., 2010). More recent approaches such as global brain connectivity analysis (GBCA), which derives the mean of each voxel’s time series correlation with every other voxel in the brain, have revealed hubs of altered FC in MDD in ventral regions of the mPFC (Wu et al., 2016), or in both mPFC and lateral PFC (Murrough et al., 2016). However, whether inflammation contributes to these patterns or whether it is associated with a unique signature of network dysfunction in MDD is unknown.
To gain a more comprehensive understanding of how inflammation impacts functional brain networks to contribute to symptom severity, we analyzed rfMRI data acquired from patients with MDD and varying levels of inflammation using network-based strategies. Consistent with our previous studies (Felger et al., 2016; Haroon et al., 2018a; Mehta et al., 2018), and because higher levels of plasma CRP predicted increased concentrations of inflammatory cytokines and their soluble receptors in both plasma and cerebrospinal fluid of patients with MDD (Felger et al., 2018), plasma concentrations of CRP were used to determine the effects of inflammation on network function by identifying significant correlations with FC features across participants. First, we employed complementary approaches of voxel-wise GBCA (Murrough et al., 2016) and parcellation-based network analysis (PBNA) (Chen et al., 2018; Chen et al., 2019; Craddock et al., 2012) to identify hub regions where variations in FC with other brain regions were associated with inflammation (plasma CRP). Second, a follow-up analysis was conducted to explore relationships between high inflammation and FC within key regions of the CCN, DMN, and AN as well as the DN, the region identified to represent a joint network effect in MDD, as reported by (Sheline et al., 2010). Based on our previous work revealing decreased FC between subcortical structures and ventral medial (vm) PFC in association with inflammation (Felger et al., 2016; Mehta et al., 2018), we hypothesized that the hub region for inflammation would be identified in ventral rather than dorsal regions of mPFC, and that this ventral hub would exhibit decreased FC with extensively distributed cortical and limbic regions as a function of increasing CRP. Finally, we examined whether the identified FC network features predicted inflammation-related symptoms of anhedonia and motor slowing using a machine-learning algorithm of support vector regression (SVR) (Dosenbach et al., 2010; Drucker et al., 1996).
2. Materials and Methods
2.1. Participants
Forty-four participants (Table 1) were recruited from a parent study on phenotyping depression with increased inflammation (ClinicalTrials.gov ). They were a subsample from our previous studies of n=48 (Felger et al., 2016; Mehta et al., 2018) with 4 participants excluded due to more rigorous data censoring (Power et al., 2014). Among these 4 participants, 3 were excluded for more than 15% of time points censored (see preprocessing methods below) and 1 for more than 2.5mm of max pairwise displacement in motion parameters. Specific criteria for participant inclusion were described previously (Felger et al., 2016). Briefly, all participants had a primary diagnosis of major depressive disorder or bipolar disorder current episode depressed (n=2), as determined by Structured Clinical Interview for Diagnostic and Statistical Manual-IV-TR. Participants were free of psychotropic medications (e.g. antidepressants, mood stabilizers, antipsychotics, stimulants, sedative hypnotics, and benzodiazepines) for at least 4 weeks (8 weeks for fluoxetine). Participants were also free of medications known to affect the immune system including nonsteroidal or steroidal anti-inflammatories, statins or angiotensin-II receptor inhibitors, and were tested for drugs of abuse at screening and on the day of the scan. Medications for other medical conditions were allowed as dictated by the patients’ treating physicians, although patients were required to be medically stable as determined by medical history, physical exam and laboratory testing (Felger et al., 2016). Participants with evidence of active infections were excluded until medically stable. CRP was measured over 2-4 screening visits spaced 1-4 weeks apart to ensure stable levels of inflammation (values within 25% of each other on two occasions) and to rule out infection. All procedures were approved a priori by the Institutional Review Board of Emory University. All participants provided written informed consent according to the Declaration of Helsinki.
Table 1.
Demographic and clinical variables of the study sample, and their relationship to the peripheral inflammation as measured by plasma CRP.
| Variable | Mean (s.d.) (n=44) | Correlation with CRP (R) | P-value* |
|---|---|---|---|
| Demographic | |||
| Age (years) | 38.0 (11.0) | −0.10 | 0.511 |
| Sex, Male (n, %) | 13 (29.5) | −0.152 | 0.352 |
| Race | |||
| Caucasian (n, %) | 16(36.4) | −0.155 | 0.316 |
| African American (n, %) | 28 (63.6) | ||
| Smoking status, yes (n, %) | 8 (18.2) | −0.06 | 0.699 |
| BMI (kg m−2) | 30.8 (7.5) | 0.65 | <0.001 |
| Clinical | |||
| IDS-SR | 36(8.0) | 0.22 | 0.15 |
| IDS-SR-Anhedonia | 4.8 (1.9) | 0.289 | 0.057 |
| SHAPS | 5.6 (2.9) | 0.225 | 0.142 |
| TMT-A | 33.5 (14.7) | 0.28 | 0.065 |
| FIT | 39.9 (9.9) | −0.302 | 0.046 |
| Inflammatory | |||
| CRP (mg l−1) | 2.2 (2.4) | NA | NA |
Abbreviations: IDS-SR-Anhedonia, anhedonia subscale of the Inventory of Depressive Symptomatology-Self-Report; BMI, Body Mass Index; CRP, C-reactive protein; IDS-SR, Inventory of Depressive Symptomatology, Self-Report; SHAPS, Snaith-Hamilton Pleasure Scale; TMT-A, Trail Making Test Part A; FTT, Finger Tapping Test; NA, not applicable
P-value for the correlation with CRP.
2.2. Plasma CRP
Blood was collected for batched analysis of plasma high-sensitivity (hs) CRP as described (Felger et al., 2016). The immunoturbidometric method was used to measure hsCRP concentrations with a Beckman AU480 chemistry analyzer (Beckman Coulter, Brea, CA, USA) and Ultra WR CRP kit (Sekisui Diagnostics, San Diego, CA, USA).
2.3. Behavioral assessments
As with our previous work, symptom severity for anhedonia and psychomotor slowing was assessed using two scales to probe anhedonia and two tests measuring psychomotor retardation (Felger et al., 2016). The anhedonia subscale of the Inventory of Depressive Symptomatology-Self-Report (Rush et al., 1996) (IDS-SR-Anhedonia; including items #8 response of mood to good or desired events, #19 general interest in people and activities, and #21 capacity for pleasure) (Ameli et al., 2014; Felger et al., 2016; Haroon et al., 2016; Haroon et al., 2018a) and the Snaith-Hamilton Pleasure Scale (SHAPS) (Snaith et al., 1995) were used to assess participants’ severity scores for anhedonia. Motor speed was assessed using the Finger Tapping Test (FTT) as the number of taps/trial (dominant hand) (Spreen and Strauss, 1991), and psychomotor processing speed was measured as the time to complete the Trail Making Test-A (TMT-A) (Shindo et al., 2013).
2.4. MRI data acquisition
MRI scans were performed on a 3T Siemens Magnetom Trio scanner (Siemens, Malvern, PA, USA) with a 20-channel head coil at the Emory-GaTech BME Biomedical Imaging Technology Center. Anatomic images were acquired using a T1-weighted, magnetization prepared rapid gradient echo sequence (TR=2300 ms, TE=3.02 ms, FOV=256×256 mm2, FA=8°, voxel size=1×1×1 mm3). Resting-state (wakeful with eye fixation) fMRI data were acquired with a Z-SAGA gradient echo sequence (Heberlein and Hu, 2004) for recovering ventral-frontal signal losses due to field inhomogeneity (TR=2950 ms, TE1/TE2=30/67 ms, FOV=220×220 mm2, flip angle=90°, volumes=150, voxel size=3.4×3.4×4 mm3).
2.5. Preprocessing of rfMRI data
Analysis of rfMRI data was conducted with AFNI (http://afni.nimh.nih.gov/). Preprocessing steps included outlier detection (~5.5 times median absolute deviation), despiking, slice timing correction, motion correction, anatomy-to-functional image co-registration, nuisance signal (head motion parameters and derivatives, cerebral spinal fluid, and white matter) regression, band pass filtering (0.009<f<0.08 Hz) and 5 mm full-width half-maximum spatial smoothing. Time points with more than 10% of voxels as temporal outliers as well as with excessive head motion (frame displacement>0.3 mm) were excluded (also referred to as censoring or scrubbing) from the subsequent FC analysis (Power et al., 2014). Excluded time points were less than 23 (15%) in all the 44 participants analyzed. After the preprocessing pipeline, individual’s 4D fMRI data were transformed into the standard MNI space. Of note, global signal regression (GSR) was not used in the present preprocessing due to potential artifacts and biases it may introduce (Saad et al., 2012; Yang et al., 2014). However, our new analysis strategy of Bayesian multilevel modeling (as described below) pools effects shared across different regions thus does take global variations into account in the model. In other words, GSR was somewhat considered implicitly in the present analysis and global FC variation was statistically controlled.
2.6. Statistical Analyses
Descriptive variables for demographic and clinical information were processed with the IBM SPSS® software platform (https://www.ibm.com/analytics/spss-statistics-software), and their associations with inflammation were assessed with Pearson correlation with CRP. Statistical analyses involving imaging data are described below.
2.6.1. Global brain connectivity analysis (GBCA)
For GBCA, FC maps were derived by voxel-wise correlation between the time course of each voxel and the time courses of all the other voxels in the brain. GBC was computed as the mean of each voxel’s FC value with all other voxels in the brain (Murrough et al., 2016). All correlation coefficients were transformed to Fisher’s Z-scores (0.5*ln((1+r)/(1-r))) before group level analysis. At the group level, voxel-wise Z-sores were correlated with individual CRP values for assessment of the effect of inflammation. The resultant statistical map was corrected for multiple comparisons using Monte-Carlo simulations implemented in AFNI’s 3dClustSim with the spatial smoothness estimated by a spatial auto-correlation function (Cox et al., 2017).
2.6.2. Parcellation-based network analysis (PBNA)
The PBNA was used as a complementary approach to further confirm and provide additional information regarding network change in hubs identified by GBCA. This method complemented the GBCA because of (i) its higher signal to noise ratio due to signal averaging within regions of interest (ROIs); (ii) its direct assessment of inter-regional FCs, so potential cancellations between positive and negative FCs were avoided; and more importantly, (iii) its improved statistical efficiency with a novel Bayesian multilevel (BML) modeling (Chen et al., 2018; Chen et al., 2019). The PBNA involved two steps. First, a data-driven method of spatially constrained spectral clustering was used to parcellate the brain into ROIs based on rfMRI signal homogeneity. Second, BML was implemented to explore associations between FC and plasma CRP.
For obtaining sample-specific ROIs with minimized intraregional homogeneity and maximized interregional independence, the whole brain was parcellated into 100 regions with a data-driven approach of spatially constrained spectral clustering (Craddock et al., 2012) implemented in pyClusterROI (http://ccraddock.github.io/cluster_roi). Based on “normalized cut spectral clustering” (NCUT) (Shi and Malik, 2000), this approach classified brain voxels based on their signals’ temporal similarity at the individual level; then derived the group-level parcellation by applying NCUT again to the adjacency matrix averaged across participants. Compared with atlases derived from anatomical or cyto-architectonic parcellations, ROIs thus defined directly from rfMRI exhibited higher functional homogeneity and reproducibility (Craddock et al., 2012). At the end of this parcellation, preprocessed rfMRI signals were extracted from each ROI and a symmetric connectivity matrix of 100×100 was obtained individually by pairwise signal correlation across these ROIs.
Investigation of the relationship with CRP was performed by BML implemented in AFNI with the following ROI-based formulation (Chen et al., 2018; Chen et al., 2019).
where zijk is the Fisher-transformed z-score that reflects the signal similarity between the ith and the jth ROIs of the kth participant; xk is the kth participant’s CRP level; πk is the effect attributable to the kth participant; a = (a0,a1), bi = (b0i,b1i); a0, b0i, and b0j are the overall and region-specific effect while a1, b1i, and b1j are the overall and region-specific CRP effect; i, j = 1, 2, …, 100, k = 1,2, …, 44. With a Gaussian assumption for cross-subjects’ variability πk and a bivariate Gaussian assumption for both a and bi, the BML was analyzed, with the 100×100 connectivity matrix from the 44 participants as input, through Bayesian inferences implemented in Stan (http://mc-stan.org). Besides the integrative consideration of all ROIs simultaneously in a single step (thus alleviating the burden of multiple comparison), this model also decomposes CRP effect on connectivity values between the ith and jth ROI into a linear combination of (b1ixk + b1jxk), so that b1i and b1j represent summarized (hub) CRP effect across all connections at the ith and jth ROI. These nodal measures of the “hub” effect were used to rank their FC association with CRP.
2.6.3. Exploring associations between CRP and FC within three brain networks and the “dorsal nexus”
The dorsal nexus (DN) was previously reported in patients with MDD as a region exhibiting increased FC with key regions of three major functional networks, the CCN, DMN and AN (Sheline et al., 2010). To explore potential inflammation effects in the same framework, bilateral seeds for dorsolateral prefrontal cortex (dlPFC, ±36, 27, 29, probing CCN), precuneus (pCu, ±7, −60, 21, probing DMN), subgenual anterior cingulate cortex (sgACC, ±10, 35, −2, probing AN), and the DN (left −24, 35, 28, right 18, 34, 29, probing the joint effect), as reported by Sheline et al. (Sheline et al., 2010), were used to examine FC alterations in these networks as a function of increasing CRP. These seeding regions were spheres (r=5 mm) drawn at the listed coordinates, and CRP correlations were subsequently performed in each functional network probed by these seeds. This part of the analysis was performed in the Talairach space in which the coordinates were originally reported.
2.6.4. Behavioral prediction with support vector regression (SVR)
The SVR algorism (Drucker et al., 1996) implemented in LibSVM (https://www.csie.ntu.edu.tw/~cjlin/libsvm) was used for prediction of the behavioral measurements of IDS-SR-Anhedonia, SHAPS, FTT, and TMT-A described above. Predictions were performed with FC features derived from GBCA, BPNA, or a combination of features from both analyses. To control for potential confounding factors, variance contributions from age, body mass index (BMI), gender, race, smoking status, and CRP were regressed out of the FC features before they were entered into the SVR.
A specific model of epsilon-SVR was used with a kernel of radial basis function (RBF) (Dosenbach et al., 2010). In this procedure, the two SVR parameters of C and γ were estimated by heuristic grid searching in the training data with a 5-fold cross validation. The software’s default searching parameters were used with log2C ranging from −5 to 15 in steps of 2, and log2γ ranging from 3 to −15 in steps of −2.
The prediction performance of SVR was assessed by an iterative procedure of leave-one-out cross validation (LOOCV). In 44 iterations, each participant took turns being designated as the testing sample and the remaining participants as the training sample. A decision function was derived from the training sample, and this function was used to predict the behavioral score of the testing participant. At the end of these LOOCV folds, the coefficient of determination (R2) was calculated measuring the proportion of variance in the true scores explained by the predicted score; or in other words, the prediction accuracy.
To identify FC features with the strongest prediction of behavioral scores, the LOOCV was wrapped with another outer loop of recursive feature elimination (RFE). It recursively eliminates the least useful FC feature, and a prediction R2 was calculated upon each elimination. This procedure identified for each behavioral score an FC set that maximized the prediction accuracy. In each one of such FC sets, individual features were also ranked by the degradation of R2 had that feature been removed from the set. A greater degradation indicates a higher contribution, thus a higher rank for an FC feature. For each behavioral score predicted, the associated FC feature set was visualized by BrainNet Viewer (https://www.nitrc.org/projects/bnv/).
Statistical significance of each prediction was assessed by permutation tests, in which the mapping of participants’ IDs and their behavioral scores were randomized 1000 times. The empirical cumulative distribution of R2 under the null hypothesis was estimated with these surrogate data; and the significance of the original accuracy was determined by its position in this null distribution.
3. Results
3.1. Patients characteristics
Patients’ characteristics are summarized in Table 1. There were significant or marginally significant correlations between inflammation, as assessed by CRP, and measurements of body mass index (BMI), anhedonia, and psychomotor retardation (Table 1).
3.2. Association between plasma CRP and network function revealed by global brain connectivity analysis (GBCA)
In GBCA, the mean of each voxel’s FC value with every other voxel in the brain was derived, providing a voxel-wise measure of global brain connectivity (Murrough et al., 2016). When correlating this global FC with CRP values in each voxel, we observed a significant negative correlation in the vmPFC (1032 mm3, centroid MNI coordinates: −5, 31, −1; Fig.1). To identify specific regions contributing to the negative correlation between global FC and CRP, a 2nd level connectivity analysis was performed by seeding in this exact cluster of vmPFC (Fig.1A) followed by voxel-wise correlations again with CRP. This analysis revealed that plasma CRP was associated with decreased FC between the vmPFC and a broad distribution of 22 brain regions shown in Fig.2 and Table 2. Identified clusters involved two notable regions found to be directly sensitive to the effects of inflammation on neurotransmitters and neural activity in previous works from our group and others, including ventral portions of the striatum (bilateral lentiform nucleus/putamen) (Capuron et al., 2012; Felger et al., 2016; Harrison et al., 2016) and the insula (Eisenberger et al., 2009; Harrison et al., 2009b; Harrison et al., 2016). Additional regions showing decreased FC with the vmPFC in association with increased CRP included medial, orbital, and dorsolateral (dl) regions of PFC, as well as temporal and associative cortices (e.g. lingual gyrus, temporal gyrus, postcentral gyrus, precuneus, and cingulate cortex). These findings support the idea that high CRP reflects changes in inflammation-sensitive brain regions that converge in vmPFC as a hub which influences FC across a broad range of temporal, insular and associative cortices that coordinate complex cognitive and emotional processes (Hiser and Koenigs, 2018).
Fig.1.
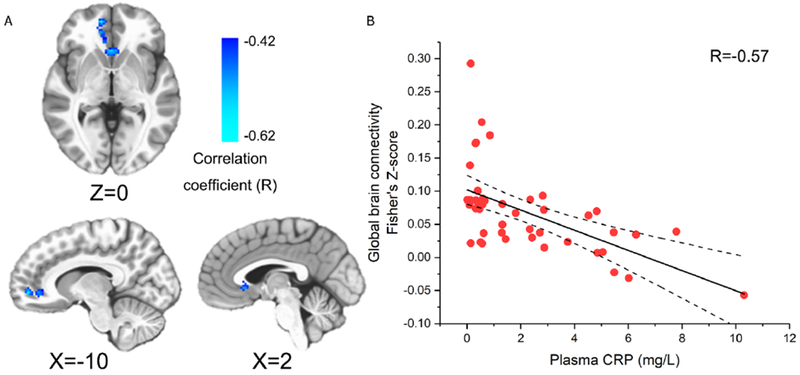
The ventral medial prefrontal cortex (vmPFC) identified by global brain connectivity analysis (GBCA). Plasma C-reactive protein (CRP) was negatively correlated with global brain connectivity in the vmPFC cluster (voxel-wise P<0.002 + 696 mm3 cluster; P<0.05 corrected) with its anatomical location and CRP correlation shown in (A) and (B), respectively.
Fig.2.
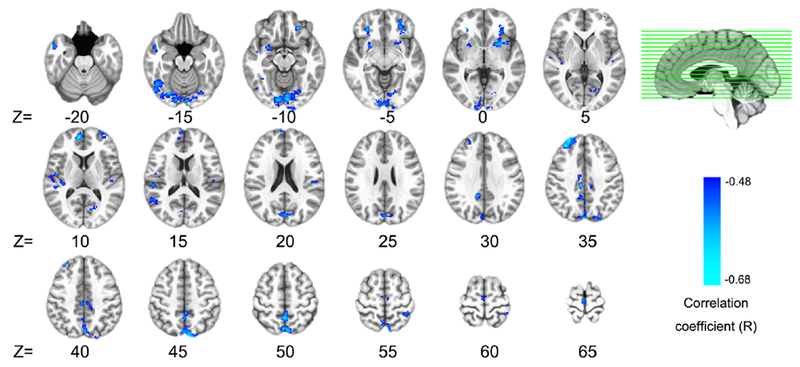
Inflammation effects identified by the seed of ventral medial prefrontal cortex (vmPFC). Plasma C-reactive protein (CRP) was negatively correlated (voxel-wise P<0.001 + 366 mm3 cluster, P<0.05 corrected) with functional connectivity between the vmPFC and 22 broadly distributed brain regions. Detailed information (anatomical label, volume, MNI coordinates, and CRP correlation) for each cluster identified are listed in Table 2.
Table 2.
Twenty-two brain regions identified to exhibit decrease FC with the vmPFC (as identified by GBCA) that was negatively correlated with plasma CRP.
| Regions | Volume (mm3) | MNI Coordinates | Correlation with CRP (R)* |
|---|---|---|---|
| lingual gyrus (BA18) | 7168 | 2, −85, −23 | −0.669 |
| precuneus (BA7) | 6760 | −1, −72, 36 | −0.712 |
| right middle frontal gyrus (BA9) | 1752 | 26, 40, 39 | −0.691 |
| right fusiform gyrus (BA37) | 1424 | 45, −60, −24 | −0.638 |
| left middle frontal gyrus | 1296 | −28, 36, −6 | −0.735 |
| right medial frontal gyrus (BA10) | 1048 | 7, 54, 16 | −0.614 |
| left lentiform nucleus/putamen | 1040 | −25, 10, −6 | −0.640 |
| right lentiform nucleus/putamen | 824 | 27, 4, −10 | −0.629 |
| right transverse temporal gyrus (BA41) | 824 | 53, −28, 8 | −0.594 |
| right middle temporal gyrus (BA21) | 792 | 51, 5, −22 | −0.603 |
| left cingulate gyrus (BA31) | 744 | −9, −36, 38 | −0.626 |
| right cingulate gyrus (BA31) | 736 | 6, −29, 35 | −0.677 |
| right medial frontal gyrus (BA6) | 712 | 1, −26, 62 | −0.584 |
| left middle frontal gyrus | 664 | −32, 58, 11 | −0.585 |
| right insula (BA13) | 664 | 42, −21, 6 | −0.611 |
| right inferior frontal gyrus | 656 | 30, 32, −6 | −0.619 |
| left posterior cingulate cortex (BA30) | 536 | −17, −70, 0 | −0.606 |
| left precuneus (BA19) | 496 | −20, −89, 30 | −0.594 |
| left postcentral gyrus (BA5) | 416 | −39, −51, 54 | −0.562 |
| right superior temporal gyrus | 384 | 54, −57, 10 | −0.573 |
| left insula (BA13) | 376 | −49, −24, 10 | −0.577 |
| left lingual gyrus (BA17) | 368 | −9, −101, −14 | −0.593 |
These correlations are all statistically significant with P<0.001. CRP, C-reactive protein; GBCA, Global Brain Connectivity Analysis; vmPFC, ventral medial prefrontal cortex
3.3. Association between plasma CRP and network function by parcellation-based network analysis (PBNA)
To further examine patterns of altered network FC, and confirm vmPFC as a hub for the relationship between CRP and global FC, PBNA was conducted by parcellating the brain into 100 spatially coherent ROIs (Craddock et al., 2012) (supplementary Fig.1 and supplementary Table 1) and the resultant connectivity matrices were correlated with plasma CRP through BML (Chen et al., 2018; Chen et al., 2019). The BML pooled variations shared between connections into one integrative model, thus simultaneously enhancing robustness of the results and alleviating the burden of correction for multiple comparisons. At the 95% quantile interval of the posterior distribution, this approach identified 63 connections that were all negatively correlated with plasma CRP (Fig.3 and supplementary Table 2). These paths linked 47 ROIs in a network with the greatest effect of CRP observed in the vmPFC (Fig.3, the primary hub region in green; MNI coordinate of the ROI center: −1, 32, −14). Interestingly and similar to our previous findings (Felger et al., 2016; Mehta et al., 2018), these 47 ROIs included hub regions in basal ganglia (Fig.3, ventral anterior caudate hubs in cyan; ROI# 63 and 89, with left caudate as the 2nd ranked ROI hub), as well as in right parahippocampal gyrus (ROI# 61), which exhibited decreased FC with both vmPFC and left caudate (Fig.3).
Fig.3.
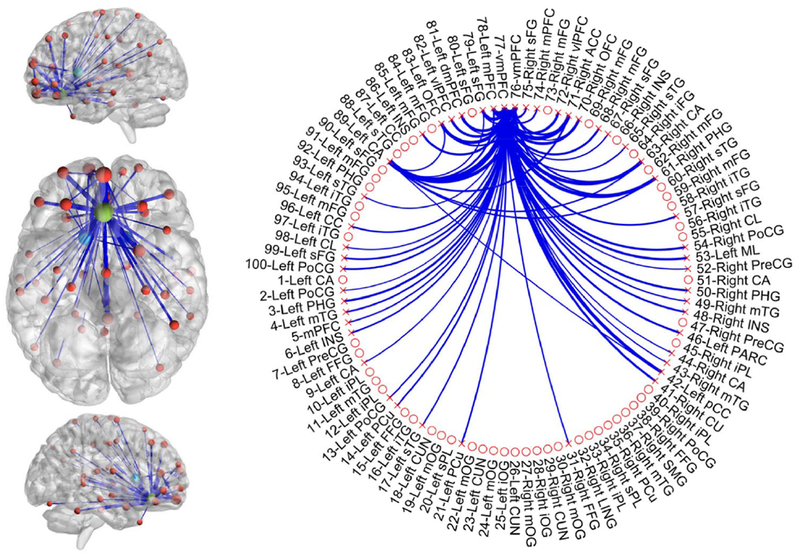
The network identified by the parcellation-based network analysis (PBNA). Negative associations (at the 95% quantile interval) with plasma C-reactive protein (CRP) were identified in 63 connections involving 47 unique regions. In the overlay of identified regions onto the anatomical template (left), the thickness of linking edges and size of balls encode relative associations between inflammation and functional connectivity (FC) within the different paths and nodes, respectively. The ventral view of the brain was enlarged for better visualization of the identified primary and secondary hubs, respectively, in ventral medial prefrontal cortex (vmPFC; shown in green) and bilateral ventral anterior caudate (shown in cyan). In the circular visualization (right), all the 100 ROIs/nodes are shown. The 47 identified regions are marked with an “x” and features of reduced FC (the 63 connections) are represented by blue lines. MNI coordinates and anatomical labels for each node are listed in Supplementary Table 2.
As BML is a newly developed method (Chen et al., 2018; Chen et al., 2019), we further validated our findings with a more commonly used approach of “network-based statistics” (NBS) (Zalesky et al., 2010). The NBS also identified negative correlations between plasma CRP and FC in a widely-distributed network centralized in vmPFC. However, NBS (i) does not directly assess nodal effects, (ii) needs additional thresholding, (iii) involves massive univariate modeling (thus being less efficient and more sensitive to noise), and (iv) was less accurate in the subsequent prediction of behavior for 3 out of 4 symptom scores. Therefore, we focused on BML results for prediction of behavior (see below) and the NBS methods and results are described in detail in the supplementary material (supplementary Methods, supplementary Fig.2, supplementary Table 3, 4, 5).
3.4. Associations between plasma CRP and seed-based FC with three brain networks and the “dorsal nexus”
To further examine the uniqueness of the ventral hub we identified in vmPFC for the relationship with inflammation, this analysis explored possible relationships with CRP by seeding directly in the DN, as well as in key regions of the other three networks, pCu (probing DMN), dlPFC (probing CCN), and sgACC (probing AN), using previously published coordinates (Sheline et al., 2010) (supplementary Fig.3). Similar to the results from GBCA and PBNA, significant negative correlations between CRP and FC were revealed between the sgACC and 8 clusters including ventral regions of bilateral striatum (Fig.4, supplementary Table 6). However, no significant correlation between CRP and FC were observed for seeds in pCu and dlPFC, or for the seed in the DN.
Fig.4.
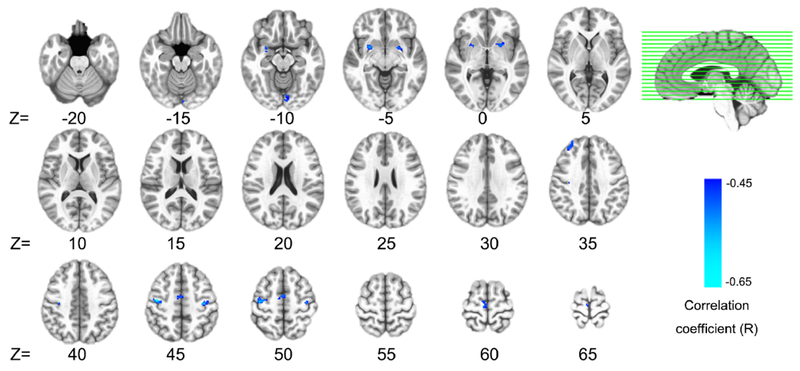
Inflammation effects identified by the seed of subgenual anterior cingulate cortex (sgACC). Plasma C-reactive protein (CRP) was negatively correlated (voxel-wise P<0.001 + 376 mm3 cluster, P<0.05 corrected) with functional connectivity between the sgACC and 8 widely distributed clusters. Detailed information (anatomical label, volume, MNI coordinates, and CRP correlation) for each cluster identified are listed in Supplementary Table 6.
Considering that the DN reported by Sheline et al. (Sheline et al., 2010) could vary in location for different patient samples, and to verify that the absence of a relationship between CRP and FC with the DN was not due to inconsistent seed localization, we also conducted an “iterative seed optimization” to individually optimize the DN location for maximizing its inter-subject FC consistency (Zhu et al., 2013) (Supplementary Methods and Supplementary Fig.4). However, despite this individually optimized seed location, a significant correlation with CRP was still not identified for the DN.
3.5. Prediction of anhedonia and motor slowing by inflammation-associated FC features identified with GBCA and PBNA
One of the primary advantages of network characterization is the potential for improved prediction of clinical features and symptom severity (Drysdale et al., 2017; Van Essen and Barch, 2015). Therefore, we examined the efficacy of multiple FC features identified by the GBCA (22 FC features; Fig.3 and Table 2) and PBNA (63 FC features; Fig.3 and Supplementary Table 2) to predict symptom severity related to anhedonia (IDS-SR-Anhedonia and SHAPS) and motor slowing (FTT and TMT-A). FC features from GBCA and PBNA were considered both separately and jointly in the SVR and prediction accuracies are reported as coefficients of determination (R2) in Table 3. For the symptom scores for IDS-SR-Anhedonia, SHAPS, and TMT-A, 16 (14 involving vmPFC), 19 (all involving vmPFC), and 7 (6 involving vmPFC) FC features from PBNA showed the highest R2 of 0.57, 0.67, and 0.53, respectively (Fig.5 and supplementary Table 7). For FTT, 4 (all involving vmPFC) FC features from GBCA and 11 (10 involving vmPFC) from PBNA combined generated the most predictive model (R2=0.49) (Fig.5 and Supplementary Table 7). All R2 values were significantly higher (P<0.001) than random prediction as assessed by permutation tests with the mapping between participant IDs and FC features randomized 1000 times. All final models included the corticostriatal hubs identified in our previous hypothesis-driven work (vmPFC and striatum; Fig.3, 5) (Felger et al., 2015), which when combined with the numerous additional FC features identified by the network-based approaches employed herein (e.g. vmPFC to claustrum, pCu and PCC) (Fig.5, Supplementary Table 7), high prediction accuracies for behavior were achieved (R2=0.49 to 0.67).
Table 3.
Prediction (R2) of anhedonia and motor-related symptom severity by FC features derived from the global brain connectivity analysis (GBCA), parcellation-based network analysis (PBNA), or both methods.
| FC Features | IDS-SR-Anhedonia | SHAPS | FTT | TMT-A |
|---|---|---|---|---|
| GBCA | 0.26 | 0.29 | 0.36 | 0.26 |
| PBNA | 0.57* | 0.67* | 0.33 | 0.53* |
| GBCA+PBNA | 0.41 | 0.64 | 0.49* | 0.35 |
IDS-SR-Anhedonia: anhedonia subscale of the Inventory of Depressive Symptomatology-Self-Report; SHAPS: the Snaith-Hamilton Pleasure Scale; FTT: Number of taps/trial (dominant hand) in the Finger Tapping Test; TMT-A: the time to complete Trail Making Test Part A.
Highest R2 in the prediction of each symptom
Fig.5.
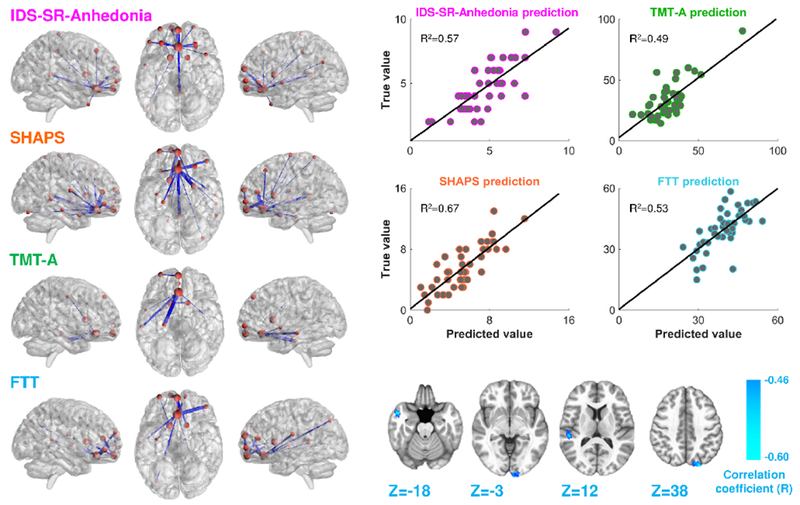
Results of the support vector regression (SVR) analysis. This analysis identified functional connectivity (FC) features that predicted symptom severity for anhedonia, IDS-SR-Anhedonia (pink labels) and SHAPS (orange labels); and motor slowing, scores for FTT (cyan labels) and TMT-A (green labels). FC features found to predict symptom severity (P<0.001) are depicted on anatomical templates (left) and prediction accuracies are represented by line plots of true vs. predicted scores (top right) for each participant. FC features from PBNA (left) significantly predicted IDS-SR-Anhedonia (16 features), SHAPS (19 features) and TMT-A (7 features), whereas a combination of features from both GBCA (4 features; bottom right) and PBNA (11 features; bottom left) were most predictive of FTT. IDS-SR-Anhedonia: anhedonia subscale of the Inventory of Depressive Symptomatology-Self-Report; FTT: Number of taps/trial (dominant hand) in the Finger Tapping Test; GBCA: global brain connectivity analysis; PBNA: parcellation-based network analysis; SHAPS: the Snaith-Hamilton Pleasure Scale; TMT-A: the time to complete Trail Making Test Part A.
4. Discussion
The present study examined the relationship between inflammation (based on plasma CRP concentrations) and resting-state FC in the entire brain in an MDD sample with varying levels of inflammation. The network-based analyses employed herein, GBCA and PBNA (Chen et al., 2018; Chen et al., 2019; Craddock et al., 2012; Murrough et al., 2016), used complementary but distinct approaches to uncover a widely-distributed network of decreased FC centered in vmPFC, which, together with striatum and a number of additional features, was highly predictive of anhedonia and psychomotor slowing. These findings largely confirmed hypotheses from a number of labs regarding the impact of inflammation on dopaminergic corticostriatal and corticolimbic circuits (Brydon et al., 2008; Capuron et al., 2012; Eisenberger et al., 2010; Felger et al., 2013; Harrison et al., 2009a; Harrison et al., 2016), and extended our previous hypothesis-driven findings in MDD patients with high inflammation that were restricted to specific circuits (Felger et al., 2016; Mehta et al., 2018). Results did, however, demonstrate that the data-driven approaches can both confirm a priori hypotheses based on pathophysiology while increasing power for predicting clinical features such as symptom severity (Drysdale et al., 2017; He et al., 2017; Van Essen and Barch, 2015). Together, our findings shed light on the heterogeneous nature of depression and suggested a distinct pathophysiology for inflammation, with the vmPFC serving as a hub for the impact of inflammation on FC changes that extend across broadly distributed networks.
The GBCA identified a primary hub of change in FC in the whole brain as a function of CRP in vmPFC. Second-level seeding of this exact vmPFC cluster identified decreased FC with 22 brain regions including ventral regions of bilateral lentiform nucleus/putamen, consistent with our previous findings of decreased FC between ventral striatum and vmPFC using seed-based analyses (Felger et al., 2016). With the power of the BML (and validation with NBS), PBNA confirmed the results from GBCA with a hub of decreased FC in vmPFC, and provided additional information about the global effect of decreased FC with this hub by identifying a network comprised of 66 features. Of relevance to our previous findings and constant with the seeding of the vmPFC cluster identified by GBCA, the left caudate was the 2nd ranked ROI for the nodal effect of inflammation (see Supplementary Table 1). Decreased FC of both the vmPFC and caudate to the right parahippocampal gyrus/amygdala was also observed (Fig.3), consistent with right amygdala to vmPFC connectivity that was found to correlate negatively with CRP in our previous targeted analyses (Mehta et al., 2018). Thus, the network-based analyses reported herein confirmed and supported our previous hypothesis-driven work but also extended previous findings by identifying new regions that are involved in the CRP-associated FC changes such as middle frontal gyrus, and inflammation-sensitive regions like insula (Harrison et al., 2009b; Harrison et al., 2016).
The subsequent seed-based analyses with key regions in established networks and the DN revealed decreased FC between the seed in the sgACC and eight other brain regions. The relationship between CRP and decreased connectivity with sgACC is consistent with a previous study examining task FC which revealed increased activity in sgACC and reduced FC between sgACC and the amygdala, mPFC, ventral striatum, and superior temporal sulcus in association with mood symptoms and cytokine release after inflammatory challenge with typhoid vaccine (Harrison et al., 2009a). Of note, the vmPFC region defined by GBCA and the sgACC region used for the seed-based network analysis (Sheline et al., 2010) were spatially adjacent with an overlap of 168 mm3; consequently, their respective correlation maps for associations between FC and CRP (Fig.2 and Fig.4) shared common features including bilateral putamen, right middle frontal gyrus, left lingual gyrus, and right medial frontal gyrus. However, compared with a simple seed of sgACC, the GBCA and BPNA proved more comprehensive and sensitive to whole-brain FC alterations that were associated with inflammation as additional FC features were identified. The reliance of seed-based analyses on one specific location may pose a limitation, particularly when knowledge of network alterations that are associated with inflammation in patients with MDD is lacking. Hence, we optimized the seed location for the DN reported in the dmPFC (Sheline et al., 2010) but still did not find an association between CRP and FC with this optimized DN region.
Although Sheline et al. (2010) reported the DN in the dmPFC as a dorsal hub of network changes for MDD, others have uncovered hubs in ventral regions of PFC. As mentioned in the introduction, using rfMRI and graph theory analysis, Wu et al. (2016) reported a hub of decreased FC in MDD patients localized ventrally in the sgACC (Wu et al., 2016). Additionally, Murrough et al. (2016) reported reduced GBC bilaterally within multiple regions of medial and lateral prefrontal cortex in MDD (Murrough et al., 2016). This heterogeneity in the location within PFC of identified hubs of FC in patients with MDD may be due to lack of consideration of subgroups of patients based on biomarkers linked to pathophysiological pathways like inflammation. The present study was unique in that it systematically examined the effects of inflammation on FC in patients with MDD and revealed relatively strong associations (R2=0.49 to 0.67) of these findings with symptom severity. The converging results of a hub of decreased FC in vmPFC from GBCA and PBNA, as well as the absence of a relationship with CRP in DN, suggest a distinct phenotype for MDD patients with high CRP, with the inflammation effect converging in ventral rather than dorsal regions of PFC. The DN may not be very sensitive to inflammation, and may be more relevant to depressive symptoms related to cognitive deficits and/or compulsive rumination (Sheline et al., 2010).
The finding of the primary hub of the inflammation effect in the vmPFC was consistent across the three methods employed, as were a number of the ROIs found to have decreased FC with this hub. The FC features found to predict anhedonia and motor slowing all contained the vmPFC and caudate (the 2 most significant hubs identified by PBNA); however, compared to our previous hypothesis-driven work focused exclusively on striatum and vmPFC, the additional FC features revealed here greatly increased the strength of associations with the symptom severity using the SVR. This multivariate regression approach, which exploited the connectomic patterns identified network analyses, is likely superior to univariate approaches for modeling behavior from neuroimaging findings in psychiatric patients (Van Essen and Barch, 2015). Although our results were consistent and powerful for behavioral prediction, some limitations exist. Only one sample was available; thus, both testing and training could not be performed on independent datasets. To overcome this limitation, a LOOCV strategy was used to model relationships between FC and behavior. Of note, two of the patients included in this study had bipolar depression (current episode depressed), and thus may have exhibited higher concentrations of CRP and/or more sever alterations in FC or behavior (Horsdal et al., 2017; Redlich et al., 2015). Removal of these two subjects did not affect the relationship between CRP and vmPFC to left putamen FC (r=−0.643, p<0.001 versus r=−0.640, p<0.001), a key finding from Table 2. The mean CRP concentrations and behavioral scores for these patients were also within 1 standard deviation of the mean for the group as a whole, indicating it was unlikely that these subjects biased the results found herein. Another limitation is that the study was not longitudinal. This and other cross-sectional neuroimaging studies have established relationships between MDD and inflammation (Felger et al., 2016; Haroon et al., 2018a; Mehta et al., 2018; Savitz et al., 2013) that can be used in future prospective studies aimed at developing novel treatment strategies that can be targeted to MDD patients with high inflammation (Miller et al., 2017).
5. Conclusions
A data-driven examination of large-scale brain networks herein revealed that inflammation was associated with disrupted functional connectivity in a widely-distributed connectome centralized in the ventral medial prefrontal cortex (vmPFC), which predicted anhedonia and motor slowing with high accuracies in MDD. Thus, the vmPFC may serve as a hub for the impact of inflammation on functional connectivity and a brain target for the development of novel antidepressant strategies.
Supplementary Material
Highlights.
We conducted data-driven analyses of the impact of inflammation on network function in depression
CRP was associated with decreased functional connectivity (FC) in a widely distributed network
The ventral medial prefrontal cortex served as a hub for the effect of CRP on FC
Other key hubs of decreased FC were striatal and limbic regions known to be affected by inflammation
High prediction accuracies of multiple FC features for anhedonia and motor slowing were revealed
Acknowledgments
This work was supported by funds from the National Natural Science Foundation of China (grant number 31671169, 31530031 to Z.L.) and (grant number 31800960 to L.Y.), the Shenzhen high-level overseas talents award (grant number 000099 to Z.L.), the National Institute of Mental Health (grant number R01MH109637, R21MH106904 to J.C.F., grant number R01MH087604, R25MH101079 to A.H.M., and grant number K23MH091254, R01MH107033 to E.H.), the Brain and Behavioral Research Foundation and Dana Foundation (grant number BBRF22296, CADF49143 to J.C.F.). In addition, the study was supported in part by Public Health Service Grants (grant number UL1TR000454 and KL2TR000455) from the Clinical and Translational Science Award program, and by the National Institute of Health/National Cancer Institute under award number P30CA138292.
Footnotes
Publisher's Disclaimer: This is a PDF file of an unedited manuscript that has been accepted for publication. As a service to our customers we are providing this early version of the manuscript. The manuscript will undergo copyediting, typesetting, and review of the resulting proof before it is published in its final citable form. Please note that during the production process errors may be discovered which could affect the content, and all legal disclaimers that apply to the journal pertain.
Competing interests
All authors declare no conflicts of interest. In the past 12 months, Dr. Felger has consulted for Otsuka on a topic unrelated to this research.
References
- Ameli R, et al. , 2014. SHAPS-C: the Snaith-Hamilton pleasure scale modified for clinician administration. PeerJ. 2, e429. [DOI] [PMC free article] [PubMed] [Google Scholar]
- Au B, et al. , 2015. The longitudinal associations between C-reactive protein and depressive symptoms: evidence from the English Longitudinal Study of Ageing (ELSA). Int J Geriatr Psychiatry. 30, 976–84. [DOI] [PubMed] [Google Scholar]
- Brydon L, et al. , 2008. Peripheral inflammation is associated with altered substantia nigra activity and psychomotor slowing in humans. Biological Psychiatry. 63, 1022–1029. [DOI] [PMC free article] [PubMed] [Google Scholar]
- Capuron L, et al. , 2012. Dopaminergic mechanisms of reduced basal ganglia responses to hedonic reward during interferon alfa administration. Arch Gen Psychiatry. 69, 1044–53. [DOI] [PMC free article] [PubMed] [Google Scholar]
- Cattaneo A, et al. , 2013. Candidate genes expression profile associated with antidepressants response in the GENDEP study: differentiating between baseline ‘predictors’ and longitudinal ‘targets’. Neuropsychopharmacology. 38, 377–85. [DOI] [PMC free article] [PubMed] [Google Scholar]
- Cattaneo A, et al. , 2016. Absolute Measurements of Macrophage Migration Inhibitory Factor and Interleukin-1-beta mRNA Levels Accurately Predict Treatment Response in Depressed Patients. International Journal of Neuropsychopharmacology. 19, 1–10. [DOI] [PMC free article] [PubMed] [Google Scholar]
- Chamberlain SR, et al. , 2018. Treatment-resistant depression and peripheral C-reactive protein. The British Journal of Psychiatry. 214, 11–19. [DOI] [PMC free article] [PubMed] [Google Scholar]
- Chen G, et al. , 2018. One Model to Rule Them All: An Integrative Approach to Matrix-Based Analyses in Neuroimaging Connectomics. bioRxiv. doi: 10.1101/459545 [DOI]
- Chen G, et al. , 2019. Handling Multiplicity in Neuroimaging through Bayesian Lenses with Multilevel Modeling. Neuroinformatics. doi: 10.1101/238998. [DOI] [PMC free article] [PubMed]
- Cox RW, et al. , 2017. FMRI Clustering in AFNI: False-Positive Rates Redux. Brain Connect. 7, 152–171. [DOI] [PMC free article] [PubMed] [Google Scholar]
- Craddock RC, et al. , 2012. A whole brain fMRI atlas generated via spatially constrained spectral clustering. Human Brain Mapping. 33, 1914–1928. [DOI] [PMC free article] [PubMed] [Google Scholar]
- Dantzer R, et al. , 2008. From inflammation to sickness and depression: when the immune system subjugates the brain. Nat Rev Neurosci. 9, 46–56. [DOI] [PMC free article] [PubMed] [Google Scholar]
- Dosenbach NU, et al. , 2010. Prediction of individual brain maturity using fMRI. Science. 329, 1358–61. [DOI] [PMC free article] [PubMed] [Google Scholar]
- Drucker H, et al. , 1996. Support vector regression machines, The MIT Press, Cambridge, Massachusetts. [Google Scholar]
- Drysdale AT, et al. , 2017. Resting-state connectivity biomarkers define neurophysiological subtypes of depression. Nat Med. 23, 28–38. [DOI] [PMC free article] [PubMed] [Google Scholar]
- Dunlop BW, Nemeroff CB, 2007. The role of dopamine in the pathophysiology of depression. Arch Gen Psychiatry. 64, 327–37. [DOI] [PubMed] [Google Scholar]
- Eisenberger NI, et al. , 2009. An fMRI study of cytokine-induced depressed mood and social pain: the role of sex differences. Neuroimage. 47, 881–90. [DOI] [PMC free article] [PubMed] [Google Scholar]
- Eisenberger NI, et al. , 2010. Inflammation-induced anhedonia: endotoxin reduces ventral striatum responses to reward. Biol Psychiatry. 68, 748–54. [DOI] [PMC free article] [PubMed] [Google Scholar]
- Felger JC, et al. , 2013. Chronic interferon-alpha decreases dopamine 2 receptor binding and striatal dopamine release in association with anhedonia-like behavior in nonhuman primates. Neuropsychopharmacology. 38, 2179–87. [DOI] [PMC free article] [PubMed] [Google Scholar]
- Felger JC, Hernandez CR, Miller AH, 2015. Levodopa reverses cytokine-induced reductions in striatal dopamine release. Int J Neuropsychopharmacol. 18, 1–5. [DOI] [PMC free article] [PubMed] [Google Scholar]
- Felger JC, et al. , 2016. Inflammation is associated with decreased functional connectivity within corticostriatal reward circuitry in depression. Molecular Psychiatry. 21, 1358–65. [DOI] [PMC free article] [PubMed] [Google Scholar]
- Felger JC, Treadway MT, 2017. Inflammation Effects on Motivation and Motor Activity: Role of Dopamine. Neuropsychopharmacology. 42, 216–241. [DOI] [PMC free article] [PubMed] [Google Scholar]
- Felger JC, 2018. Imaging the Role of Inflammation in Mood and Anxiety-related Disorders. Curr Neuropharmacol. 16, 533–558. [DOI] [PMC free article] [PubMed] [Google Scholar]
- Felger JC, et al. , 2018. What does plasma CRP tell us about peripheral and central inflammation in depression? Molecular Psychiatry. doi: 10.1038/s41380-018-0096-3. [DOI] [PMC free article] [PubMed] [Google Scholar]
- Gimeno D, et al. , 2009. Associations of C-reactive protein and interleukin-6 with cognitive symptoms of depression: 12-year follow-up of the Whitehall II study. Psychol Med. 39, 413–23. [DOI] [PMC free article] [PubMed] [Google Scholar]
- Haroon E, et al. , 2015. Age-related increases in basal ganglia glutamate are associated with TNF, reduced motivation and decreased psychomotor speed during IFN-alpha treatment: Preliminary findings. Brain Behav Immun. 46, 17–22. [DOI] [PMC free article] [PubMed] [Google Scholar]
- Haroon E, et al. , 2016. Conceptual convergence: increased inflammation is associated with increased basal ganglia glutamate in patients with major depression. Mol Psychiatry. 21, 1351–7. [DOI] [PMC free article] [PubMed] [Google Scholar]
- Haroon E, et al. , 2018a. Increased inflammation and brain glutamate define a subtype of depression with decreased regional homogeneity, impaired network integrity, and anhedonia. Transl Psychiatry. 8, 1–11. [DOI] [PMC free article] [PubMed] [Google Scholar]
- Haroon E, et al. , 2018b. Antidepressant treatment resistance is associated with increased inflammatory markers in patients with major depressive disorder. Psychoneuroendocrinology. 95, 43–49. [DOI] [PMC free article] [PubMed] [Google Scholar]
- Harrison NA, et al. , 2009a. Inflammation causes mood changes through alterations in subgenual cingulate activity and mesolimbic connectivity. Biol Psychiatry. 66, 407–14. [DOI] [PMC free article] [PubMed] [Google Scholar]
- Harrison NA, et al. , 2009b. Neural origins of human sickness in interoceptive responses to inflammation. Biol Psychiatry. 66, 415–22. [DOI] [PMC free article] [PubMed] [Google Scholar]
- Harrison NA, et al. , 2016. A Neurocomputational Account of How Inflammation Enhances Sensitivity to Punishments Versus Rewards. Biol Psychiatry. 80, 73–81. [DOI] [PMC free article] [PubMed] [Google Scholar]
- He H, et al. , 2017. Co-altered functional networks and brain structure in unmedicated patients with bipolar and major depressive disorders. Brain Structure and Function. 222, 4051–4064. [DOI] [PMC free article] [PubMed] [Google Scholar]
- Heberlein KA, Hu X, 2004. Simultaneous acquisition of gradient-echo and asymmetric spin-echo for single-shot z-shim: Z-SAGA. Magn Reson Med. 51, 212–6. [DOI] [PubMed] [Google Scholar]
- Hiser J, Koenigs M, 2018. The Multifaceted Role of the Ventromedial Prefrontal Cortex in Emotion, Decision Making, Social Cognition, and Psychopathology. Biol Psychiatry. 83, 638–647. [DOI] [PMC free article] [PubMed] [Google Scholar]
- Horsdal HT, et al. , 2017. C-reactive protein and white blood cell levels in schizophrenia, bipolar disorders and depression - associations with mortality and psychiatric outcomes: a population-based study. Eur Psychiatry. 44, 164–172. [DOI] [PubMed] [Google Scholar]
- Inagaki TK, et al. , 2012. Inflammation selectively enhances amygdala activity to socially threatening images. Neuroimage. 59, 3222–6. [DOI] [PMC free article] [PubMed] [Google Scholar]
- Kohler O, et al. , 2014. Effect of anti-inflammatory treatment on depression, depressive symptoms, and adverse effects: a systematic review and meta-analysis of randomized clinical trials. JAMA Psychiatry. 71, 1381–91. [DOI] [PubMed] [Google Scholar]
- Leisman G, Braun-Benjamin O, Melillo R, 2014. Cognitive-motor interactions of the basal ganglia in development. Frontiers in Systems Neuroscience. 8, 1–18. [DOI] [PMC free article] [PubMed] [Google Scholar]
- Mehta ND, et al. , 2018. Inflammation negatively correlates with amygdala-ventromedial prefrontal functional connectivity in association with anxiety in patients with depression: Preliminary results. Brain, Behavior, and Immunity. 73, 725–730. [DOI] [PMC free article] [PubMed] [Google Scholar]
- Miller AH, Haroon E, Felger JC, 2017. Therapeutic Implications of Brain-Immune Interactions: Treatment in Translation. Neuropsychopharmacology. 42, 334–359. [DOI] [PMC free article] [PubMed] [Google Scholar]
- Murrough JW, et al. , 2016. Reduced global functional connectivity of the medial prefrontal cortex in major depressive disorder. Human Brain Mapping. 37, 3214–3223. [DOI] [PMC free article] [PubMed] [Google Scholar]
- Power JD, et al. , 2014. Methods to detect, characterize, and remove motion artifact in resting state fMRI. Neuroimage. 84, 320–41. [DOI] [PMC free article] [PubMed] [Google Scholar]
- Raison CL, et al. , 2013. A Randomized Controlled Trial of the Tumor Necrosis Factor-alpha Antagonist Infliximab in Treatment Resistant Depression: Role of Baseline Inflammatory Biomarkers. Jama Psychiatry. 70, 31–41. [DOI] [PMC free article] [PubMed] [Google Scholar]
- Redlich R, et al. , 2015. Reward Processing in Unipolar and Bipolar Depression: A Functional MRI Study. Neuropsychopharmacology. 40, 2623–31. [DOI] [PMC free article] [PubMed] [Google Scholar]
- Rush AJ, et al. , 1996. The Inventory of Depressive Symptomatology (IDS): psychometric properties. Psychol Med. 26, 477–86. [DOI] [PubMed] [Google Scholar]
- Rush AJ, et al. , 2006. Acute and longer-term outcomes in depressed outpatients requiring one or several treatment steps: a STAR*D report. Am J Psychiatry. 163, 1905–17. [DOI] [PubMed] [Google Scholar]
- Saad ZS, et al. , 2012. Trouble at rest: how correlation patterns and group differences become distorted after global signal regression. Brain Connect. 2, 25–32. [DOI] [PMC free article] [PubMed] [Google Scholar]
- Salamone JD, et al. , 2016. Activational and effort-related aspects of motivation: neural mechanisms and implications for psychopathology. Brain. 139, 1325–1347. [DOI] [PMC free article] [PubMed] [Google Scholar]
- Savitz J, et al. , 2013. Inflammation and neurological disease-related genes are differentially expressed in depressed patients with mood disorders and correlate with morphometric and functional imaging abnormalities. Brain, Behavior, and Immunity. 31, 161–71. [DOI] [PMC free article] [PubMed] [Google Scholar]
- Sheline YI, et al. , 2010. Resting-state functional MRI in depression unmasks increased connectivity between networks via the dorsal nexus. Proc Natl Acad Sci U S A. 107, 11020–5. [DOI] [PMC free article] [PubMed] [Google Scholar]
- Shelton RC, et al. , 2011. Altered expression of genes involved in inflammation and apoptosis in frontal cortex in major depression. Mol Psychiatry. 16, 751–62. [DOI] [PMC free article] [PubMed] [Google Scholar]
- Shi JB, Malik J, 2000. Normalized cuts and image segmentation. Ieee Transactions on Pattern Analysis and Machine Intelligence. 22, 888–905. [Google Scholar]
- Shindo A, et al. , 2013. Trail making test part a and brain perfusion imaging in mild Alzheimer’s disease. Dement Geriatr Cogn Dis Extra. 3, 202–11. [DOI] [PMC free article] [PubMed] [Google Scholar]
- Snaith RP, et al. , 1995. A scale for the assessment of hedonic tone the Snaith-Hamilton Pleasure Scale. Br J Psychiatry. 167, 99–103. [DOI] [PubMed] [Google Scholar]
- Spreen O, Strauss E, 1991. A compendium of neuropsychological tests : administration, norms, and commentary, Oxford University Press, New York. [Google Scholar]
- Strawbridge R, et al. , 2015. Inflammation and clinical response to treatment in depression: A meta-analysis. Eur Neuropsychopharmacol. 25, 1532–43. [DOI] [PubMed] [Google Scholar]
- Trivedi MH, et al. , 2008. Clinical evidence and potential neurobiological underpinnings of unresolved symptoms of depression. J Clin Psychiatry. 69, 246–58. [DOI] [PubMed] [Google Scholar]
- Van Essen DC, Barch DM, 2015. The human connectome in health and psychopathology. World Psychiatry. 14, 154–7. [DOI] [PMC free article] [PubMed] [Google Scholar]
- Vrieze E, et al. , 2014. Dimensions in major depressive disorder and their relevance for treatment outcome. J Affect Disord. 155, 35–41. [DOI] [PMC free article] [PubMed] [Google Scholar]
- Wium-Andersen MK, et al. , 2013. Elevated C-reactive protein levels, psychological distress, and depression in 73, 131 individuals. JAMA Psychiatry. 70, 176–84. [DOI] [PubMed] [Google Scholar]
- WorldHealthOrganization, 2017. Depression and Other Common Mental Disorders: Global Health Estimates., Geneva: World Health Organization. [Google Scholar]
- Wu H, et al. , 2016. Changed Hub and Corresponding Functional Connectivity of Subgenual Anterior Cingulate Cortex in Major Depressive Disorder. Frontiers in Neuroanatomy. 10, 1–7. [DOI] [PMC free article] [PubMed] [Google Scholar]
- Yang GJ, et al. , 2014. Altered global brain signal in schizophrenia. Proc Natl Acad Sci U S A. 111, 7438–43. [DOI] [PMC free article] [PubMed] [Google Scholar]
- Zalesky A, Fornito A, Bullmore ET, 2010. Network-based statistic: identifying differences in brain networks. Neuroimage. 53, 1197–207. [DOI] [PubMed] [Google Scholar]
- Zhu D, et al. , 2013. DICCCOL: dense individualized and common connectivity-based cortical landmarks. Cereb Cortex. 23, 786–800. [DOI] [PMC free article] [PubMed] [Google Scholar]
- Zunszain P, Hepgul N, Pariante C, 2013. Inflammation and depression. Current Topics in Behavioral Neurosciences. 14, 135–151. [DOI] [PubMed] [Google Scholar]
Associated Data
This section collects any data citations, data availability statements, or supplementary materials included in this article.