

Abstract
Calcium phosphate cements (CPCs) have been extensively investigated as scaffolds in bone tissue engineering in light of their chemical composition closely resembling the mineral component of bone extracellular matrix. Yet, the degradation kinetics of many CPCs is slow compared to de novo bone formation. In order to overcome this shortcoming, the use of porogens within CPCs has been suggested as a potential strategy to increase scaffold porosity and promote surface degradation. This study explored the usage of glucose microparticles (GMPs) as porogens for the introduction of macroporosity within CPCs, and characterized the handling properties and physicochemical characteristics of CPCs containing GMPs. Samples were fabricated with four different weight fractions of GMPs (10, 20, 30, and 40%) and two different size ranges (100–150 μm and 150–300 μm), and were assayed for porosity, pore size distribution, morphology, and compressive mechanical properties. Samples were further tested for their handling properties – specifically, setting time and cohesiveness. Additionally, these same analyses were conducted on samples exposed to a physiological solution in order to estimate the dissolution kinetics of GMPs and its effect on the properties of the composite. GMPs were efficiently encapsulated and homogeneously dispersed in the resulting composite. Although setting times increased for GMP/CPC formulations compared to control CPC material, increasing the Na2HPO4 concentration in the liquid phase decreased the initial setting time to clinically acceptable values (i.e. <15 min). Incorporation of GMPs led to the formation of instant macroporosity upon cement setting, and encapsulated GMPs completely dissolved in three days, resulting in a further increase in scaffold porosity. However, the dissolution of GMPs decreased scaffold compressive strength. Overall, the introduction of GMPs into CPC resulted in macroporous scaffolds with good handling properties, as well as designer porosity and pore size distribution via selection of the appropriate size/weight fraction of GMPs. The data demonstrate that GMPs are promising porogens for the production of highly tunable porous CPC scaffolds.
Keywords: Calcium phosphate cement, Glucose, Porosity, Interconnectivity, Degradation, Mechanical properties
1. Introduction
Bone tissue is primarily composed of calcium phosphate crystals. Accordingly, calcium phosphate cement (CPC) has a chemical composition similar to that of the mineral component of the extracellular matrix within native bone, and has been extensively investigated within the fields of orthopedic surgery and dentistry [1–3]. CPC exhibits osteoconductive properties, as evidenced by the encouragement of osteoblast recruitment and adhesion on this class of materials [4,5]. Additionally, CPC can be readily injected and adapted to the shape of defects, making it ideal for filling complex bone defects such as those arising from maxillofacial injuries [6].
However, one of the drawbacks of most CPCs is their slow degradation rate, which delays the complete filling of the tissue defect with new bone ingrowth due to the maintenance of the CPC [7]. For apatitic CPCs, several studies have investigated strategies to harness and accelerate the degradation rate of CPCs by introducing macroporosity within the system [8–12]. These approaches mainly rely on incorporating pore-generating additives (porogens) in order to increase the surface area and therefore accelerate both active and passive degradation. Without the presence of interconnected macropores, biodegradation takes place solely via surface degradation, which is a relatively slow process [7]. As porous scaffolds have a higher surface area for cell attachment than non-porous scaffolds, this further facilitates de novo bone formation [13].
The generation of macroporosity within CPC has been achieved typically by three main approaches: (i) the integration of solid particles within the CPC that dissolve or degrade after setting, (ii) the addition of liquid droplets that can create pores after a mass transport phenomenon, or (iii) the formation of air bubbles during the setting period [14]. If the additive degrades at a faster rate than the CPC, a porous scaffold will be obtained. The additive must be biocompatible, not affect the CPC setting, and be easy to handle in the operating suite. Materials such as gelatin and poly(lactic-co-glycolic acid) (PLGA) have been extensively used as porogens within CPCs [8,11]. Gelatin is known for its excellent biocompatibility, but it has a slow degradation rate, ultimately resulting in a gelatin/CPC composite with slow degradation kinetics [15]. On the other hand, PLGA degrades into lactic acid and glycolic acid, which can be easily eliminated from the body. However, in vitro studies have shown that the complete erosion of PLGA microparticles within CPCs is not achieved for 8 weeks [16].
Carbohydrates represent a class of porogens that do not present the disadvantages of PLGA or gelatin. Sugars dissolve in aqueous solutions and allow for the generation of porosity within minutes [17,18]. Among other sugars, glucose is a naturally occurring metabolite that can be easily transported within cells. Allowing for natural elimination upon dissolution.
The objective of the current work was to investigate the potential use of glucose microparticles (GMPs) as fast-acting porogens for CPC and to characterize the effects of GMPs on the physicochemical and handling properties of the resulting GMP/CPC composite scaffolds. Composite formulations were prepared with different weight fractions and size ranges of GMPs. Handling properties (such as setting time and cohesion) for these formulations were determined according to ASTM standards. Furthermore, scaffolds fabricated from these formulations, following GMP dissolution, were analyzed for their morphology, pore interconnectivity and porogen loading efficiency using microcomputed tomography (μCT), thermogravimetric analysis (TGA), and also for their mechanical properties via compressive testing.
2. Materials and methods
2.1. Preparation of glucose microparticles and GMP/CPC composites
A quantity of 50g of glucose powder (D-(+)-glucose, Sigma-Aldrich, St. Louis, MO) was mixed with 10 Ml deionized water (ddH2O) and flash frozen. Following lyophilization, glucose microparticles (GMPs) of 100–150 μm and 150–300 μm in diameter were obtained through sieving. Sieved fractions of GMPs were then lyophilized overnight, purged with nitrogen, and stored in −20 °C freezers.
At the beginning of the experiment, GMPs were mixed with the CPC powder (100% αTCP, kindly provided by CAM Bioceramics B.V. (Leiden, the Netherlands) sieved at <150 μm) according to five different GMP/CPC weight ratios (0/100, 10/90, 20/80, 30/70, and 40/60). The resulting GMP/CPC mixture was then added to a 10 mL plastic syringe and subjected to vigorous shaking for 15 s (Silmat® mixing apparatus) to ensure a homogenous distribution of GMPs within the final composite.
Then, either a solution of 4 wt% Na2HPO4 (Sigma-Aldrich) with no glucose (unsaturated liquid) or a solution of 4 wt% Na2HPO4 saturated in glucose (saturated liquid, 0.909 g/mL glucose) was added at a liquid/powder weight ratio of 0.53 and vigorously shaken again for 25 s. The resulting cement paste was injected into Teflon molds (6 mm diameter, 12 mm height), after which samples were left to set at room temperature for 24 h and finally stored in a lyophilizer.
Samples (n = 6) were measured after setting and were found to have a height of 12.00 ±0.03 mm and a diameter of 5.96 ± 0.07 mm. Additionally, the density (n = 4) of the 0%-Sat and 40% 150–300 μm groups before and after setting were measured. 0%-Sat samples were found to have a density before and after setting of 2.3 ± 0.3 g/cm and 2.2 ± 0.1 g/cm3, respectively. Also, the 40% 150–300 μm samples had a density before and after setting of 1.8 ± 0.1 g/cm3 and 1.7 ± 0.2 g/cm3, respectively.
2.2. Setting time
The initial and final setting times were assessed using a Gillmore needle (ASTM C266 [19]). The initial setting time point was determined to be the first time when the initial Gillmore needle was not able to mark the specimen with a complete circular indentation, while the final setting time was determined to be the first time when the final setting needle did not mark the specimen. Cement pastes were mixed and injected into Teflon molds (6 mm in diameter, 12 mm in height) in a retrograde fashion, after which the initial and final setting time of the samples was determined as described by ASTM C266 (n = 3). Both wt% GMP in the GMP/CPC mixture and 4, 8, 16, and 24wt% Na2HPO4 in the solution were used as variables for the assessment of setting times. When water is the liquid component, the setting reaction for αTCP is described by Eq. (1) [20]:
| (1) |
2.3. In vitro degradation
For the degradation studies, each sample (6 mm in diameter, 12 mm height) was incubated in 1.5 mL of phosphate-buffered saline (PBS, pH 7.4) at 37 °C in a warm room on a shaker table (rpm 90; n = 4). The pH of the solution was measured after 3, 7, 14, 28, 42, and 56 days. At each time point the PBS solution was replaced.
2.4. Cohesive properties
For the determination of cohesive properties, GMP/CPC composites were mixed and injected into circular molds (6 mm diameter, 3 mm height), and allowed to set for 0 min, 3 min, 6 min or 9 min, similarly to previous investigations [21,22]. The molds were removed and the samples were then fully submerged into 15 mL of PBS at 37 °C. During this time, it was observed whether the cement retained its original shape or disintegration occurred.
2.5. Porogen loading efficiency
The porogen loading efficiency of GMP/CPC composites was determined with thermogravimetric analysis (TGA; n = 3). Samples were fabricated with cylindrical Teflon molds that were 6 mm in diameter and 12 mm in height. They were subsequently crushed in a mortar and pestle, and the resulting powder was placed inside platinum TGA pans. Samples were heated at a rate of 10 °C/min under a nitrogen environment until 450 °C, at which point oxygen was introduced into the system. The percent weight remaining was recorded. The mass remaining in the TGA pan was attributed to the amount of αTCP in the samples, since αTCP does not thermally degrade below 450 °C, thereby quantifying the amount of GMPs within the composites.
2.6. Porogen leaching
Composite scaffolds (6 mm diameter and 12 mm height) were placed into 50 mL of PBS (pH 7.4) and incubated at 37 °C on a shaker table (90 rpm) for 72 h. Every 12 h sample buffer was refreshed. Finally, samples were vacuum-dried and analyzed via TGA, microcomputed tomography and mechanical testing.
2.7. Porosity and interconnectivity
Scaffold porosity and pore interconnectivity were analyzed using microcomputed tomography (μCT) as previously described [22]. Briefly, samples (n = 4) from all experimental groups were scanned using a SkyScan 1172 μCT imaging system (SkyScan, Aartselaar, Belgium). High-resolution 1280 × 1024 pixel images were created by scanning at an 8 μm/pixel resolution with no filter at voltage and current settings of 40 kV and 250 mA, respectively. Serial tomograms were reconstructed, resliced, and analyzed using NRecon and CTAn software packages provided by SkyScan. For porosity and pore interconnectivity analyses, the scanned object volumes were binarized using a global threshold of 90–255. Porosity and interconnectivity were determined using a 5-mm-diameter × 4-mm-height cylindrical volume of interest to eliminate edge effects. Pore interconnectivity was determined by repeatedly applying a shrink-wrap algorithm with minimum interconnection sizes ranging from 12 to 96 μm. Interconnectivity is reported as the percentage of pore volume accessible from outside the volume of interest, with pores considered accessible only if the interconnection to that pore allowed spheres with a diameter of defined minimum interconnection size to pass through.
2.8. Mechanical testing
Dried samples (6 mm diameter, 12 mm height) were placed in a mechanical testing bench (858 MiniBionixII®, MTS Corp., Eden Prairie, MN), and the compressive strength and compressive modulus along the height of the specimens (parallel to the long axis of the samples) were measured with a crosshead speed of 0.5 mm/ min.
2.9. Morphology analysis
The morphology of the GMP/CPC composites was evaluated by scanning electron microscopy before and after leaching in 37 °C PBS solution for 72 h. The samples were mounted on aluminum stubs using carbon tape and sputter coated with gold before examination.
2.10. Phase composition analysis
X-ray diffraction (XRD; Philips PW3710, The Netherlands) was used to analyze the effect of the GMPs on the crystallographic composition of the αTCP powders and the transition into hydroxyapatite (HA). CPC samples were prepared as described in Section 2.1, either or not incubated in ddH2O for 72 h (to allow for transition of αTCP into HA), dried at physiological temperature, and finally crushed with a mortar to obtain powder. Powder XRD was performed with a CuKα radiation source having a wavelength of 1.54 A at a voltage of 40 kV and a current of 30 mA. Furthermore, Fourier transform infrared spectroscopy (FTIR; Perkin Elmer, The Netherlands) was used to further assess the presence of functional groups in the materials.
2.11. Statistical analysis
Continuous data are expressed as means ± 95% confidence interval. Statistical analysis was performed using a two-way ANOVA test followed by Tukey’s honestly significant difference post hoc test. Differences were considered significant for p < 0.05.
3. Results
3.1. Setting time and cohesion
As seen in Fig. 1, the simple use of a solution of 4% Na2HPO4 saturated in glucose (group 0%-Sat) increased both the initial and the final setting time compared to the control CPC group (0%-Unsat). However, the further introduction of GMPs tended to decrease the initial and final setting times. Irrespective of the size range selected, higher fraction of GMPs led to decreased initial and final setting times (Fig. 1A). When the concentration of Na2HPO4 in the liquid phase was increased from 4% to 24% (Fig. 1B) the initial setting time decreased from 122 ±18 to 17±4 min for the 0%-Unsat group respectively. In addition, it was shown that increasing the concentration of Na2HPO4 does not lead to crystallographic changes (Figs. S5 and S6).
Fig. 1.
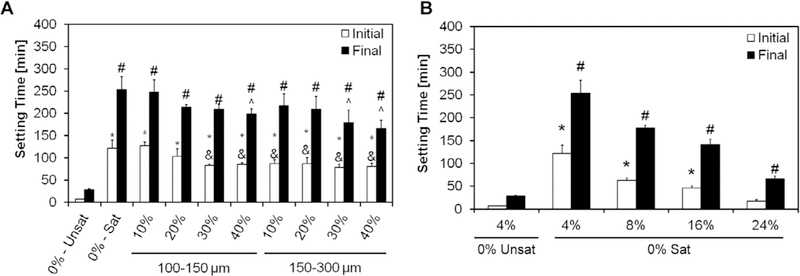
A) Initial and final setting times with 4% Na2HPO4 for the different formulations investigated. 0%-Unsat represents the control CPC group, while 0%-Sat involves the use of solution saturated in glucose. GMPs were further introduced in the formulations according to two size ranges (100–150 and 150–300 μm) and four weight fractions (10,20, 30, and 40%). Within the initial setting time series, * and & denote significance with respect to 0%-Unsat and 0%-Sat groups, respectively. In the final setting time series, # and ^ denote significance with respect to 0%-Unsat and 0%-Sat groups, respectively (n = 4, P < 0.05). In both series the error bars represent the 95% confidence interval. The introduction of a saturated liquid phase increases both the initial and final setting times compared to the unsaturated controls. Increasing concentrations of GMPs did not affect the setting times. B) Effect of increasing the Na2HPO4 concentration in the liquid phase on the initial and the final setting times for the 0%-Sat groups. Within the initial setting time series, * denotes significance with respect to 0%-Unsat, while in the final setting time series # denoted significance with respect to 0%-Unsat (n = 4, P < 0.05). In both panels the error bars represent the 95% confidence interval.
GMP/CPC pastes (i.e. the formulations before setting occurs) were then tested for their cohesiveness in aqueous solution after 0 and 3 min in order to assess the injectability of these composites and their ability to set in a physiological environment. As shown in Fig. 2, the addition of the glucose-saturated liquid did not affect the cohesiveness of CPC, as both groups 0%-Unsat and 0%-Sat did not disintegrate when injected into an aqueous environment. However, composite groups with GMPs at 10 and 20% failed to maintain their shape at 3 min. Increased weight fractions of GMPs (>30%) improved the cohesive properties compared to the non-saturated controls and maintained the CPC’s shape upon initial injection.
Fig. 2.
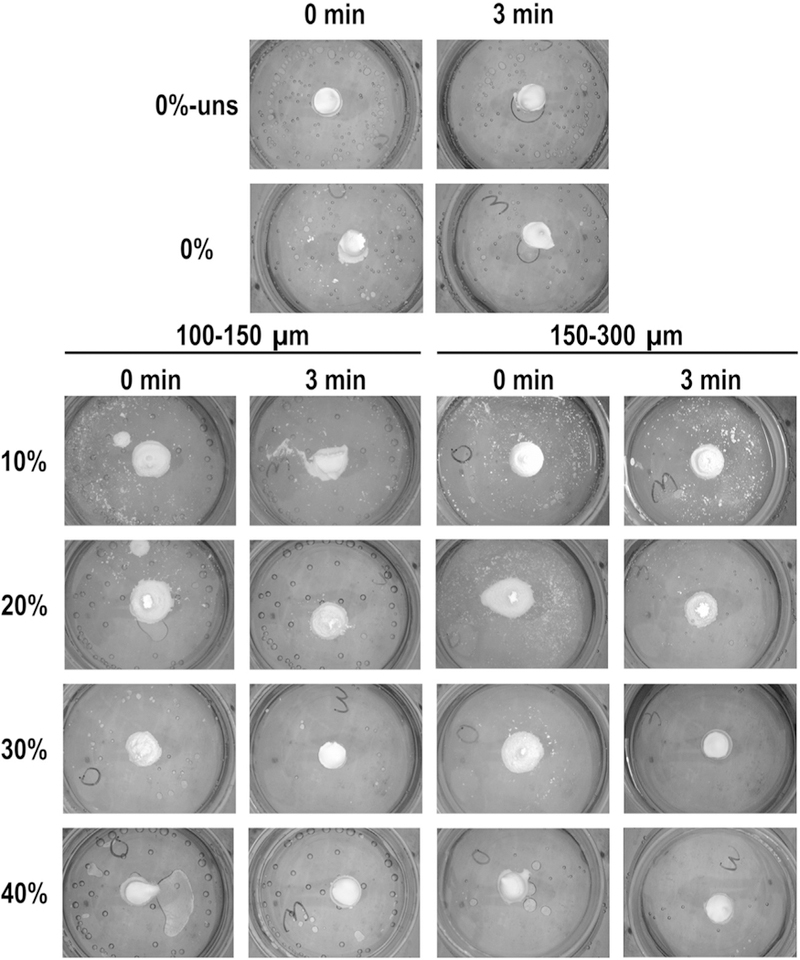
Evaluation of cohesive properties for the different formulations investigated. 0%-Unsat represents the control CPC group, while 0%-Sat involves the use of a solution saturated in glucose. GMPs were further introduced in the formulations according to two size ranges (100–150 and 150–300 μm) and four weight fractions (10, 20, 30, and 40%). For all formulations, samples were allowed to set for either 0 or 3 min before being injected in aqueous solution at 37 °C. As weight fraction of GMPs increased the cohesiveness of the composites increased, as seen by fewer white particles and maintained geometry.
3.2. Porogen loading efficiency and porogen teaching
Samples were then tested for encapsulation efficiency of GMPs in the cement via thermogravimetric analysis, as shown in Fig. 3. As seen in Fig. S1, glucose completely decomposes between 150 and 450 °C. Oxygen was introduced into the system at 450 °C resulting in the combustion of the remaining carbon. On the contrary, αTCP has minimal loss over this temperature range. Since the ceramic phase does not decompose over the temperature range we used, the change in mass can be attributed to the amount of glucose present in each sample. The use of glucose-saturated curing solution allowed for approximately 25% of the constructs to be composed of glucose (group 0%-Sat). Higher weight fractions of GMPs resulted in cements with larger percentages of glucose, with negligible effects from the size range (p < 0.05).
Fig. 3.
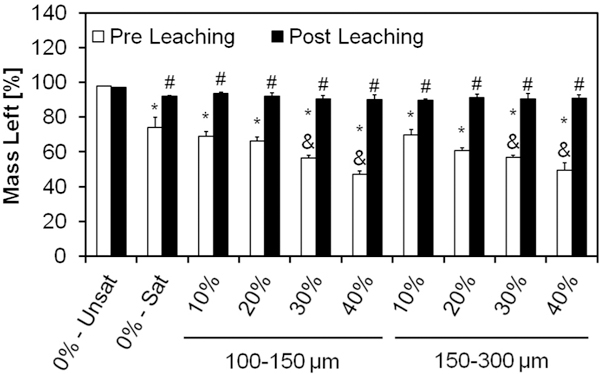
Mass left for the different formulations after setting, as determined by TGA, before and after leaching in an aqueous solution at 37 °C for 72 h. The mass remaining in the sample pan was attributed to the amount of αTCP in the samples, since αTCP does not thermally degrade below 450 °C, thereby quantifying the amount of GMPs within the composites. 0%-Unsat represents the control CPC group, while 0%-Sat involves the use of a solution saturated in glucose. GMPs were further introduced in the formulations according to two size ranges (100–150 and 150–300 μm) and four weight fractions (10, 20, 30, and 40%). Within the Pre leaching series, * and & denotes significance with respect to 0%-Unsat and 0%-Sat groups, respectively (n = 3, P < 0.05). In the Post leaching series, # denotes significance with respect to 0%-Unsat group. In both series the error bars represent the 95% confidence interval.
The same analysis was repeated after incubation in PBS for three days at 37 °C in order to estimate the dissolution kinetics of GMPs. As shown in Fig. 3, all glucose-containing formulations exhibited a small loss of about 5% after leaching, indicating a small amount of glucose still present in the system.
3.3. Phase composition and morphology
XRD allowed characterization of the effect of GMPs on the phase composition of αTCP before and after leaching. Fig. S2 shows XRD patterns for the GMP/CPC composites. After the samples were leached for 72 h, all of the αTCP transformed into HA, as evidenced by the disappearance of the αTCP peak around a 2Θ value of 30.9° and the appearance of characteristic HA peaks around 2Θ values of 25.8° and 31.8° [23,24]. Furthermore, FTIR spectra (Fig. S3) revealed characteristic apatite absorption bands [23]. The morphologies of the GMPs are presented in Fig. 4. Both preparations showed individual particles with well-preserved geometry. Fig. 5 shows SEM micrographs of the internal structure of the GMP/CPC composites. The use of glucose-saturated curing solution resulted in the creation of smooth pores within the GMP/CPC composites, as seen when comparing groups 0%-Unsat and 0%-Sat. The introduction of GMPs in the 150–300 μm range resulted in larger pores compared to the 100–150 μm range for all GMP weight fractions investigated. Interestingly, the use of GMPs corresponded with the presence of glucose deposits in the constructs, as shown by the bright white regions in Fig. 5. These glucose deposits are no longer seen following leaching of the scaffolds. On the contrary, rounder pores derived from the dissolution of the GMPs can be observed within the internal structure.
Fig. 4.
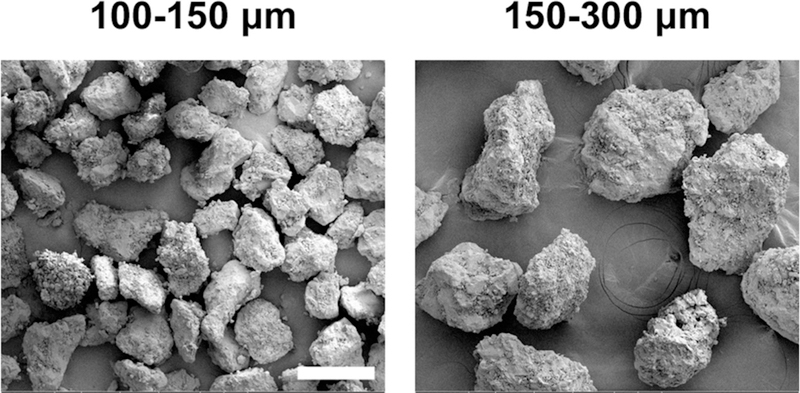
GMPs external morphology analyzed via scanning electron microscopy (SEM) upon fabrication. The white scale bar represents 200 lm in all micrographs.
Fig. 5.
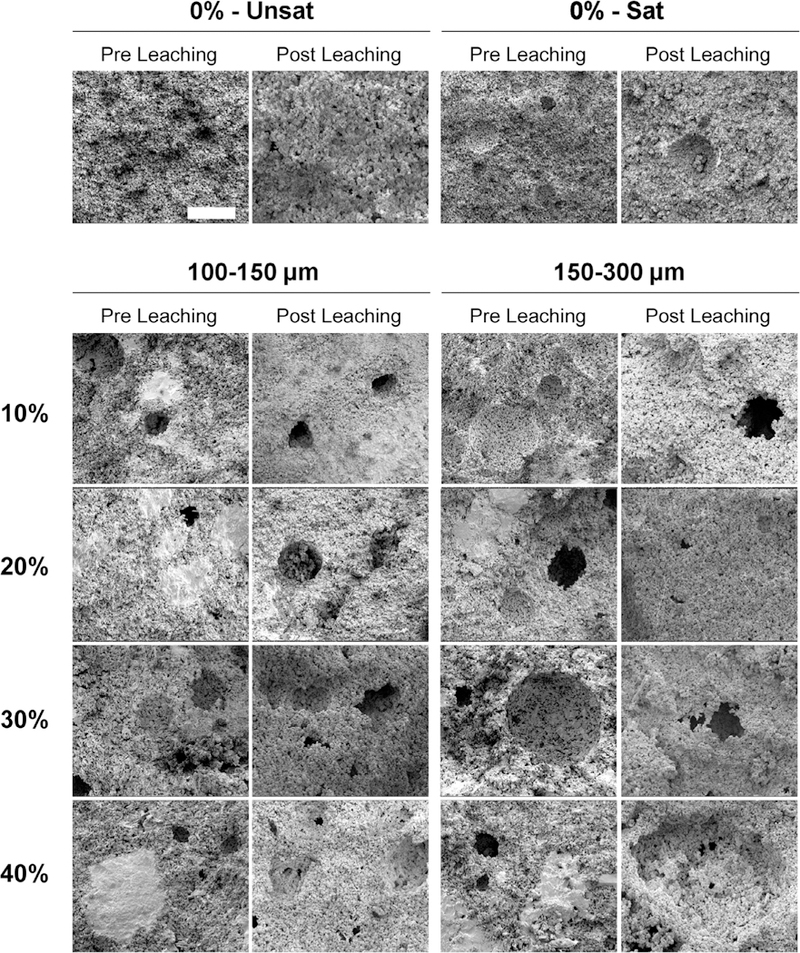
Internal morphology of scaffolds analyzed via scanning electron microscopy (SEM) upon fabrication (Pre Leaching series) and after 72 h of leaching into PBS at 37 °C (Post Leaching series). 0%-Unsat represents the control CPC group, while 0%-Sat involves the use of solution saturated in glucose. GMPs were further introduced in the formulations according to two size ranges (1001–50 and 150–300 μm) and four weight fractions (10, 20, 30, and 40%). The white scale bar represents 100 μm in all micrographs.
3.4. Porosity and pore size distribution
Qualitative and quantitative μCT analyses corroborate SEM findings, as shown in Figs. 6 and 7. μCT longitudinal cross-sections of samples revealed that groups containing GMPs had a higher overall porosity as compared to the 0%-Unsat control group. This is qualitatively seen in the increased number of dark areas, indicating a greater presence of air space instead of calcium phosphate. The presence of round and smooth pores increased with the weight fraction of GMPs. Additionally, groups containing GMPs in the 150–300 μm range showed larger pores compared to groups with GMPs in the 100–150 μm range. Overall, GMP distribution within the composite was homogeneous for all experimental groups (Fig. 6).
Fig. 6.
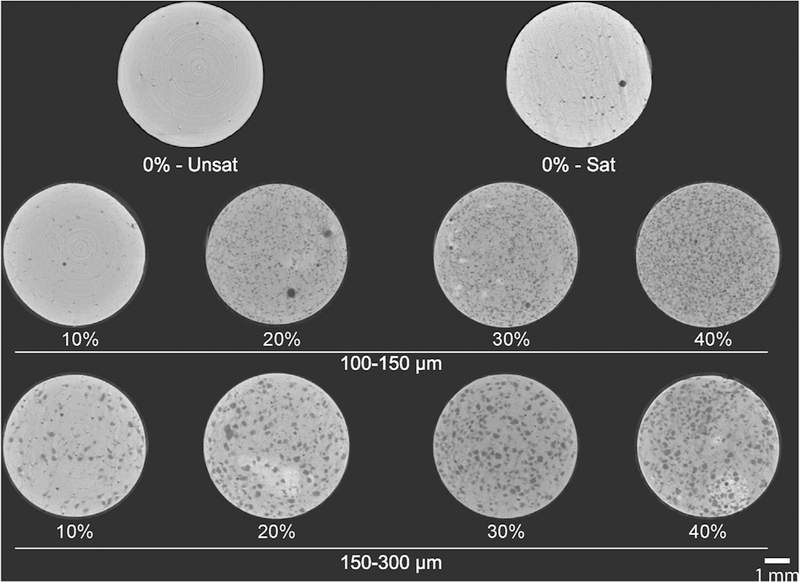
Representative μCT cross sections of GMP/CPC composites pre-leached. 0%-Unsat represents the control CPC group, while 0%-Sat involves the use of a solution saturated in glucose. GMPs were further introduced in the formulations according to two size ranges (100–150 and 150–300 μm) and four weight fractions (10, 20, 30, and 40%). Scale bar represents 1 mm.
Fig. 7.
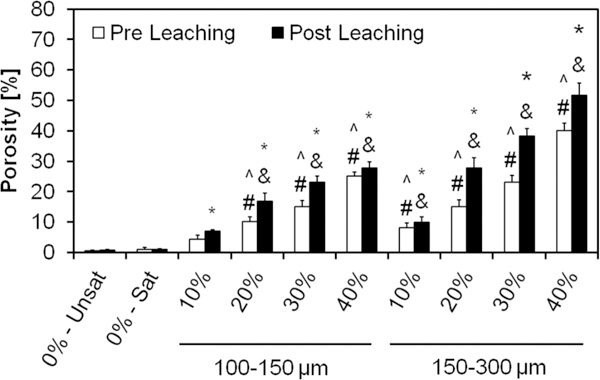
Overall porosity of the GMP/CPC composites evaluated via μCT upon fabrication (Pre Leaching series) and after 72 h of leaching into PBS at 37 °C (Post Leaching series). 0%-Unsat represents the control CPC group, while 0%-Sat involves the use of solution saturated in glucose. GMPs were further introduced in the formulations according to two size ranges (100–150 and 150–300 μm) and four weight fractions (10, 20, 30, and 40%). Within the Pre leaching series, ^ and # denotes significance with respect to 0%-Unsat and 0%-Sat groups, respectively (n = 3, P < 0.05). In the Post leaching series, * and & denote significance with respect to 0%-Unsat and 0%-Sat groups, respectively. In both series the error bars represent the 95% confidence interval. Porosity was increased by the use of GMPs, with larger GMPs imparting a greater increase in porosity than smaller GMPs.
Evaluation of porosity by μCT reveals the three-dimensional structure of the GMP/CPCs composite and thus estimates the overall porosity. While the use of a glucose-saturated curing solution did not increase scaffold porosity compared to 0%-Unsat, the use of GMPs had a significant effect on this parameter (Fig. 7). The introduction of GMPs led to the formation of pores instantly upon cement setting, and observed porosity increased with higher weight fraction of GMPs. Prior to leaching, the porosity increased from 5% (for the 10% GMP/CPC composites) to 25% (for the 40% GMP/CPC composites) for the smaller GMPs. The composites incorporating larger GMPs increased from 8% (for the 10% GMP/CPC) to 40% (for the 40% GMP/CPC composites). Notably, the size of the GMPs increased the overall porosity as well. Upon dissolution of the GMPs, scaffold porosity further increased on average by an additional 20–30% (except group 0%-Unsat).
Interestingly, the size range of GMPs had a striking effect on the pore size distribution, as shown in Fig. 8. The addition of 100–150 μm size GMPs microparticles resulted in the majority of pores being within 42–174 μm, irrespective of the loading fraction of GMPs. Conversely, the addition of 150–300 μm size GMPs resulted in the majority of pores being between 100–330 im with a much broader pore size distribution. The formation of macropores was possible only with the introduction of GMPs in the CPCs, as the use of a glucose-saturated curing solution alone had little effect on the pore size distribution, as can be seen when comparing groups 0%-Unsat and 0%-Sat in Fig. 8.
Fig. 8.
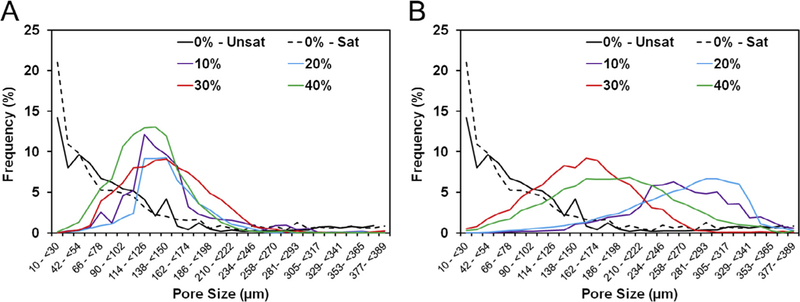
A) Pore size distributions from representative sections of the GMP/CPC composites fabricated with four different weight fractions of GMPs (10,20, 30, and 40%) in the 100–150 μm range. B) Pore size distribution from representative sections of the GMP/CPC composites fabricated with four different weight fractions of GMPs (10, 20, 30, and 40%) in the 150–300 μm range. In both panels, 0%-Unsat represents the control CPC group while 0%-Sat involves the use of solution saturated in glucose.
Pore interconnectivity was another parameter significantly affected by the weight fraction of GMPs present in the composite (Fig. 9). Control CPC was composed mainly of closed micropores (group 0%-Unsat), and the addition of glucose-saturated curing solution (group 0%-Sat) did not promote the formation of open pores. As seen in Fig. S4, the incorporation of GMPs increased the percentage of open porosity and the availability of objects, ranging from 12 to 96 μm to penetrate within the scaffolds. A higher fraction of GMPs resulted in a higher percentage of open porosity, in particular with the incorporation of 30–40% GMPs. Additionally, the percentage of accessible porosity for larger sized objects increased as a function of GMP size range.
Fig. 9.
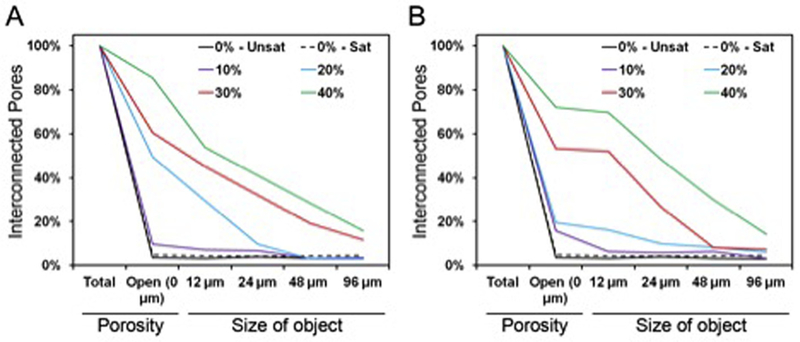
A) Representative pore interconnectivity of the GMP/CPC composites fabricated with four different weight fractions of GMPs (10,20,30, and 40%) in the 100–150 μm range. B) Representative pore interconnectivity of the GMP/CPC composites fabricated with four different weight fractions of GMPs (10, 20, 30, and 40%) in the 150–300 μm range. In both panels, 0%-Unsat represents the control CPC group while 0%-Sat involves the use of solution saturated in glucose. Both graphs represent the percentage of porosity available to allow the penetration of an object of a given size.
3.5. In vitro degradation
In order to assess whether GMP and/or CPC degradation may lead to an acidic environment, we incubated GMP/CPC samples over a period of 8 weeks in physiological conditions (Fig. 10). All experimental groups showed an initial decrease in pH, with GMP-containing groups displaying a greater decrease in pH than control group 0%-Unsat. However, within 4 weeks, all groups stabilized to a pH value comparable to that of the 0%-Unsat control group. From week 4 onward, GMP-containing samples had a pH higher than that of both groups 0%-Unsat and 0%-Sat. This increase in pH was more pronounced for GMPs in the 150–300 μm range than in the 100–150 μm range. Overall, the pH never fell below 6 for any experimental groups indicating that sample degradation did not produce a significantly acidic environment.
Fig. 10.
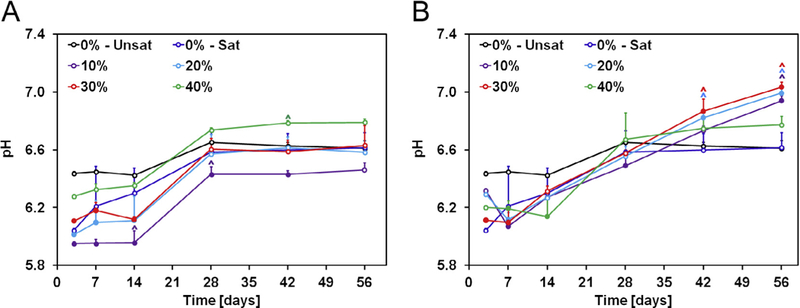
A) Change in pH with time of solutions containing GMP/CPC composites fabricated with four different weight fractions of GMPs (10, 20, 30, and 40%) in the 100–150 μm range. B) Change in pH with time of solutions containing GMP/CPC composites fabricated with four different weight fractions of GMPs (10, 20, 30, and 40%) in the 150–300 μm range. In both panels, 0%-Unsat represents the control CPC group while 0%-Sat involves the use of solution saturated in glucose. Solid circles indicate difference from 0%-Unsat group, while ^ indicates difference from 0%-Unsat group within each time point (n = 4, P < 0.05). Error bars represent the 95% confidence interval in both panels.
3.6. Mechanical properties
The compressive modulus and strength of the GMP/CPCs before and after leaching is presented in Fig. 11. The addition of the glucose-saturated curing solution (group 0%-Sat) resulted in a decrease in the compressive modulus from 440 ± 234 to 280 ± 139 MPa. In these conditions, the further introduction of GMPs in the formulation did not have an effect on the compressive properties. In addition, the compressive modulus further decreased after samples were leached for three days. This reduction in compressive strength was exacerbated at higher weight fractions of GMPs, regardless of the GMP size range chosen. On the whole, all glucose-containing CPCs had a significantly lower compression modulus than the control group 0%-Unsat, both before and after leaching. The same trend was observed for the compressive strength. The addition of the glucose-saturated curing solution resulted in a decrease in the compressive strength.
Fig. 11.
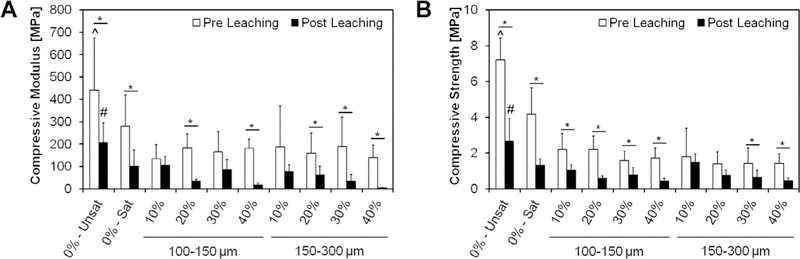
Compressive modulus (A) and compressive strength (B) of different formulations tested upon fabrication (Pre Leaching series) and after 72 h of leaching into PBS at 37 “C (Post Leaching series). 0%-Unsat represents the control CPC group, while 0%-Sat involves the use of a solution saturated in glucose. GMPs were further introduced in the formulations according to two size ranges (100–150 and 150–300 μm) and four weight fractions (10, 20, 30, and 40%). Within each series, ^ and # indicate statistical difference from any other group (P < 0.05), while * indicate differences between Pre and Post leaching within each group. Error bars represent the 95% confidence interval in both panels.
4. Discussion
The current study investigated the use of glucose microparticles (GMPs) as fast-dissolving porogens for calcium phosphate cement (CPCs), with the ultimate goal of designing a stable porogen during cement setting that can dissolve rapidly and therefore generate macroporous CPC. For this study, we selected four different weight fractions (10, 20, 30, and 40%) and two GMP size ranges (100–150 and 150–300 μm) and characterized how these parameters affected the physiochemical characteristics of the resulting GMP/ CPC composites. Furthermore, the GMP/CPC composites were subjected to standardized testing for setting time and cohesiveness, two handling properties relevant to the clinical use of these materials as injectable cements for bone repair.
Regarding the handling properties of the GMP/CPC composites, the introduction of GMPs significantly altered the properties as compared to CPC control specimens without added microparticles. The introduction of the glucose-saturated liquid increased both the initial and final setting time above a clinically relevant window. A potential explanation for this observation is that glucose is more hydrophilic than the calcium phosphate cement, sequestering water from the cement and thus leading to increased setting times [8]. The observed increase in setting times is much higher then previous reports using water-soluble porogens [25,26]. However, it was shown that adding a higher concentration of Na2HPO4 could counteract the effects of the GMPs on setting times – thus, bringing the initial setting time within a window where wound closure would not be delayed for a significant amount of time [27]. Additionally, it has been shown that measuring setting times at 37 °C further reduces the setting time [7]. However, the introduction of GMPs improved the cohesiveness of the cements when introduced into an aqueous environment, thus making them suitable as injectable systems for in vivo applications. It was observed that cement cohesiveness improved as the weight fraction of GMPs increased, irrespective of GMP size chosen. We contend that the GMPs also absorb some of the liquid phase, resulting in a paste with a higher viscosity and thus allowing the cement to resist immediate degradation when introduced into an aqueous environment.
The leaching analyses emphasized that the majority of the GMPs as well as the precipitated glucose are removed from within the composites within three days, thus showing that GMPs are fast dissolving porogens. The high solubility and fast dissolution rate of glucose allows for most of it to be removed in a relatively short amount of time. SEM micrographs demonstrated the generation of pores before the GMPs were leached from the composite scaffolds. In addition, they suggested that GMPs were homogenously distributed. Several studies have investigated the effects of different porogens on CPC macroporosity and have demonstrated that a porous structure is critical to support tissue infiltration [8,16,27]. The introduction of GMPs successfully generated macroporosity within the composites. Composites containing 40% GMPs showed overall porosity values that were slightly lower then other porous cements fabricated out of water-soluble porogens [25]. However, these cements took several weeks to reach their maximum porosity. Overall it was observed that the majority of the porosity was established before the GMPs were leached from within the composites, as seen by the μCT data. It is hypothesized that during the setting reaction, the GMPs dissolve within the cement, leaving a void space. In order to generate an interconnected pore structure, the volume fraction of porogens should exceed 40% [16]. The μCT data corroborated these findings. In regards to pore size, previous studies have shown the importance of pores larger then 100 μm for bone tissue engineering [28]. As such, the pore distributions revealed that pores would be of sufficient size to support tissue infiltration. Furthermore, the addition of 30% and 40% GMP showed the development of an interconnected pore structure, while the 10% and 20% formulations lacked meaningful interconnectivity. Interestingly, we found that postleached samples only had a slight increase in macroporosity. Previous studies have shown that the degradation or dissolution of the porogen is accompanied with a large increase in macroporosity [11,12,25,29–32]. Thus, we envision GMPs could be combined with other porogens in order to introduce an initial porosity and assist with the degradation of the second porogen.
In the present study, the in vitro degradation study was performed with refreshing of the soaking medium at every time point. The composites showed an initial decrease in pH after 3 days of incubation in PBS. This initial drop in pH is mainly caused by the transformation of the αTCP phase into the apatitic phase [11]. This initial drop in pH was exacerbated in GMP-containing groups, which exhibited, however, a less acidic pH than control CPC groups at later time points. This phenomenon might be explained by the higher porosity of GMP/CPC composites compared to that of control CPC, which results in a higher surface area and hence a faster release of acidic byproduct deriving from the initial transformation of αTCP to apatite. After this initial burst release of acidic leach-ables (that regardless, does not produce a strongly acidic environment), the solution pH in GMP-containing groups was maintained around physiological conditions. This was not the case for the control CPC group 0%-Unsat, where the diffusion of acidic byproducts occurred over an 8-week period in light of the significantly lower surface area available for mass transfer.
Finally, it was observed that the addition of the GMPs worsened the mechanical properties of the composites. However, these values are in agreement with other studies with apatitic cements [33,34]. Additionally, these results are in agreement with reported work of a decrease in the mechanical properties of CPC-based scaffolds upon introduction of macroporosity, further stressing the important role that porosity plays on the mechanical properties [8].
5. Conclusions
In this study, we fabricated GMPs that can be easy handled and incorporated within CPC. By changing the content of GMPs, clinically relevant handling properties such as cohesiveness, setting time, and overall macroporosity can be tailored. In addition, these porogens were completely dissolved in 3 days resulting in a further increase in scaffold porosity. In vitro degradation studies showed that throughout the 8-week degradation study, the local pH was maintained at a neutral pH range. However, the inclusion of GMPs had a detrimental effect on the compressive strength of the composites. This work demonstrates that GMPs can be utilized as a fast dissolving porogen for the creation of macroporosity within CPC.
Supplementary Material
Statement of Significance.
Calcium phosphate cements have shown great promise for the regeneration of bone. However, macropores (>100 μm) are required for promoting bone ingrowth. Several studies have investigated methods to generate macroporosity within calcium phosphate cements but many of these methods either affect the cement setting or take weeks or months to generate the maximum porosity. This work offers a new method for generating macroporosity within calcium phosphate cements by utilizing glucose microparticles. The microparticles dissolve in less then 72 h, thereby generating scaffolds with maximum porosity in short period of time. The results will offer a new method for generating macroporosity within calcium phosphate cements.
Acknowledgements
The authors thank Jason L. Guo for helpful discussions and for assistance with manuscript preparation. This work was supported by the Army, Navy, NIH, Air Force, VA, and Health Affairs to support the AFIRM II effort, under Award W81XWH-14-2-0004.
Footnotes
Appendix A. Supplementary data
Supplementary data associated with this article can be found, in the online version, at http://dx.doi.org/10.1016Zj.actbio.2016.12.024.
References
- [1].Bohner M, Gbureck U, Barralet J, Technological issues for the development of more efficient calcium phosphate bone cements: a critical assessment, Biomaterials 26 (33) (2005) 6423–6429. [DOI] [PubMed] [Google Scholar]
- [2].Dorozhkin SV, Bioceramics of calcium orthophosphates, Biomaterials 31 (7) (2010) 1465–1485. [DOI] [PubMed] [Google Scholar]
- [3].Service RF, Tissue engineers build new bone, Science 289 (5484) (2000) 1498–1500. [DOI] [PubMed] [Google Scholar]
- [4].van de Watering F, van den Beucken J, Lanao RF, Wolke J, Jansen J, Biodegradation of Calcium Phosphate Cement Composites, Degradation of Implant Materials, Springer, 2012, pp. 139–172. [Google Scholar]
- [5].LeGeros RZ, Properties of osteoconductive biomaterials: calcium phosphates, Clin. Orthop. Relat. Res. 395 (2002) 81–98. [DOI] [PubMed] [Google Scholar]
- [6].Félix Lanao RP, Sariibrahimoglu K, Wang H, Wolke JG, Jansen JA, Leeuwenburgh SC, Accelerated calcium phosphate cement degradation due to incorporation of glucono-delta-lactone microparticles, Tissue Eng. Part A 20 (1–2) (2013) 378–388. [DOI] [PubMed] [Google Scholar]
- [7].Bohner M, Calcium orthophosphates in medicine: from ceramics to calcium phosphate cements, Injury 31 (2000) D37–D47. [DOI] [PubMed] [Google Scholar]
- [8].Habraken W, DeJonge L,Wolke J, Yubao L, Mikos A, Jansen J, Introduction of gelatin microspheres into an injectable calcium phosphate cement, J. Biomed. Mater. Res. Part A 87 (3) (2008) 643–655. [DOI] [PubMed] [Google Scholar]
- [9].Ruhé PQ, Hedberg EL, Padron NT, Spauwen PH,Jansen JA, Mikos AG, Biocompatibility and degradation of poly (DL-lactic-co-glycolic acid)/calcium −544. [DOI] [PubMed] [Google Scholar]
- [10].Habraken W, Liao H, Zhang Z, Wolke J, Grijpma D, Mikos A, Feijen J, Jansen J, In vivo degradation of calcium phosphate cement incorporated into biodegradable microspheres, Acta Biomater. 6 (6) (2010) 2200–2211. [DOI] [PubMed] [Google Scholar]
- [11].Lanao RF, Leeuwenburgh S, Wolke J, Jansen J, In vitro degradation rate of apatitic calcium phosphate cement with incorporated PLGA microspheres, Acta Biomater. 7 (9) (2011) 3459–3468. [DOI] [PubMed] [Google Scholar]
- [12].Del Real R, Wolke J, Vallet-Regi M, Jansen J, A new method to produce −3680. [DOI] [PubMed] [Google Scholar]
- [13].Friedman CD, Costantino PD, Takagi S, Chow LC, BoneSourceTM hydroxyapatite cement: a novel biomaterial for craniofacial skeletal tissue engineering and reconstruction, J. Biomed. Mater. Res. 43 (4) (1998) 428–432. [DOI] [PubMed] [Google Scholar]
- [14].Ginebra M-P, Traykova T, Planell J, Calcium phosphate cements as bone drug delivery systems: a review, J. Control. Release 113 (2) (2006) 102–110. [DOI] [PubMed] [Google Scholar]
- [15].Liao H, Walboomers XF, Habraken WJ, Zhang Z, Li Y, Grijpma DW, Mikos AG, Wolke JG, Jansen JA, Injectable calcium phosphate cement with PLGA, gelatin and PTMC microspheres in a rabbit femoral defect, Acta Biomater. 7 (4) (2011) 1752–1759. [DOI] [PubMed] [Google Scholar]
- [16].Habraken W, Wolke J, Mikos A, Jansen J, Injectable PLGA microsphere/calcium phosphate cements: physical properties and degradation characteristics, J. Biomater. Sci. Polym. Ed. 17 (9) (2006) 1057–1074. [DOI] [PubMed] [Google Scholar]
- [17].Miller JS, Stevens KR, Yang MT, Baker BM, Nguyen D-HT, Cohen DM, Toro E, Chen AA, Galie PA, Yu X , Rapid casting of patterned vascular networks for perfusable engineered three-dimensional tissues, Nat. Mater. 11 (9) (2012) 768–774. [DOI] [PMC free article] [PubMed] [Google Scholar]
- [18].Wei G, Ma PX, Macroporous and nanofibrous polymer scaffolds and polymer/ bone-like apatite composite scaffolds generated by sugar spheres, J. Biomed. Mater. Res. Part A 78 (2) (2006) 306–315. [DOI] [PubMed] [Google Scholar]
- [19].International A, ASTM C266–15, Standard Test Method for Time of Setting of Hydraulic-Cement Paste by Gillmore Needles, West Conshohocken, PA, 2015. [Google Scholar]
- [20].Bohner M, Physical and chemical aspects of calcium phosphates used in spinal surgery, Eur. Spine J. 10 (2) (2001) S114–S121. [DOI] [PMC free article] [PubMed] [Google Scholar]
- [21].Komath M, Varma H, Development of a fully injectable calcium phosphate cement for orthopedic and dental applications, Bull. Mater. Sci. 26 (4) (2003) 415–422. [Google Scholar]
- [22].Bercier A, Gonsalves S, Lignon O, Fitremann J, Calcium phosphate bone cements including sugar surfactants: Part one–Porosity, setting times and compressive strength, Materials 3 (10) (2010) 4695–4709. [DOI] [PMC free article] [PubMed] [Google Scholar]
- [23].Lopez-Heredia MA, Sariibrahimoglu K, Yang W, Bohner M, Yamashita D, Kunstar A, Van Apeldoorn AA, Bronkhorst EM, Lanao RPF, Leeuwenburgh SC, Influence of the pore generator on the evolution of the mechanical properties and the porosity and interconnectivity of a calcium phosphate cement, Acta Biomater. 8 (1) (2012) 404–414. [DOI] [PubMed] [Google Scholar]
- [24].Megarry AJ, Booth J, Burley J, Sucrose/glucose molecular alloys by cryomilling, J. Pharm. Sci. 103 (7) (2014) 2098–2106. [DOI] [PubMed] [Google Scholar]
- [25].Xu HH, Weir MD, Burguera EF, Fraser AM, Injectable and macroporous calcium phosphate cement scaffold, Biomaterials 27 (24) (2006) 4279–4287. [DOI] [PubMed] [Google Scholar]
- [26].Markovic M, Takagi S, Chow LC, Formation of macropores in calcium phosphate cements through the use of mannitol crystals, Key Engineering Materials, Trans Tech Publ, 2001, pp. 773–776. [Google Scholar]
- [27].Renno A, Nejadnik M, Van De Watering F, Crovace M, Zanotto E, Hoefnagels J, Wolke J, Jansen J, Van den Beucken J, Incorporation of bioactive glass in calcium phosphate cement: material characterization and in vitro degradation, J. Biomed. Mater. Res. Part A 101 (8) (2013) 2365–2373. [DOI] [PubMed] [Google Scholar]
- [28].Simske SJ, Ayers RA, Bateman T, Porous Materials for Bone Engineering, Materials Science Forum, Trans Tech Publ, 1997, pp. 151–182. [Google Scholar]
- [29].Takagi S, Chow L, Formation of macropores in calcium phosphate cement implants, J. Mater. Sci. Mater. Med. 12 (2) (2001) 135–139. [DOI] [PubMed] [Google Scholar]
- [30].Qi X, Ye J, Wang Y, Improved injectability and in vitro degradation of a calcium phosphate cement containing poly(lactide-co-glycolide) microspheres, Acta Biomater. 4 (6) (2008) 1837–1845. [DOI] [PubMed] [Google Scholar]
- [31].Qi X, Ye J, Mechanical and rheological properties and injectability of calcium phosphate cement containing poly (lactic-co-glycolic acid) microspheres, Mater. Sci. Eng. C 29 (6) (2009) 1901–1906. [Google Scholar]
- [32].Roy A, Jhunjhunwala S, Bayer E, Fedorchak M, Little SR, Kumta PN, Porous calcium phosphate-poly (lactic-co-glycolic) acid composite bone cement: a viable tunable drug delivery system, Mater. Sci. Eng. C 59 (2016) 92–101. [DOI] [PubMed] [Google Scholar]
- [33].Bigi A, Bracci B, Panzavolta S, Effect of added gelatin on the properties of calcium phosphate cement, Biomaterials 25 (14) (2004) 2893–2899. [DOI] [PubMed] [Google Scholar]
- [34].Driessens F, Boltong M, De Maeyer E, Wenz R, Nies B, Planell J, The Ca/P range of nanoapatitic calcium phosphate cements, Biomaterials 23 (19) (2002) 4011–4017. [DOI] [PubMed] [Google Scholar]
Associated Data
This section collects any data citations, data availability statements, or supplementary materials included in this article.