Significance
Successful delivery of therapeutic agents to metastatic tumors is critical for controlling their growth and improving cancer patient survival. It is challenging to design drug carriers that target metastases because of the limitations of current techniques for analyzing drug carrier interactions with metastatic tumors. We overcome this problem by developing a new imaging and image analysis workflow that enables us to track nanoparticle delivery, penetration, and distribution within micrometastases. More importantly, we can predict the delivery of nanoparticles to the micrometastases based on their physiology using a machine learning algorithm. This allows us to predict the micrometastases pathophysiology that can be targeted more effectively.
Keywords: nanoparticles, metastasis, 3D microscopy, image analysis, machine learning
Abstract
Metastasis of solid tumors is a key determinant of cancer patient survival. Targeting micrometastases using nanoparticles could offer a way to stop metastatic tumor growth before it causes excessive patient morbidity. However, nanoparticle delivery to micrometastases is difficult to investigate because micrometastases are small in size and lie deep within tissues. Here, we developed an imaging and image analysis workflow to analyze nanoparticle–cell interactions in metastatic tumors. This technique combines tissue clearing and 3D microscopy with machine learning-based image analysis to assess the physiology of micrometastases with single-cell resolution and quantify the delivery of nanoparticles within them. We show that nanoparticles access a higher proportion of cells in micrometastases (50% nanoparticle-positive cells) compared with primary tumors (17% nanoparticle-positive cells) because they reside close to blood vessels and require a small diffusion distance to reach all tumor cells. Furthermore, the high-throughput nature of our image analysis workflow allowed us to profile the physiology and nanoparticle delivery of 1,301 micrometastases. This enabled us to use machine learning-based modeling to predict nanoparticle delivery to individual micrometastases based on their physiology. Our imaging method allows researchers to measure nanoparticle delivery to micrometastases and highlights an opportunity to target micrometastases with nanoparticles. The development of models to predict nanoparticle delivery based on micrometastasis physiology could enable personalized treatments based on the specific physiology of a patient’s micrometastases.
There has been significant effort in developing nanoparticle carriers for the treatment of solid tumors. Research has been focused on the application of nanoparticles for treating or detecting primary tumors and for understanding the impact of different nanoparticle designs in mediating tumor delivery. The objective of these areas of research is to improve the design of nanoparticles to yield improved therapeutic outcomes (1). The principal target for these studies is primary tumors that are contained at a single location. However, it has been shown that many primary tumors can be successfully treated by surgical resection, radiation, and/or chemotherapy. Another cancer target is metastatic tumors—tumors in which primary tumor cells leave the original tumor site and move to a different part of the body and start to grow into a new tumor. Experts attribute ∼90% of cancer deaths to metastatic disease because metastases can be difficult to detect and rely on systemically administered treatment to reach all tumor locations (2).
It is difficult to investigate metastatic tumors because they can be small, heterogenous, and distributed throughout the entire body. This has led to limited studies that probe the delivery, accumulation, and interactions of nanoparticles with metastatic tumors. Here, we are interested in probing the delivery of nanoparticles to micrometastasis, which are small avascular tumor cell clusters that are key to the early stages of metastatic tumor growth. The removal of these cells would prevent their growth into full-sized debilitating metastatic tumors. We hypothesized that micrometastases are a good target for nanoparticle carriers because they are small in size and located close to blood vessels (3). This is in contrast to a primary tumor where it is difficult for nanoparticles to target tumor cells. In primary tumors the extracellular matrix and stromal cells interact with the nanoparticles, preventing diffusion deep into the tumor and limiting their interactions with cancer cells (4–8). The differential pathophysiology between a micrometastasis and a primary tumor may be the reason that preclinical studies show some success in the treatment or detection of micrometastases with nanoparticles (9–12). Unfortunately, micrometastases are difficult to analyze using conventional imaging, flow cytometry, or genetic approaches because of their small size and sparse distribution within healthy tissues. This leads to limited studies of the impact of the pathophysiology of micrometastases on the drug delivery process. This makes it difficult to determine the suitability of nanoparticles for targeting micrometastases.
Tissue clearing and 3D imaging offer a solution to evaluate micrometastasis physiology and nanoparticle delivery. These techniques have been explored for imaging biological features such as blood vessels or neurons over large tissues, whole organs, and whole animals (13–16). These techniques are also well suited for studying sparse features located deep in tissues such as metastases throughout entire organs or animals (17, 18). Techniques using tissue clearing and 3D microscopy have already been optimized to evaluate nanoparticle distribution within tissues (18–21) and for tracking antibody (22) and small-molecule delivery (23) to primary tumors. This type of imaging produces large amounts of information about tissue structure and nanoparticle location with high resolution. It is challenging to extract large amounts of quantitative data from these images because traditional automated image analysis techniques, such as thresholding or filtering methods, are inadequate and tailored to recognize individual features such as nuclei or blood vessels. Alternatively, manual methods can be used to identify any number of features from images but are time-consuming and low-throughput.
Artificial intelligence and machine learning have recently emerged as viable technologies for learning patterns of molecules and cells in complex biological environments. Automated image analysis using machine learning is adaptable and high-throughput, allowing for the collection of large amounts of data from images. In the context of histological images, machine learning is being applied in many areas including segmenting and mapping different immune cell types in tumors (24, 25), classifying and predicting mutations in lung cancer (26), and classifying skin cancer (27). These methods show great potential but are limited to 2D images. Relatively few examples exist for applying machine learning-based image analysis to 3D microscopy images and are generally restricted to the analysis of single structures such as cell nuclei (28–30).
We propose the development of a combinatorial imaging and analysis technique to analyze nanoparticle interaction with micrometastases. This is achieved by using 3D optical light-sheet microscopy after tissue clearing to image nanoparticle distribution within intact micrometastases followed by machine learning-based segmentation and image analysis. Our method can automatically identify multiple biological structures including micrometastases, individual cells, and blood vessels. This allows us to measure physiological features and track nanoparticle delivery to individual tumor cells from 3D microscopy images. We evaluate micrometastases as a potential target for nanoparticles and uncover fundamental information about how the physiology of these small tumors impacts the ability to deliver nanoparticles to them.
Results
Developing a 3D Imaging and Machine Learning Technique for Analyzing Nanoparticle Interaction with Micrometastases.
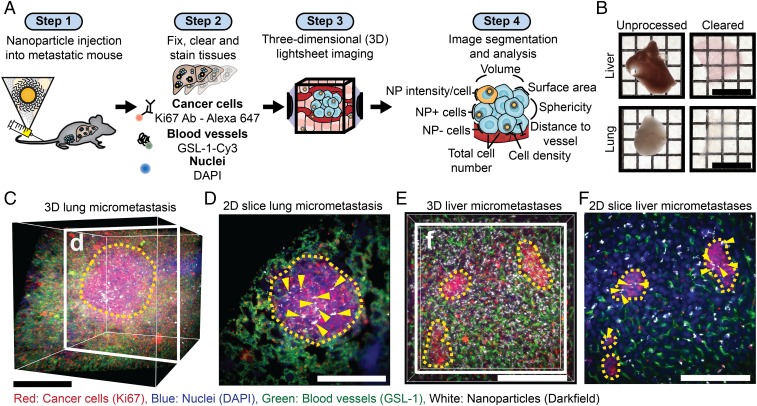
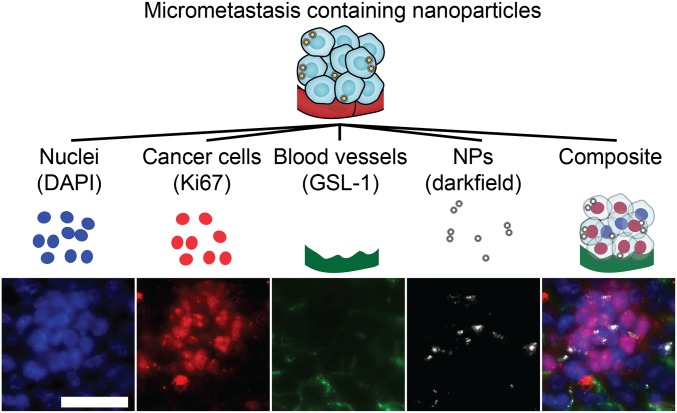
Our study is premised on the ability to image nanoparticles within intact tissues containing micrometastases. To visualize micrometastases, we developed methods based on our previous work on tissue clearing, labeling, and 3D imaging of nanoparticles within intact tissues (19, 20). Our workflow is displayed in Fig. 1A. We administered 50-nm polyethylene glycol (PEGylated)-coated gold nanoparticles via tail-vein injection into the syngeneic, orthotopic 4T1 mouse model of breast cancer after micrometastases had formed in the liver and lungs 3 wk after primary tumor induction. The characterization of the nanoparticles is shown in SI Appendix, Fig. S1. Gold nanoparticles were chosen as a model nanoparticle carrier because they are retained in cleared tissues (20) and can be detected via light scattering (21). The nanoparticles were allowed to circulate for 4 h, and then organs were resected and processed as previously described (20). Examples of the optically transparent organs are shown in Fig. 1B. The blood vessels were labeled with Cy-3-Griffonia simplicifolia Lectin I (Cy3-GSL-1), micrometastases were identified with an antibody for Ki67, a marker of cell proliferation, with a secondary antibody conjugated to Alexa-Fluor 647, and individual cells were identified by DAPI staining. The transparent organs were then imaged in a refractive index matching solution using the Zeiss Lightsheet Z.1 microscope. The pathophysiology was visualized via the fluorescence stains, and the nanoparticles were imaged by light scattering (21). The 3D images show the structure and location of the blood vessels, cells and nanoparticles within micrometastases in the lung (Fig. 1 C and D and Movie S1) and liver (Fig. 1 E and F and Movie S2). Fig. 2 is a schematic that shows how images are composed of multiple imaging channels allowing for the detailed examination of the nuclei, Ki67-positive cells, blood vessels, and nanoparticles within individual micrometastases.
Fig. 1.
Tissue clearing, staining, and 3D imaging enable visualization of nanoparticle delivery to micrometastases. (A) Workflow for tissue preparation, imaging, and analysis of nanoparticle delivery to micrometastases. Tumors are induced and metastases form, and then nanoparticles are injected (step 1). Next, tissues of interest are optically cleared and stained with fluorescent markers (step 2). The optically cleared tissues are then imaged with light-sheet microscopy to generate 3D multichannel images (step 3). These images are then segmented to identify biological features of interest (nuclei, blood vessels, micrometastases), which are used along with the nanoparticle intensity channel to quantify nanoparticle delivery (step 4). (B) Images of 1-mm sections of the liver and lung before and after optical clearing. (Scale bar, 1 cm.) (C) A 3D image of a lung containing a micrometastasis. (Scale bar, 250 μm.) (D) A 2D section of the micrometastasis in C showing nanoparticles within the micrometastasis. Yellow arrows highlight nanoparticle locations. (Scale bar, 250 μm.) (E) A 3D image of a liver section that contains multiple micrometastases. (Scale bar, 200 μm.) (F) A 2D section of E showing 3 separate micrometastases. The yellow dashed line outlines the micrometastases, and the yellow arrows show nanoparticle locations. (Scale bar, 200 μm.)
Fig. 2.
Multichannel 3D imaging enables detailed imaging of micrometastases. Light-sheet imaging was used to capture individual channels for nuclei (DAPI), cancer cells (Ki67), blood vessels (GSL-1), and nanoparticles (darkfield) that can be viewed individually or as a composite image. An example of an individual liver micrometastasis is shown as 2D slices from a 3D image. (Scale bar, 50 μm.) NP, nanoparticles.
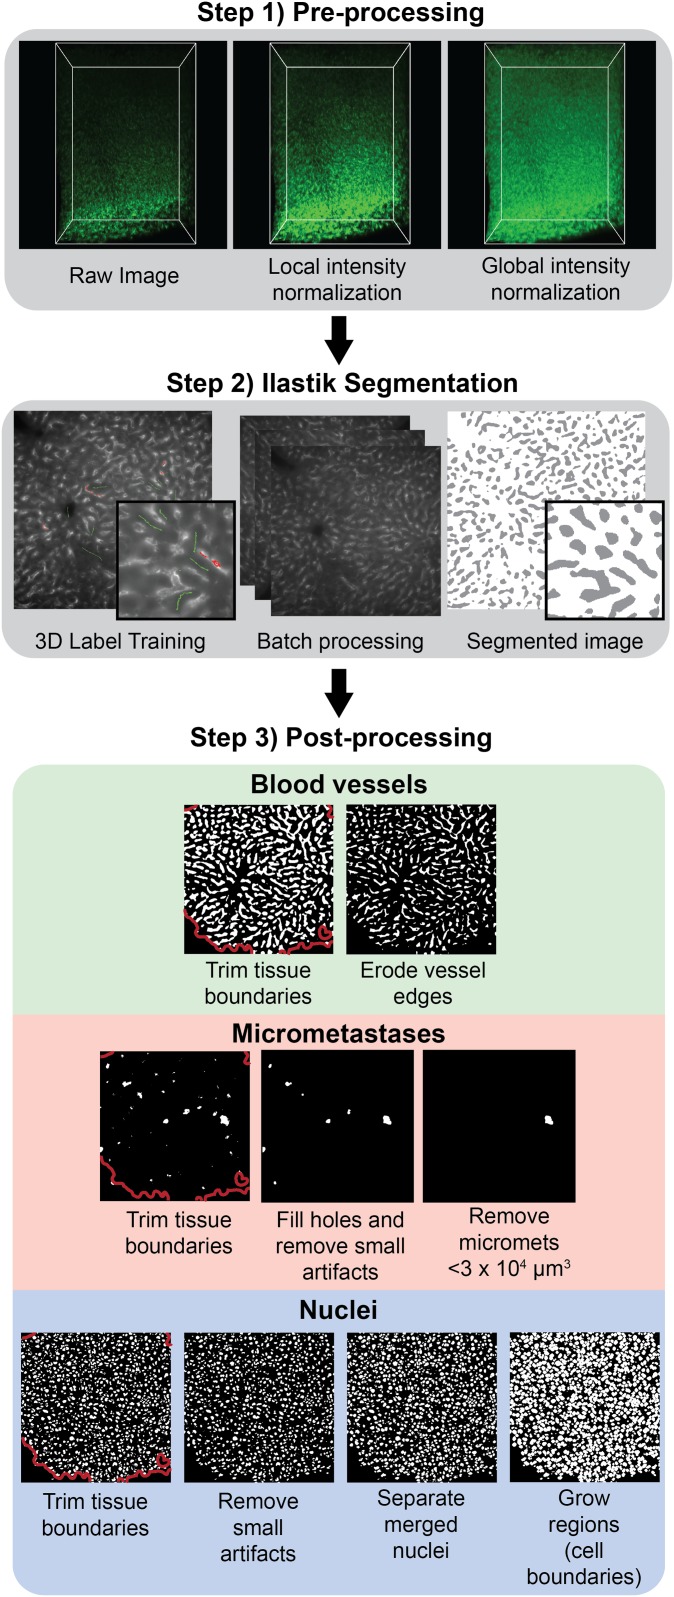
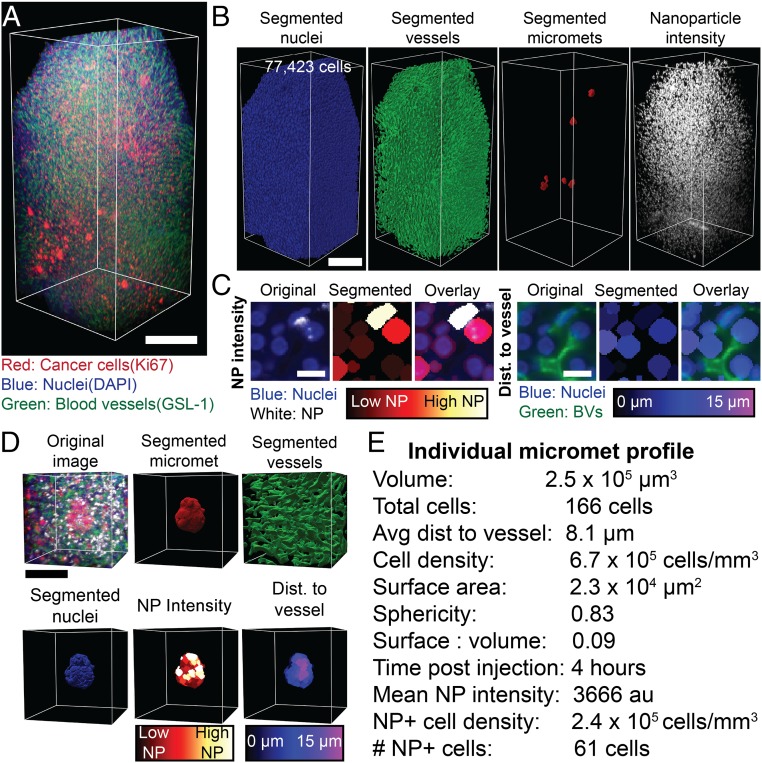
Next, we developed a machine learning-based workflow to analyze the images (31), which is shown in Fig. 3. This workflow is used to segment blood vessels, micrometastases, and nuclei from the 3D light-sheet images. The first step uses a preprocessing algorithm to normalize local and global changes in signal intensity across the image volume. This is common in light-sheet microscopy due to inhomogeneities throughout the tissue and across the imaging depth as the objective lens gets farther from the imaging plane. The second step is to train a supervised machine learning tool called Ilastik (32) to segment blood vessels, nuclei, and metastases from their respective fluorescent light-sheet images. The use of a machine learning-based approach overcomes the limitations of traditional thresholding or filtering methods because it incorporates multiple image characteristics to determine the best descriptors for the specific image feature. The third step is a postprocessing algorithm, which is applied to each of the segmented channels to eliminate optical artifacts. Common segmentation artifacts occurred on the tissue surface due to the presence of autofluorescent debris so the outer layer was removed and excluded from analysis. Merged nuclei are a common segmentation artifact. To overcome this, we used a seeded watershed algorithm as part of the nuclei segmentation post processing. These segmentations are consistent with manual segmentations of blood vessels, nuclei, and micrometastases (SI Appendix, Fig. S2). The application of this segmentation to a full 3D image is shown in Fig. 4. Fig. 4A shows an image of a liver containing micrometastases. Fig. 4B shows the corresponding segmented nuclei, blood vessels, micrometastases, and nanoparticle intensity channel. Fig. 4C shows an example of the ability to do single-cell quantification of nanoparticle intensity and cell distance from the nearest blood vessel. By segmenting and dilating each nucleus, we are able to measure the mean nanoparticle signal for each cell. The threshold to define nanoparticle-positive cells is set to 3 times the noise signal from cleared tissue with no nanoparticles (SI Appendix, Fig. S3). A Euclidean distance transformation from the segmented blood vessels is used to measure each cell distance to the nearest vessel. This allows us to map the nanoparticle intensity and cell distance to the nearest blood vessel for all cells in the 3D image.
Fig. 3.
Semiautomated image segmentation workflow for blood vessels, micrometastases, and nuclei. First, images for each channel undergo a preprocessing step to normalize the signal intensity both locally and globally throughout the image stack. Next, a machine learning-based pixel classification tool called Ilastik (32) is used to identify blood vessels, micrometastases, and nuclei from their respective preprocessed fluorescent images. The resulting segmented images are classified as either positive voxels for the respective feature (blood vessel, micrometastasis, or nuclei) or as background voxels. In the final postprocessing step, each of the segmented channels undergo steps to remove feature-specific artifacts from the Ilastik segmentation. The final result is a set of binary images that identify blood vessels, micrometastases, and cell nuclei.
Fig. 4.
Machine learning image segmentation allows for detailed analysis of 3D microscopy images. (A) A 3D image of a liver containing micrometastases. (Scale bar, 250 μm.) (B) The segmented nuclei, blood vessels, micrometastases, and nanoparticle intensity channel from A. (Scale bar, 250 μm.) (C) Two-dimensional images from A showing nuclei and the segmented and expanded nuclei with false colored segmentations representing the calculated mean nanoparticle intensity (Left 3 panels), and distance from blood vessels (Right 3 panels). (Scale bar, 20 μm.) (D) An example of an individual micrometastasis. The cropped original 3D image, the segmented micrometastasis, the surrounding vasculature, the segmented nuclei, the mean nanoparticle intensity per cell, and the distance to the nearest blood vessel of each cell. (Scale bar, 100 μm.) (E) The measured values from D create a quantitative individual micrometastasis profile. NP, nanoparticle. BV, blood vessel. Dist, distance. Micromet, micrometastasis.
From the segmented images we can then quantify the pathophysiology and nanoparticle delivery to individual micrometastases. Fig. 4D is an example of an individual micrometastasis profile. We show the original image, segmented micrometastasis, surrounding vasculature, individual nuclei, mean nanoparticle intensity per cell, and distance to the nearest vessel for each cell. We can measure a quantitative profile of each micrometastasis as displayed in Fig. 4E. This shows the ability to quantify the physiology and nanoparticle delivery to micrometastases from 3D microscopy images.
Comparing Nanoparticle Delivery between the Primary Tumor and Micrometastases.
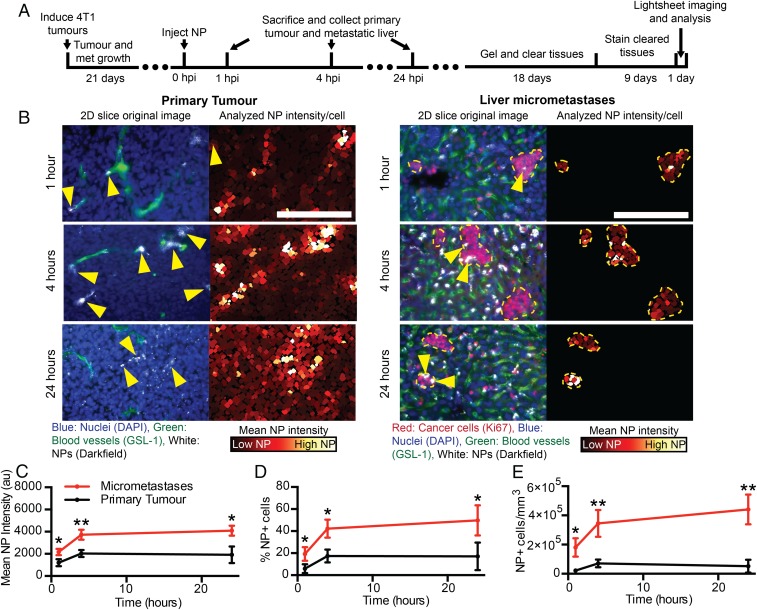
Previous studies have shown that systemically administered nanoparticles have limited penetration from blood vessels and access to cancer cells in primary tumors (4–7). Micrometastases are small in size and located near blood vessels. This led us to hypothesize that tumor cells within a micrometastasis are more accessible to nanoparticles. To test this, 4T1 primary tumors were induced and allowed to spontaneously metastasize over 3 wk. Gold nanoparticles were then injected via tail vein and circulated for 1, 4, or 24 h. The animals were killed, and the liver containing micrometastases and the primary tumor were collected, processed, imaged, and analyzed as described above. The liver was chosen because it had consistent and numerous micrometastases that allowed for comparisons within a single animal and across different animals. The general workflow and time line are displayed in Fig. 5A. Fig. 5B shows that we are able to visualize nanoparticle accumulation at each time point in micrometastases and in the primary tumor.
Fig. 5.
Tracking of nanoparticle delivery to micrometastases and primary tumors. (A) The time line from tumor induction to image analysis. (B) Two-dimensional cropped sections from 3D images of the primary tumor (Left column) and the liver micrometastases (Right column) at 1, 4, and 24 h post nanoparticle injection. Yellow arrows indicate nanoparticle locations. (Scale bar, 200 μm.) The mean nanoparticle intensity (C), percentage of nanoparticle cells (D), and density of nanoparticle-positive cells (E) in the primary tumor and micrometastases over time. n = 3 for each time point. *P < 0.05, **P < 0.01. Error bars show SD. NP, nanoparticle. HPI, hours post injection.
We discovered that nanoparticles had higher access to cells in micrometastases compared with primary tumor cells. Micrometastases had higher mean nanoparticle intensities, percentage of nanoparticle-positive cells, and density of nanoparticle-positive cells compared with the primary tumor at 1, 4, and 24 h, which is shown in Fig. 5 C–E. Both the primary tumor and micrometastases had the highest delivery at 24 h. Fig. 5C shows that at 24 h post injection the average nanoparticle intensity of the micrometastases was 4,090 au (arbitrary units) while the primary tumor was 1,915 au, a 2× increase. Fig. 5D shows that at 24 h post injection 50% of cells in micrometastases were positive for nanoparticles versus only 17% of cells in the primary tumor. The density of nanoparticle-positive cells is in shown in Fig. 5E. Micrometastases were over 8× higher with 4.4 × 10⁵ nanoparticle-positive (NP+) cells/mm3 compared with the primary tumor with 0.52 × 10⁵ NP+ cells/mm3.
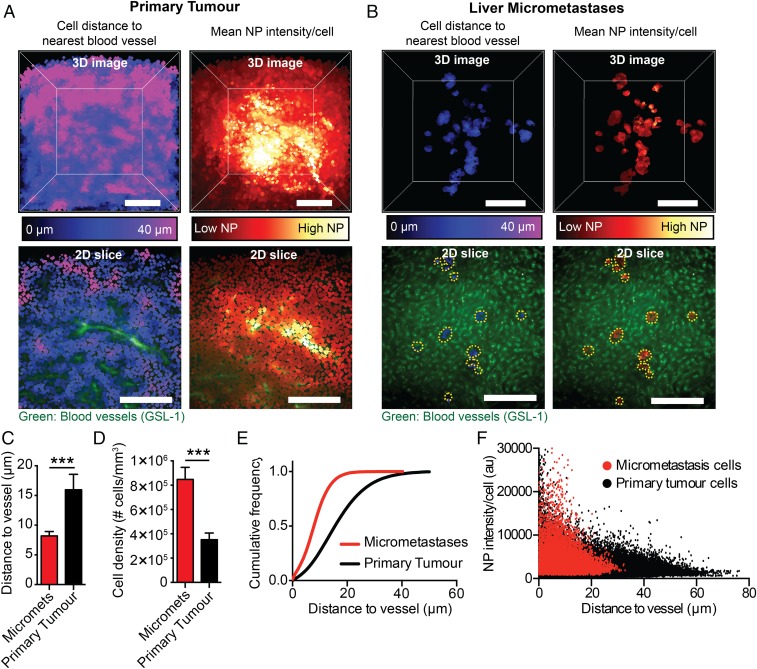
Next, we examined the role of the differences in physiology leading to the greater proportion of cells in the micrometastases interacting with the nanoparticles compared with the primary tumor. It has been shown that a cell’s distance from the blood vessels in primary tumors determines its interactions and associations with nanoparticles (5, 6). We compared and mapped the location of the tumor cells within a primary tumor and within all of the micrometastases at 24 h post nanoparticle injection as this is when we saw the highest accumulation. Examples of analyzed 3D primary tumor and micrometastases images are shown in Fig. 6 A and B and Movies S3 and S4. In Fig. 6A there are many cells over 30 μm away from blood vessels in the primary tumor which are shown in pink. Fig. 6C shows that the average distance of the cells was 16 μm away from the closest blood vessel in the primary tumor. Most nanoparticles were generally near the tumor blood vessels, and therefore cells that were far away could not interact with nanoparticles. This is illustrated in Fig. 6A in the Lower panels where cells closely associated with blood vessels have high amounts of nanoparticles compared with cells farther away. In comparison, cells in micrometastases were much closer to vessels. Fig. 6C shows that the average distance of cells within the micrometastases was 8 μm away from the blood vessels and that 90% of them were less than 16 μm away as shown by the cumulative cell distribution in Fig. 6E. Fig. 6D shows that, on average, micrometastases had over twice the cell density compared with the primary tumor. Both the cells in the primary tumor and the micrometastases showed decreasing nanoparticle intensities as they got farther away from blood vessels (Fig. 6F). We conclude that nanoparticles had greater access to tumor cells in micrometastases than primary tumors because the cells are closer to the blood vessels.
Fig. 6.
Cells in the primary tumor are farther from blood vessels than those in micrometastases. An example of a 3D analyzed image of a primary tumor (A) or liver containing micrometastases (B) showing the average cell distance from the nearest blood vessel (cells close to vessels are dark blue; cells far away are pink) and the mean nanoparticle intensity per cell (cells with low nanoparticle intensities are dark red; cells with high nanoparticle intensities are yellow-white). The Lower 2 panels are 2D slices of a section of the primary tumor or liver with micrometastases with the blood vessels and the average cell distance to the nearest blood vessel or mean nanoparticle intensities. The yellow dashed line outlines the micrometastases. (Scale bar, 200 μm.) (C) The average cell distance to the nearest blood vessel in micrometastases and the primary tumor. (D) The cell density in micrometastases and the primary tumor. (E) The cumulative frequency of cells as a function of distance to the nearest blood vessel in micrometastases and in the primary tumor. (F) The mean nanoparticle intensity of individual cells in micrometastases and the primary tumor as a function of distance to the nearest blood vessel 24 h post injection. n = 9 for C and D. n = 3 for E and F. ***P < 0.001. Error bars show SD. NP, nanoparticle.
Variability Exists in Nanoparticle Delivery and Physiology of Individual Micrometastases.
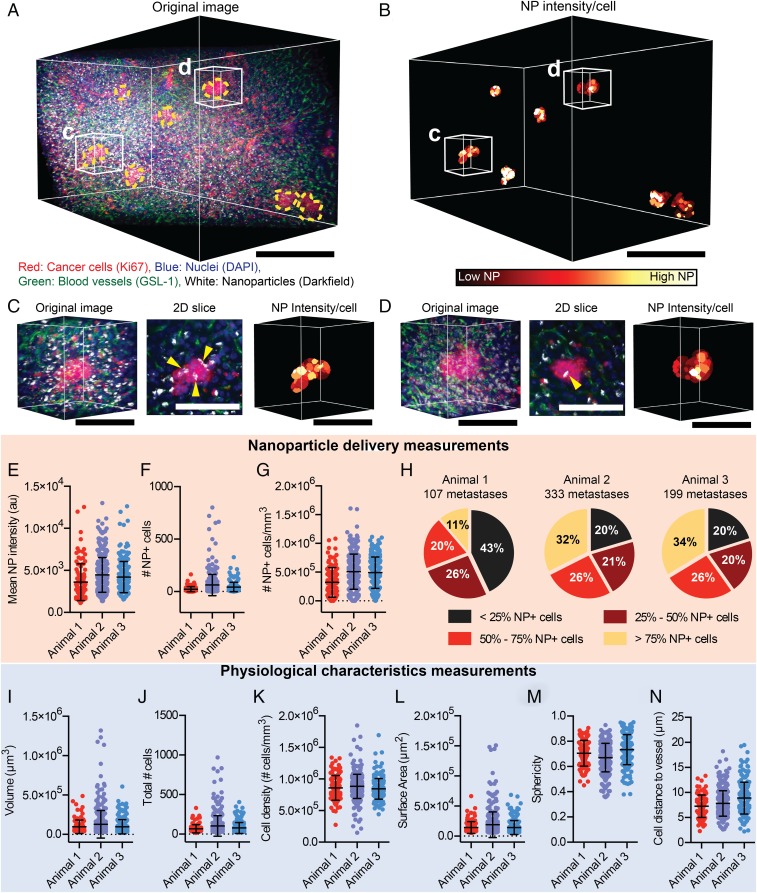
There may be multiple micrometastases within a single animal. Each micrometastases has a unique pathophysiology that may impact the consistency of nanoparticle delivery. To evaluate delivery to individual micrometastases, we focused on the analysis of liver micrometastases 24 h post nanoparticle injection because this is the time point at which we saw the highest accumulation. Fig. 7 A and B and Movie S5 show a 3D image of multiple micrometastases within a liver region. Fig. 7 C and D highlight individual micrometastasis physiology and nanoparticle delivery. We observed significant variability in the delivery of nanoparticles to each individual metastasis within a single animal. This is illustrated by the spread of single points in Fig. 7 E–G. There are also significant variations in the delivery of nanoparticles to micrometastases in different animals shown in Fig. 7 E–H. For example, Fig. 7E shows that the mean nanoparticle intensity of individual micrometastases varied between 1,127 and 13,018 au, an 11× difference. Fig. 7F shows that the number of nanoparticle-positive cells was also variable with some micrometastases having 0 nanoparticle-positive cells and others having as many as 801 nanoparticle-positive cells. Variations in the density of nanoparticle-positive cells was also observed between individual micrometastases (Fig. 7G). Fig. 7H shows that the proportion of nanoparticle-positive cells within each micrometastasis was different within and between animals. Our analysis revealed that 57–80% of individual micrometastases within a single animal had more than 25% nanoparticle-positive cells (the sum of the nonblack regions of the pie chart), with between 11 and 34% of micrometastases having more than 75% nanoparticle-positive cells. On average, while nanoparticles can be delivered to a greater proportion of cells within a micrometastasis compared with the primary tumor, there is variability in delivery between individual micrometastases, with some individual micrometastases having lower delivery than the primary tumor. This may pose a problem for the consistent delivery of nanoparticles to micrometastases.
Fig. 7.
Variable nanoparticle delivery and physiology of micrometastases. (A) Original 3D image of a liver containing micrometastases 24 h post nanoparticle injection and (B) the corresponding segmented micrometastasis cells colored to show the mean nanoparticle intensity per cell. (Scale bar, 250 μm.) (C and D) Magnified images of 2 individual micrometastases with the original 3D image, a 2D slice of the original image, and the mean nanoparticle intensity per cell. Yellow arrows highlight nanoparticle locations. (Scale bar, 100 μm.) The liver micrometastases of 3 different animals were analyzed, and the mean nanoparticle intensity (E), number of nanoparticle-positive cells (F), and density of nanoparticle cells (G) for each individual micrometastasis were determined. (H) The percentage of micrometastases with <25% NP+ cells, 25–50% NP+ cells, 50–75% NP+ cells, and >75% NP+ cells for 3 separate animals. Measurements of individual micrometastasis volume (I), total cell number (J), cell density (K), surface area (L), sphericity (M), and average cell distance to the nearest blood vessel (N) in the same animals as in E–H. Error bars show SD.
We probed deeper into the pathophysiology of the different metastases to understand if this could be responsible for the variability in nanoparticle delivery. Across different animals we observed variations in the volume, total cell number, cell density, surface area, sphericity, and average cell distance to blood vessels for each micrometastasis (Fig. 7 I–N). For example, Fig. 7I shows that the volume of individual micrometastases varied from 3.0 × 104 μm3 to 130 × 104 μm3, a 43× difference. This corresponded to 12 cells in the smallest and 970 cells in the largest metastases, which is shown in Fig. 7J. The cell density varied between 1.5 × 10⁵ cells/mm3 to 18 × 105 cells/mm3, a 12× difference (Fig. 7K). There was also variability between micrometastases in the average distance of the cells from the nearest blood vessel. Fig. 7N shows that the average cell distance to the nearest vessel ranged from 2 to 19 μm. The large variability in pathophysiology is likely the main contributor to nanoparticle delivery success.
Can We Predict Nanoparticle Delivery to Micrometastases?
Given the importance of delivery in both imaging and therapeutic outcomes, it is important to determine whether a subpopulation of micrometastases are more prone to nanoparticle targeting. Prediction of nanoparticle delivery is important because the observed variability in the delivery to different micrometastases within a single animal and between different animals would influence their therapeutic effectiveness. For example, micrometastases with no therapeutic nanoparticle accumulation would be unaffected while those with a high delivery would be eliminated.
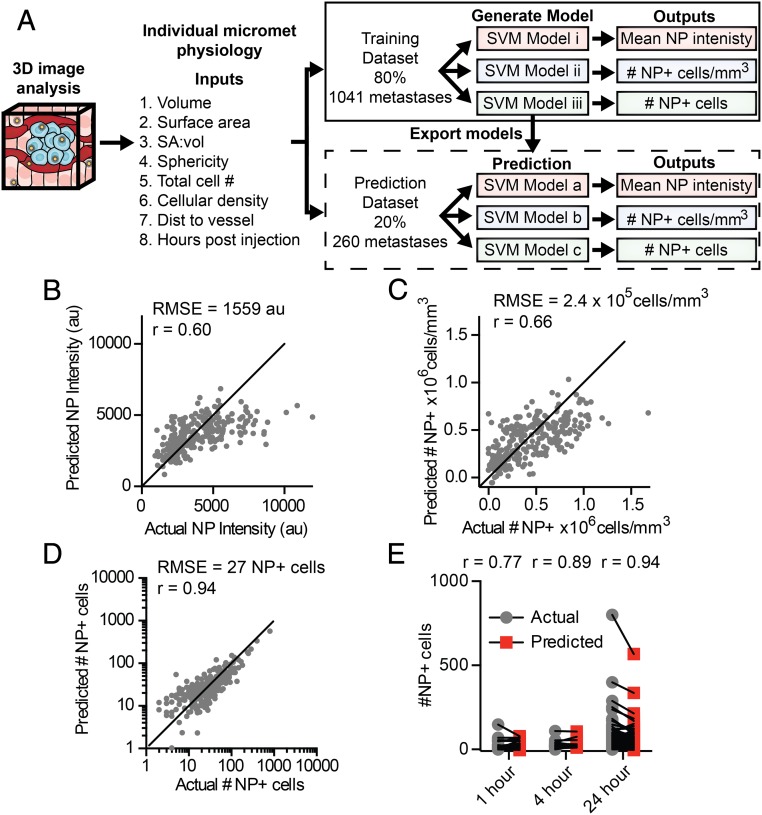
We chose to evaluate machine learning-based modeling that can analyze and correlate multiple physiological input variables to a single function (i.e., delivery). This type of analysis would enable us to predict the nanoparticle delivery to a micrometastasis given a set of input variables about its specific pathophysiology. To generate a sufficient database, we imaged micrometastases in the livers of mice at 1, 4, and 24 h post nanoparticle injection with 3 to 6 mice analyzed for each time point. These images were then analyzed using our image analysis workflow to quantify the physiology and nanoparticle delivery to each individual micrometastasis. The result was a dataset containing 1,301 micrometastases, which is available in Dataset S1. This dataset enabled us to use Support Vector Machine (SVM) modeling to develop a predictive model for nanoparticle delivery to micrometastases. Before evaluating any of the models, the dataset containing 1,301 individual liver micrometastasis profiles was randomly split into a training and cross-validation set containing 80%, or 1,041 micrometastases, and a test set containing 20%, or 260 micrometastases. The training and cross-validation dataset was used to train linear, quadratic, cubic, and fine, medium, and coarse Gaussian SVM models. We evaluated the models with 5-fold cross-validation to determine if these models could predict the mean nanoparticle intensity, density of nanoparticle-positive cells, or number of nanoparticle-positive cells from the inputs of micrometastasis volume, surface area, surface-area-to-volume ratio, sphericity, total cell number, cellular density, mean distance to nearest blood vessel, and hours post nanoparticle injection. The general workflow for this modeling is shown in Fig. 8A. We found that the quadratic SVM model appeared to predict the number of nanoparticle cells, mean nanoparticle intensity, and density of nanoparticle-positive cells better than the other SVM models (SI Appendix, Fig. S4).
Fig. 8.
Predicting nanoparticle delivery to micrometastases based on physiological characteristics. (A) To generate a predictive model of nanoparticle delivery to micrometastases, a dataset was created via 3D imaging and analysis of physiological characteristics and nanoparticle delivery for individual micrometastases. The dataset was divided with 80% of the data being used to train and cross-validate potential models, and 20% of the data for prediction testing. Separate SVM models were generated for each nanoparticle delivery output. The optimal model generated from the training dataset was exported and run with the test dataset. The actual and the model predicted nanoparticle delivery values from the test dataset are shown for mean nanoparticle intensity (B), density of nanoparticle-positive cells (C), and number of nanoparticle-positive cells (D) per individual micrometastasis. (E) The actual and predicted number of nanoparticle-positive cells in each micrometastasis separated by time point. SA:vol, surface-area-to-volume ratio. NP, nanoparticle.
We then independently tested the quadratic SVM models. We used the 20% test dataset of 260 micrometastases to determine if data that was not part of the training data could be accurately predicted. Fig. 8 B and C show that the SVM models could predict mean nanoparticle intensity and density of nanoparticle-positive cells reasonably well, with root mean squared errors (RMSE) of 1,559 au and 2.4 × 10⁵ nanoparticle-positive cells/mm3, respectively. Fig. 8D shows the model performance for predicting the number of nanoparticle-positive cells per metastasis with a RMSE of 27 cells and a Pearson correlation (r) of 0.94. SI Appendix, Fig. S5, contains all model performance metrics. By separating the predicted data by time point, we show that we can predict the number of nanoparticle-positive cells within an individual micrometastasis after 1, 4, and 24 h post injection as shown in Fig. 8E.
There is a predictable pattern between the pathophysiology of a micrometastasis and the nanoparticle delivery despite the large variations in nanoparticle delivery between individual micrometastases. This is important because our imaging method combined with the predictive algorithm may be useful for screening for micrometastases that are more susceptible to nanoparticle delivery. This could enable the identification of patient populations more prone to nanoparticle-based treatments.
Conclusion
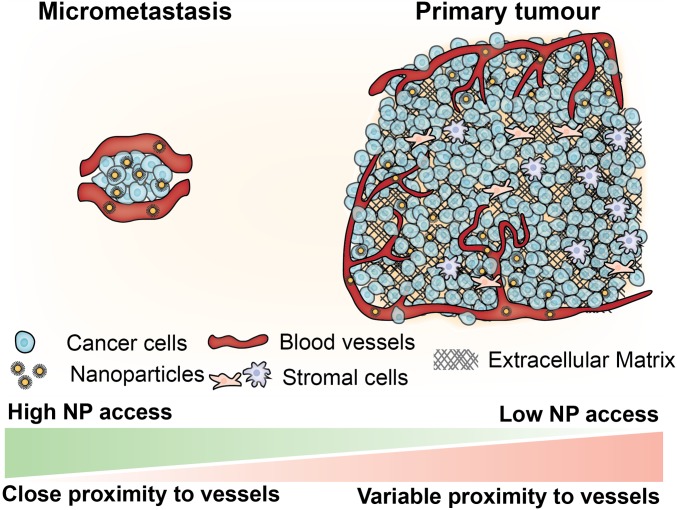
The successful elimination of early metastatic tumors before they grow into large debilitating metastases could lead to an increase in patient survival. Our method revealed that the physiology of micrometastases makes them a more suitable target for nanoparticles compared with primary tumors. As a micrometastasis grows, it starts to build a complex architecture of vasculature, immune cells, associated stromal cells, and extracellular matrix components (Fig. 9), making it more difficult to deliver nanoparticles. At the micrometastasis stage the physiological composition is much simpler and cells are in close proximity to blood vessels, which makes nanoparticle delivery efficient. This is intuitive but requires experimental data and methods to make these conclusions. Going forward, it will be important to determine how physiological features of micrometastases—such as blood vessel phenotype, extracellular matrix composition, or presence of immune cells—change as the tumor grows, making it easier or harder to target with nanoparticles. Furthermore, our experiments show that the biggest challenge of targeting micrometastasis is the variability in delivery that is dependent on micrometastasis physiology. We also show that there is variability in the delivery process to different micrometastases. Despite this we were able to develop a machine learning algorithm to predict nanoparticle delivery based on the specific pathophysiology of a micrometastasis.
Fig. 9.
Micrometastases offer an opportunity to target cancer cells in close proximity to blood vessels. Cells within micrometastases are located in close proximity to blood vessels, making them easier to access using nanoparticles. As the tumor grows it becomes more complex, incorporating stromal cells and dense extracellular matrix, and cells are generally farther from vessels.
Finally, our predictive algorithm performs well in most instances but it did not for some micrometastases. Future iterations of our predictive algorithm could evaluate the addition of new parameters such as extracellular matrix composition and presence of stromal cells, which have shown to be important for nanoparticle delivery to primary tumors (5, 6, 18, 33). It is also important to establish a link between the nanoparticle delivery and the therapeutic efficacy using therapeutic nanoparticles and to establish how both relate to the physiology of the micrometastasis. It may also be possible to evaluate patterns of micrometastasis pathophysiology in patient biopsies. Based on the pathophysiology of the micrometastasis, it may be possible to determine which patients are more sensitive to nanoparticle-based treatments. This enables us to develop a framework to personalize nanoparticle treatment for micrometastases based on the patient’s specific micrometastasis physiology.
Materials and Methods
Spontaneous Metastatic Breast Cancer Model.
Tumors were induced by injecting 1 million 4T1 cells into the inguinal mammary fat pad of female BALB/c mice and allowed to grow for 3 wk for spontaneous metastases to form. The 2 × 10¹² PEGylated 50-nm gold nanoparticles were allowed circulate for 1, 4, or 24 h depending on the experiment. PEGylated gold nanoparticles were synthesized and characterized as described previously (34). Immediately before starting tissue fixation animals were injected with Cy3-GSL-1 (G. simplicifolia Lectin I) to label blood vessels. All animal work was done in accordance with and approved by the University of Toronto Animal Care Committee.
Tissue Processing.
Tissue fixation and clearing were done as previously described (20, 21). Briefly, animals were deeply sedated and fixed via transcardial perfusion with monomer solution containing 2% wt/vol acrylamide, 4% formaldehyde, and 0.25% wt/vol VA-044 axoinitiator. Whole organs of interest were then removed and placed in the hydrogel monomer solution for 7 d at 4 °C. Organs were then gelled by removing air and purging with argon gas before incubating at 37 °C for 3 h. Tissues were then left as whole organs or sectioned into 1-mm slices and allowed to clear passively in 4% wt/vol SDS in a 200-mM borate (pH 8.5) solution for 5–14 d at 50 °C depending on the sample.
Tissue Staining.
Ki67 staining was done by blocking the cleared tissues in 5% wt/vol bovine serum albumin (BSA) in PBS, 0.1% Triton-X 100, and 0.01% sodium azide overnight at room temperature. Primary Ki67 antibody (BioLegend, clone 11F6) was then added at a 1:100 dilution in 1 mL of 2% vol/vol goat serum, PBS, 0.1% Triton-X 100, and 0.01% sodium azide and incubated at room temperature for 3 d. Tissues were then washed to remove excess primary antibody with 10 mL of PBS, 0.1% Triton-X 100, and 0.01% sodium azide for 24 h at room temperature. Secondary Alexa-Fluor-647 (Biolegend) was then added at a 1:200 dilution and DAPI at 10 μM in 1 mL of 2% vol/vol goat serum, PBS, 0.1% Triton-X 100, and 0.01% sodium azide for 3 d at room temperature. Tissues were then washed to remove excess primary antibody with 10 mL of PBS, 0.1% Triton-X 100, and 0.01% sodium azide for 24 h at room temperature. Tissues were then placed in 67% 2′2-thiodiethanol (TDE) solution in 200 mM borate, 0.1% Triton-X, and 0.01% sodium azide solution for refractive index matching for at least 24 h at room temperature before light-sheet imaging.
Light-Sheet Microscopy.
Images were acquired on the Zeiss Lightsheet Z.1 microscope (CLARITY Plan-Neofluor Objective: 20×, N.A. = 1.0, refractive index = 1.45) in 67% TDE solution. Standard excitation and emission filters were used to image the fluorescent stains, while darkfield light scattering was used to detect gold nanoparticles as previous described (21). Images were rendered in Bitplane IMARIS version 8.1.
Image Segmentation and Analysis.
All code used in this paper are available on Github at https://github.com/BenKingston/3D_met_NP_analysis or from the developers of Ilastik at https://www.ilastik.org or https://github.com/ilastik. Code was evaluated with MATLB 2017b with DIP image v2.7 (http://www.diplib.org or https://github.com/DIPlib/diplib).
Preprocessing.
Image files from the Zeiss microscope were first converted into uint16 multipage tiff files using a custom MATLAB script and down-sampled from 1,920 × 1,920–627 × 627 and a final voxel size of 1 × 1 × 1 μm to reduce file size and facilitate downstream analysis. For image segmentation of nuclei, blood vessels and micrometastases each of these channels then underwent preprocessing to correct fluorescence intensity locally and globally across the image volume.
Ilastik segmentation.
The preprocessed nuclei, blood vessel, and micrometastasis channels were then used to train the pixel classification random forest classifier in Ilastik (32). Separate algorithms were trained to segment each of the features (nuclei, blood vessels, or micrometastases) using the full set of 37 filters in Ilastik. A minimum of 30 min was spent manually labeling features to train the classifier. The resulting binary nuclei, blood vessel, and micrometastasis images were then exported into uint8 multipage tiff files for post processing.
Postprocessing.
Following the Ilastik segmentation, a number of artifacts appeared that needed to be removed with a postprocessing script written in MATLAB. For all channels (nuclei, blood vessels, micrometastases, and nanoparticle) imaging artifacts commonly appear on the surface of the tissue due to autofluorescent and light-scattering debris. The first step post processing is to define a tissue boundary using the nuclei channel and then from this boundary to erode the outer layer of the tissue from the image. This mask is applied to the nuclei, blood vessel, and micrometastasis binary Ilastik segmentations to remove artifacts on the edges of the tissue images. For the nuclei segmentation, small artifacts are removed and merged nuclei are separated using a seeded watershed algorithm. To approximate cell boundaries, nuclei are dilated by 2 μm. For blood vessels, the tissue-trimmed, segmented image recognizes blood vessels as larger than they are; to correct this, the boundaries of the vessels are eroded by 2 μm. For micrometastases the tissue-trimmed, segmented image undergoes a step to remove small artifacts and any objects smaller than 30,000 μm3 in size (<10 cells) because they could not reliably be segmented from the images. The output post processing is binary images of the nuclei, blood vessel, and micrometastasis channels.
Segmentation validation.
Automatically segmented images were validated against manually segmented images. For the nuclei and blood vessel channels, three 2D slices from 3 different animals, and for the micrometastases, five 2D slices from 5 different animals, were randomly selected for manual segmentation. The Dice similarity coefficient was then calculated comparing the automated and manual segmentations in MATLAB.
Feature quantification from images.
The segmented blood vessel, micrometastasis, and nuclei channels along with the nanoparticle intensity channel were used to quantify the physiological and nanoparticle characteristics from the images using a MATLAB script. After labeling each micrometastasis in an image with a unique number, we extracted the volume, surface area, and, with the nanoparticle channel, the mean nanoparticle intensity of each lesion. To generate single-cell information for nanoparticle intensity, the dilated segmented nuclei were used as a mask applied to the nanoparticle intensity channel to extract the mean nanoparticle intensity per cell. To calculate the cell distance to the nearest vessel, a Euclidean distance transformation was applied to the segmented blood vessel channel to create a grayscale image where the intensity is equal to the distance that the voxel is from the nearest vessel. The dilated and segmented nuclei were then used to calculate the cell distance from the nearest vessel. The nanoparticle intensity and distance from the vessel for each cell was then calculated for each region defined by a micrometastasis. A list of cells for each micrometastasis was created with the corresponding mean nanoparticle intensities, cell distances, and the number of cells within each lesion. From these parameters we calculate the surface-area-to-volume ratio, sphericity, cell density, average cell distance to vessels, number of nanoparticle-positive cells, and nanoparticle-positive cell density. Nanoparticle-positive cells were defined as cells having a mean intensity 3 times higher than the noise signal from cleared tissue that contains no nanoparticles (the background signal), which can be seen in SI Appendix, Fig. S3.
Support Vector Machine Modeling.
Before generating models, the dataset of 1,301 micrometastases was split randomly into a training and cross-validation dataset (80%, or 1,041 micrometastases) to evaluate potential models and a test dataset (20%, or 260 micrometastases) to evaluate the final predictive models (Dataset S1). All model generation and evaluation were done in MATLAB using the Statistics and Machine Learning toolbox. Initially, linear, quadratic, cubic, and fine, medium, and coarse Gaussian SVM models were trained using the training and cross-validation dataset to determine if these models could predict the mean nanoparticle intensity, density of nanoparticle-positive cells, or number of nanoparticle-positive cells from the inputs of volume, surface area, surface-area-to-volume ratio, sphericity, total cell number, cellular density, mean distance to nearest blood vessel, and hours post nanoparticle injection. Based on the performance of the models (SI Appendix, Fig. S4), the quadratic SVM model had the best performance. Separate quadratic SVM models that were trained to predict mean nanoparticle intensity, density of nanoparticle cells, and number of nanoparticle cells per micrometastasis were then exported. The test dataset was then used to evaluate the prediction of these models.
Supplementary Material
Acknowledgments
B.R.K. thanks the Natural Sciences and Engineering Research Council of Canada (NSERC), the Royal Bank of Canada, the Borealis AI graduate Fellowship, the Wildcat Foundation, and the Cecil Yip Doctoral Award for student scholarships and fellowships. A.M.S. thanks NSERC for student funding. J.N. thanks NSERC, the Queen Elizabeth II Graduate Scholarship in Science and Technology, the Cecil Yip Doctoral Award, and the Ontario Graduate Scholarship for funding. S.S. thanks Canadian Institutes of Health Research, Vanier Canada, and the University of Toronto MD/PhD program for funding. W.C.W.C. acknowledges Canadian Institute of Health Research Grants FDN-159932 and MOP-1301431; NSERC Grant 2015-06397; Collaborative Health Research Program Grant CPG-146468; Canadian Research Chairs Program Grant 950-223824; and Canadian Cancer Society Grant 705285-1.
Footnotes
The authors declare no conflict of interest.
This article is a PNAS Direct Submission.
Data deposition: All code related to this paper have been deposited in Github, https://github.com/BenKingston/3D_met_NP_analysis.
This article contains supporting information online at www.pnas.org/lookup/suppl/doi:10.1073/pnas.1907646116/-/DCSupplemental.
References
- 1.Jain R. K., Stylianopoulos T., Delivering nanomedicine to solid tumors. Nat. Rev. Clin. Oncol. 7, 653–664 (2010). [DOI] [PMC free article] [PubMed] [Google Scholar]
- 2.Valastyan S., Weinberg R. A., Tumor metastasis: Molecular insights and evolving paradigms. Cell 147, 275–292 (2011). [DOI] [PMC free article] [PubMed] [Google Scholar]
- 3.Lambert A. W., Pattabiraman D. R., Weinberg R. A., Emerging biological principles of metastasis. Cell 168, 670–691 (2017). [DOI] [PMC free article] [PubMed] [Google Scholar]
- 4.Dreher M. R., et al. , Tumor vascular permeability, accumulation, and penetration of macromolecular drug carriers. J. Natl. Cancer Inst. 98, 335–344 (2006). [DOI] [PubMed] [Google Scholar]
- 5.Sykes E. A., et al. , Tailoring nanoparticle designs to target cancer based on tumor pathophysiology. Proc. Natl. Acad. Sci. U.S.A. 113, E1142–E1151 (2016). [DOI] [PMC free article] [PubMed] [Google Scholar]
- 6.Dai Q., et al. , Quantifying the ligand-coated nanoparticle delivery to cancer cells in solid tumors. ACS Nano 12, 8423–8435 (2018). [DOI] [PubMed] [Google Scholar]
- 7.Yuan F., et al. , Microvascular permeability and interstitial penetration of sterically stabilized (stealth) liposomes in a human tumor xenograft. Cancer Res. 54, 3352–3356 (1994). [PubMed] [Google Scholar]
- 8.Chauhan V. P., et al. , Normalization of tumour blood vessels improves the delivery of nanomedicines in a size-dependent manner. Nat. Nanotechnol. 7, 383–388 (2012). [DOI] [PMC free article] [PubMed] [Google Scholar]
- 9.Peiris P. M., et al. , Treatment of cancer micrometastasis using a multicomponent chain-like nanoparticle. J. Control. Release 173, 51–58 (2014). [DOI] [PMC free article] [PubMed] [Google Scholar]
- 10.Liu T. W., et al. , Inherently multimodal nanoparticle-driven tracking and real-time delineation of orthotopic prostate tumors and micrometastases. ACS Nano 7, 4221–4232 (2013). [DOI] [PMC free article] [PubMed] [Google Scholar]
- 11.Luke G. P., Myers J. N., Emelianov S. Y., Sokolov K. V., Sentinel lymph node biopsy revisited: Ultrasound-guided photoacoustic detection of micrometastases using molecularly targeted plasmonic nanosensors. Cancer Res. 74, 5397–5408 (2014). [DOI] [PMC free article] [PubMed] [Google Scholar]
- 12.Kievit F. M., et al. , Targeting of primary breast cancers and metastases in a transgenic mouse model using rationally designed multifunctional SPIONs. ACS Nano 6, 2591–2601 (2012). [DOI] [PMC free article] [PubMed] [Google Scholar]
- 13.Yang B., et al. , Single-cell phenotyping within transparent intact tissue through whole-body clearing. Cell 158, 945–958 (2014). [DOI] [PMC free article] [PubMed] [Google Scholar]
- 14.Chung K., et al. , Structural and molecular interrogation of intact biological systems. Nature 497, 332–337 (2013). [DOI] [PMC free article] [PubMed] [Google Scholar]
- 15.Renier N., et al. , iDISCO: A simple, rapid method to immunolabel large tissue samples for volume imaging. Cell 159, 896–910 (2014). [DOI] [PubMed] [Google Scholar]
- 16.Susaki E. A., et al. , Advanced CUBIC protocols for whole-brain and whole-body clearing and imaging. Nat. Protoc. 10, 1709–1727 (2015). [DOI] [PubMed] [Google Scholar]
- 17.Kubota S. I., et al. , Whole-body profiling of cancer metastasis with single-cell resolution. Cell Rep. 20, 236–250 (2017). [DOI] [PubMed] [Google Scholar]
- 18.Cuccarese M. F., et al. , Heterogeneity of macrophage infiltration and therapeutic response in lung carcinoma revealed by 3D organ imaging. Nat. Commun. 8, 14293 (2017). [DOI] [PMC free article] [PubMed] [Google Scholar]
- 19.Sindhwani S., et al. , Three-dimensional optical mapping of nanoparticle distribution in intact tissues. ACS Nano 10, 5468–5478 (2016). [DOI] [PubMed] [Google Scholar]
- 20.Sindhwani S., Syed A. M., Wilhelm S., Chan W. C. W., Exploring passive clearing for 3D optical imaging of nanoparticles in intact tissues. Bioconjug. Chem. 28, 253–259 (2017). [DOI] [PubMed] [Google Scholar]
- 21.Syed A. M., et al. , Three-dimensional imaging of transparent tissues via metal nanoparticle labeling. J. Am. Chem. Soc. 139, 9961–9971 (2017). [DOI] [PubMed] [Google Scholar]
- 22.Dobosz M., Ntziachristos V., Scheuer W., Strobel S., Multispectral fluorescence ultramicroscopy: Three-dimensional visualization and automatic quantification of tumor morphology, drug penetration, and antiangiogenic treatment response. Neoplasia 16, 1–13 (2014). [DOI] [PMC free article] [PubMed] [Google Scholar]
- 23.d’Esposito A., et al. , Computational fluid dynamics with imaging of cleared tissue and of in vivo perfusion predicts drug uptake and treatment responses in tumours. Nat. Biomed. Eng. 2, 773–787 (2018). [DOI] [PubMed] [Google Scholar]
- 24.Keren L., et al. , A structured tumor-immune microenvironment in triple negative breast cancer revealed by multiplexed ion beam imaging. Cell 174, 1373–1387.e19 (2018). [DOI] [PMC free article] [PubMed] [Google Scholar]
- 25.Saltz J., et al. ; Cancer Genome Atlas Research Network , Spatial organization and molecular correlation of tumor-infiltrating lymphocytes using deep learning on pathology images. Cell Rep. 23, 181–193.e7 (2018). [DOI] [PMC free article] [PubMed] [Google Scholar]
- 26.Coudray N., et al. , Classification and mutation prediction from non-small cell lung cancer histopathology images using deep learning. Nat. Med. 24, 1559–1567 (2018). [DOI] [PMC free article] [PubMed] [Google Scholar]
- 27.Esteva A., et al. , Dermatologist-level classification of skin cancer with deep neural networks. Nature 542, 115–118 (2017). [DOI] [PMC free article] [PubMed] [Google Scholar]
- 28.Chen C., et al. , “A template matching approach for segmenting microscopy images” in 2012 9th IEEE International Symposium on Biomedical Imaging (IEEE, Piscataway, NJ, 2012), pp. 768–771.
- 29.Gul-Mohammed J., Arganda-Carreras I., Andrey P., Galy V., Boudier T., A generic classification-based method for segmentation of nuclei in 3D images of early embryos. BMC Bioinformatics 15, 9 (2014). [DOI] [PMC free article] [PubMed] [Google Scholar]
- 30.Lou X., Koethe U., Wittbrodt J., Hamprecht F. A., “Learning to segment dense cell nuclei with shape prior” in 2012 IEEE Conference on Computer Vision and Pattern Recognition (IEEE, Piscataway, NJ, 2012), pp. 1012–1018.
- 31.Kingston B. R., 3D_met_NP_analysis. Github. https://github.com/BenKingston/3D_met_NP_analysis (2019). Deposited 6 May 2019.
- 32.Sommer C., Straehle C., Ullrich K., Hamprecht F. A., “Ilastik: Interactive learning and segmentation toolkit” in Eighth IEEE International Symposium on Biomedical Imaging (IEEE, Piscataway, NJ, 2011), pp. 230–233.
- 33.Miller M. A., et al. , Tumour-associated macrophages act as a slow-release reservoir of nano-therapeutic Pt(IV) pro-drug. Nat. Commun. 6, 8692 (2015). [DOI] [PMC free article] [PubMed] [Google Scholar]
- 34.Perrault S. D., Chan W. C. W., Synthesis and surface modification of highly monodispersed, spherical gold nanoparticles of 50-200 nm. J. Am. Chem. Soc. 131, 17042–17043 (2009). [DOI] [PubMed] [Google Scholar]
Associated Data
This section collects any data citations, data availability statements, or supplementary materials included in this article.


