Summary
Pancreatic ductal adenocarcinoma (PDAC) remains recalcitrant to all forms of cancer treatment and carries a dismal 5-year survival rate of 8%1. Inhibition of oncogenic KRAS (hereafter KRAS*), the earliest lesion in disease development that is present in >90% of PDAC, and its signaling surrogates has yielded encouraging preclinical results with experimental agents2-4. However, KRAS*-independent disease recurrence following genetic extinction of Kras* in mouse models anticipates the need for co-extinction strategies5,6. Multiple oncogenic processes are initiated at the cell surface, where KRAS* physically and functionally interacts to direct signaling essential for malignant transformation and tumor maintenance. Insights into the complexity of the functional surfaceome have been technologically limited until recently, and, in the case of PDAC, the genetic control of the function and composition of the PDAC surfaceome in the context of KRAS* signaling remains largely unexplored. Here, we developed an unbiased, functional target discovery platform to query KRAS*-dependent changes of the PDAC surfaceome, which uncovered syndecan-1 (SDC1) as a protein upregulated at the cell surface by KRAS*. Cell surface localization of SDC1 is essential for disease maintenance and progression, where it regulates macropinocytosis, an essential metabolic pathway that fuels PDAC cell growth. Thus, our study forges a mechanistic link between KRAS* signaling and a targetable molecule driving nutrient salvage pathways in PDAC and validates oncogene-driven surfaceome annotation as a strategy to identify cancer-specific vulnerabilities.
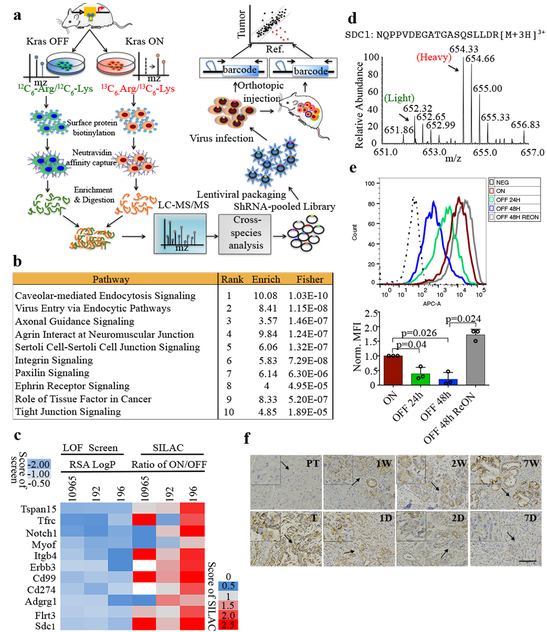
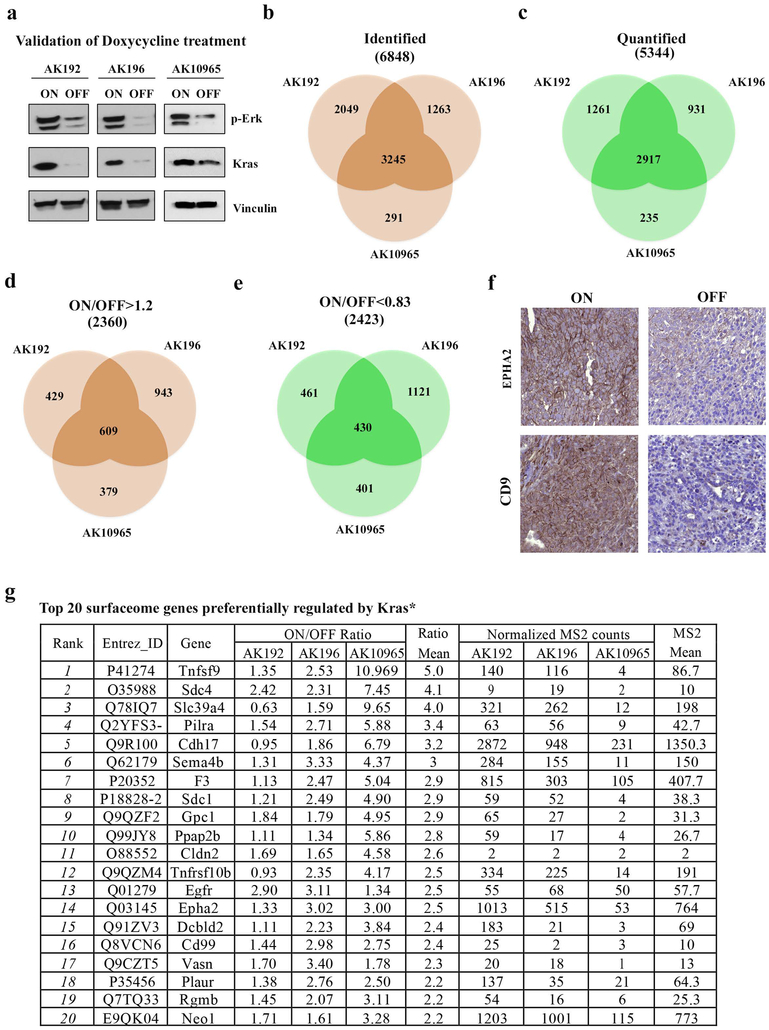
To annotate changes in cell surface proteins driven by Kras* signaling, we employed a doxycycline-inducible Kras* PDAC mouse model (hereafter, iKras*) to acutely induce and thereafter extinguish the activated oncogene, KrasG12D7. SILAC-based mass spectrometry was used to identify proteome changes induced by Kras* extinction in three independent cell culture isolates from iKras* tumors. Briefly, cells were labeled with either heavy isotope 13C6-arginine and 13C6-lysine or light 12C6-arginine and 12C6- lysine, and surface proteome changes were quantified via LC-MS/MS 24 hours after doxycycline withdrawal (Fig.1a), a time point showing a significant loss of Ras activity (Extended Data Fig.1a) without obvious changes in cell morphology or proliferation rate. Comparison of Kras* ON versus Kras* OFF paired samples (Extended Data Fig.1b-e) identified 221 differentially expressed plasma membrane proteins8,9 (http://compartments.jensenlab.org) (196 upregulated and 25 downregulated (Supplementary Table 1, 2)), suggesting Kras* primarily drives surface protein enrichment versus depletion. The top 20 species most significantly upregulated by Kras* (Extended Data Fig.1f, g) represent a broad spectrum of known effectors, several of which are known to be upregulated and have a functional role in PDAC pathogenesis. Our proteomic analysis also identified many cell surface-associated proteins regulated by Kras*. Ingenuity Pathway Analysis (IPA) revealed that many Kras*-upregulated surfaceome proteins are involved in biological processes activated in PDAC, including the axonal guidance signaling pathway10 (Fig.1b and Supplementary Table 3), supporting the notion that Kras* is a major driver of molecular reprogramming in PDAC.
Figure 1. Functional surfaceome analysis identified SDC1 as a KRAS*-dependent surface protein important for tumor maintenance.
a, Experimental design for the functional surfaceome analysis. Differentially expressed surface proteins upon KrasG12D inactivation were identified via SILAC-based proteomic analysis. In vivo loss-of-function screening was subsequently conducted with a custom barcoded lentiviral shRNA library targeting the Kras*-dependent surfaceome. Depletion was observed relative to reference population. b, Top 10 canonical signaling pathways identified with IPA analysis of differentially expressed surface proteins upon Kras* activation; n=3 biologically independent samples, enrichment score (Enrich) and P-value (two-sided Fisher) reported. c, Rank of common top-scoring hits from three independent iKras p53L/+ tumor cell lines: RSA/LogP-based cutoff is heatmapped against corresponding quantification rank from SILAC-based proteomic analysis. d, Heavy and light spectra of representative SDC1 peptide show membrane SDC1 in presence (Heavy) or absence (Light) of KrasG12D in iKras p53L/+ tumor cells. e, SDC1 levels of iKras p53L/+ tumor cells in presence (ON) or absence (OFF) of doxycycline were measured by FACS analysis (Top) and quantification of fluorescence intensity is shown (Bottom). REON: cells were grown in absence of doxycycline for 48 hours followed by doxycycline treatment for 24 hours (n=3 biological replicates; data are mean + s.d.; P-values were determined by paired two-sided Student’s t-test). f, Three-week-old iKras p53L/+ mice received doxycycline-containing water for 1/3/7 weeks (W) to induce premalignant lesions or for 9 weeks to induce invasive PDAC (T), then doxycycline was withdrawn for 1/2/7 days (D). SDC1 in pancreatic or tumor tissues was analyzed by IHC (scale bar: 200 μm). Arrows indicate areas magnified in the inserts. d-f: Representative experiments from three independent experiments.
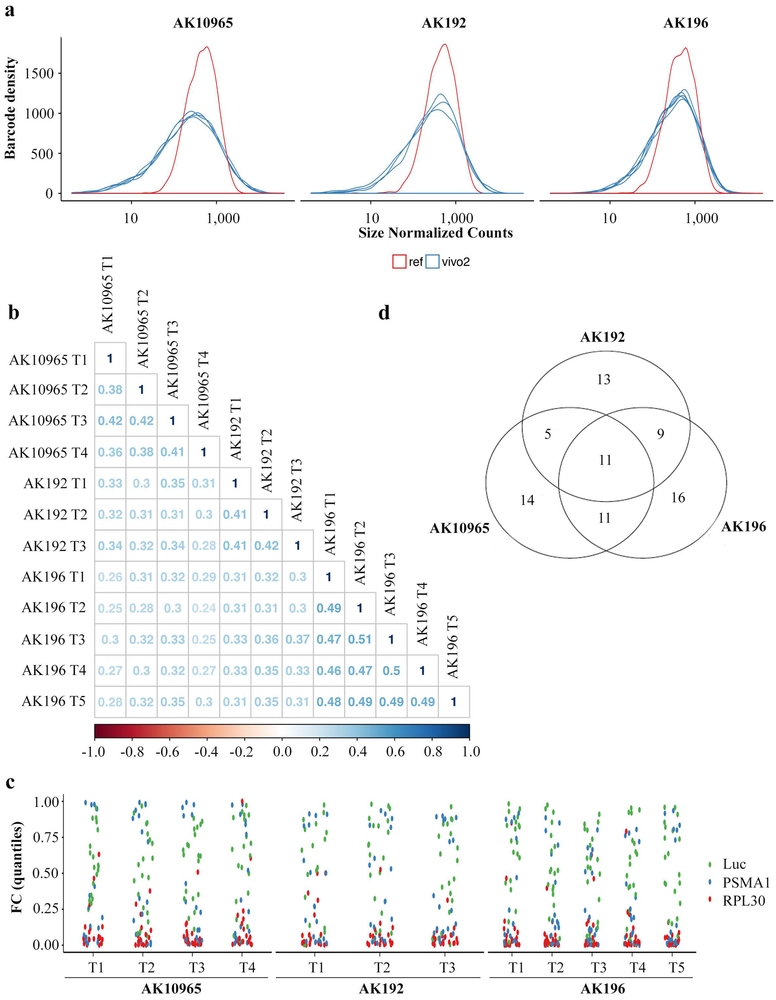
To assess the functional relevance of our findings in human disease, we compared the mouse surfaceome data with human surfaceome data from 11 PDAC cell lines11. We chose 110 proteins that are potentially regulated by Kras* and also enriched in human PDAC cells (Supplementary Table 1 and Supplementary Table 4), as well as 37 surfaceome genes highly expressed in human PDAC cells (Supplementary Table 4) to generate a pooled, lentiviral shRNA library. We conducted an in vivo loss-of-function screen using a previously described barcoding methodology12 in orthotopically implanted tumors derived from three iKras* murine cell lines (Fig.1a). Next-generation sequencing (NGS) analysis revealed full representation of library complexity, high correlation among tumor replicates and expected behavior of positive (PSMA1, RPL30) and negative (Renilla luciferase (Luc)) controls (Extended Data Fig.2a-c). The screens uncovered 79 genes that were significantly depleted in at least one of the three models, of which 36 were common between at least two models (Extended Data Fig.2d and Supplementary Table 4). Among 11 hits depleted in all three models, Sdc1, a member of the heparin sulfate proteoglycan (HSPG) family, was also among the most significantly enriched in the plasma membrane during Kras* expression (Fig.1c and Supplementary Table 4). Further, among the top ten most-enriched surfaceome proteins modulated by Kras*, three belonged to the HSPG family (Sdc1, Sdc4 and Gpc1) (Extended Data Fig.1g), prompting us to select Sdc1 as a top-priority candidate that may mediate Kras*-driven cellular reprogramming in PDAC.
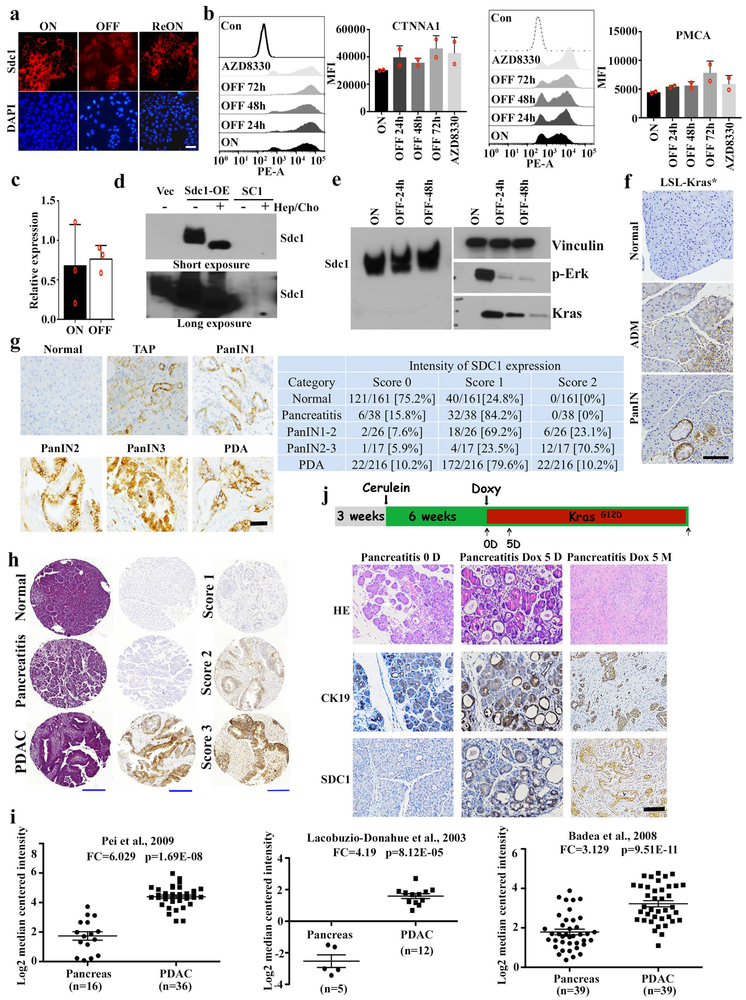
Representative MS spectra data indicated that Sdc1 membrane expression was upregulated in Kras* ON versus OFF conditions (Fig.1d). This was validated by immunofluorescence and flow cytometry analysis, where Kras* extinction led to a rapid decrease of Sdc1 membrane expression that was reversed upon re-expression of Kras* (Fig.1e and extended Data Fig.3a). Membrane localization of other surface proteins, such as α-catenin (CTNNA1) and calcium pump pan PMCA ATPase, was not altered upon Kras* inactivation, suggesting a specific effect on Sdc1 (Extended Data Fig.3b). Kras* inactivation did not affect Sdc1 mRNA abundance or total protein expression (Extended Data Fig.3c-e). In vivo, Kras* expression in iKrasG12D p53L/+ PDAC model induced Sdc1 membrane enrichment in premalignant lesions and advanced tumors, while its extinction in established tumors resulted in depletion of Sdc1 surface expression (Fig.1f). Comparable induction of membrane-localized Sdc1 was observed in the LSL-KrasG12D model (KC model) (Extended Data Fig.3f).
In a primary human PDAC tissue array, we detected SDC1 in premalignant lesions (early PanINs) and in tumor-adjacent lesions reminiscent of chronic pancreatitis, as well as in advanced premalignant lesions and invasive carcinomas (Extended Data Fig.3g-h). Several published human microarray datasets have reported significantly increased SDC1 expression in PDAC tissue compared to normal pancreas (Extended Data Fig.3i), implicating SDC1 in PDAC pathogenesis. Enrichment of surface SDC1 in very early disease could result from oncogenic signaling or inflammatory responses associated with pancreatitis. To differentiate, we induced chronic pancreatitis in iKras* mice with caerulein, followed by doxycycline treatment to induce Kras* expression. While metaplastic lesions were similarly positive for the ductal marker CK19 before and after doxycycline treatment, Sdc1 was induced mostly upon oncogene induction, but not by caerulein (Extended Data Fig.3j), establishing a definitive correlation between Kras* and Sdc1 expression in PDAC development.
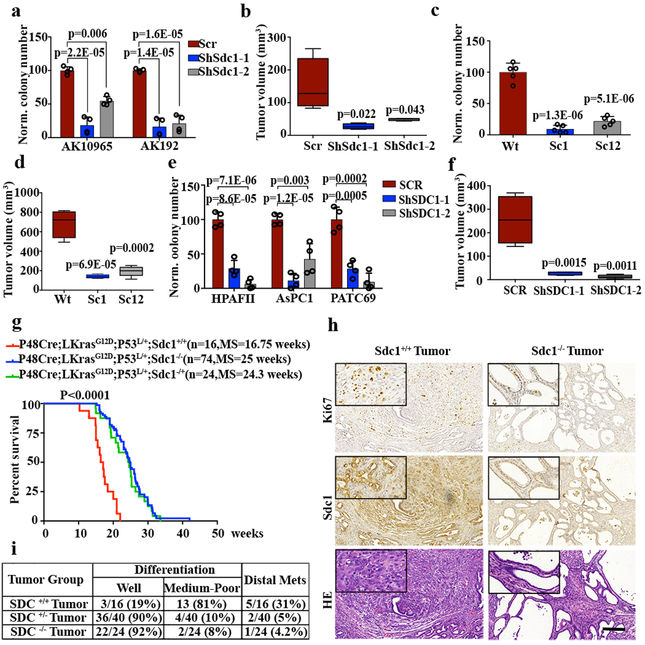
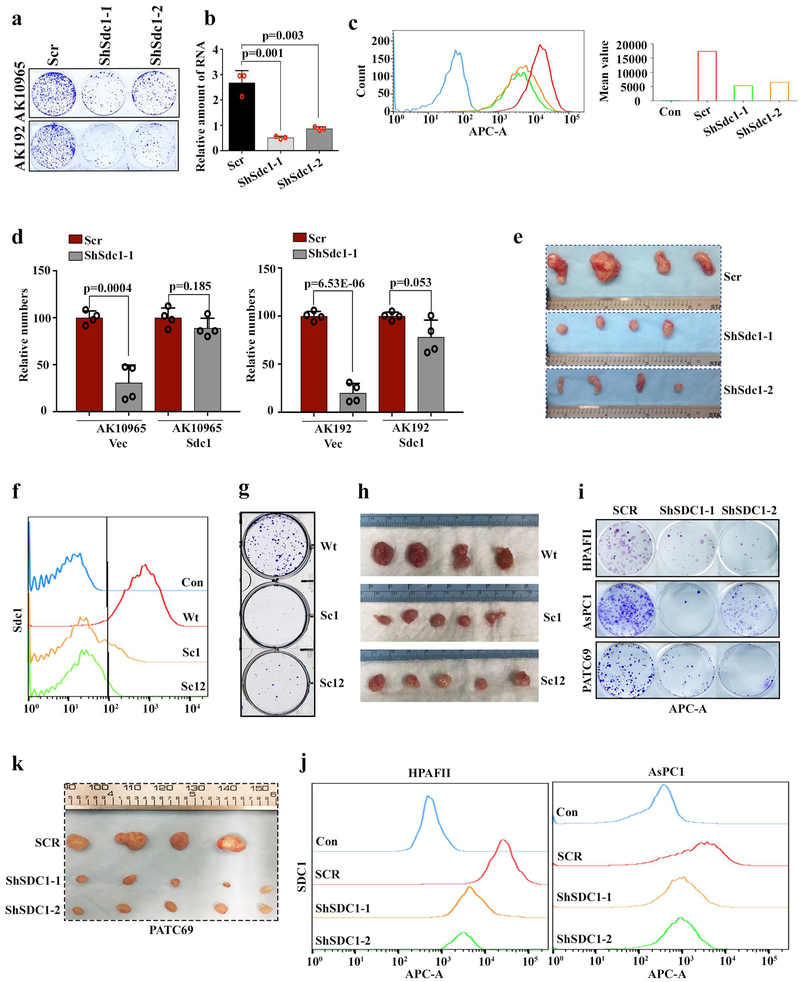
To determine whether Sdc1 is required for disease progression, we depleted Sdc1 in independent iKras* cultures. Sdc1 depletion with shRNAs dramatically impaired colony-forming ability (Fig.2a and Extended Data Fig.4a-c), which was rescued with the expression of shRNA-resistant Sdc1 (Extended Data Fig.4d). Sdc1 depletion also significantly inhibited tumor growth of subcutaneous xenografts (Fig.2b and Extended Data Fig.4e). Additionally, CRISPR-mediated Sdc1 deletion in iKras* tumor cells suppressed colony formation and tumorigenicity in vivo (Fig.2c, d and Extended Data Fig.4f-h). Consistent with murine PDAC models, shRNA-mediated depletion of SDC1 in two established human PDAC cell lines, AsPC1 and HPAFII, as well as in a patient-derived xenograft (PDX) model (PATC69), significantly impaired colony formation and suppressed tumor growth in vivo (Fig.2e, f and Extended Data Fig.4i-k).
Figure 2. SDC1 is required for tumorigenic activity of KRAS*-driven pancreatic cells.
a, Quantification of representative clonogenic assay for two independent iKras p53L/+ PDAC cells infected with Sdc1-targeting or scrambled (Scr) shRNA. b, iKras p53L/+ cells were infected with Sdc1-targeting or SCR shRNA and subcutaneously injected into nude mice (n=4). Tumor volumes were measured. c-d, Clonogenic assay (c) and subcutaneous tumor growth in nude mice (n=5) for two independent clones of iKras p53L/+ PDAC cells with Double Nickase-mediated Sdc1 deletion. e, Quantification of representative clonogenic assay of HPAFII, ASPC1, or PATC69 (PDX) infected with SDC1-targeting or SCR shRNA. f, Subcutaneous tumor growth in nude mice injected with PATC69 harboring SDC1-targeting (n=5) or SCR shRNA (n=4). g, Kaplan–Meier survival analysis for mice of indicated genotypes. Cohort size is indicated. P-value was calculated with Log-rank (Mantel-Cox) test (conservative). h-i, Gross image, HE staining, IHC staining (Sdc1 and Ki67) (h) and pathological features as well as metastasis frequencies (i) from pancreatic tumors of indicated genotypes (scale bar: 200 μm). Experiments in (h) were repeated ≥2 times independently with similar results. a, c, e: Experiments were repeated at least twice with similar results; mean + s.d. was plotted; b, d, f: data are mean + s.d.; P-values were determined by unpaired two-sided Student’s t-test.
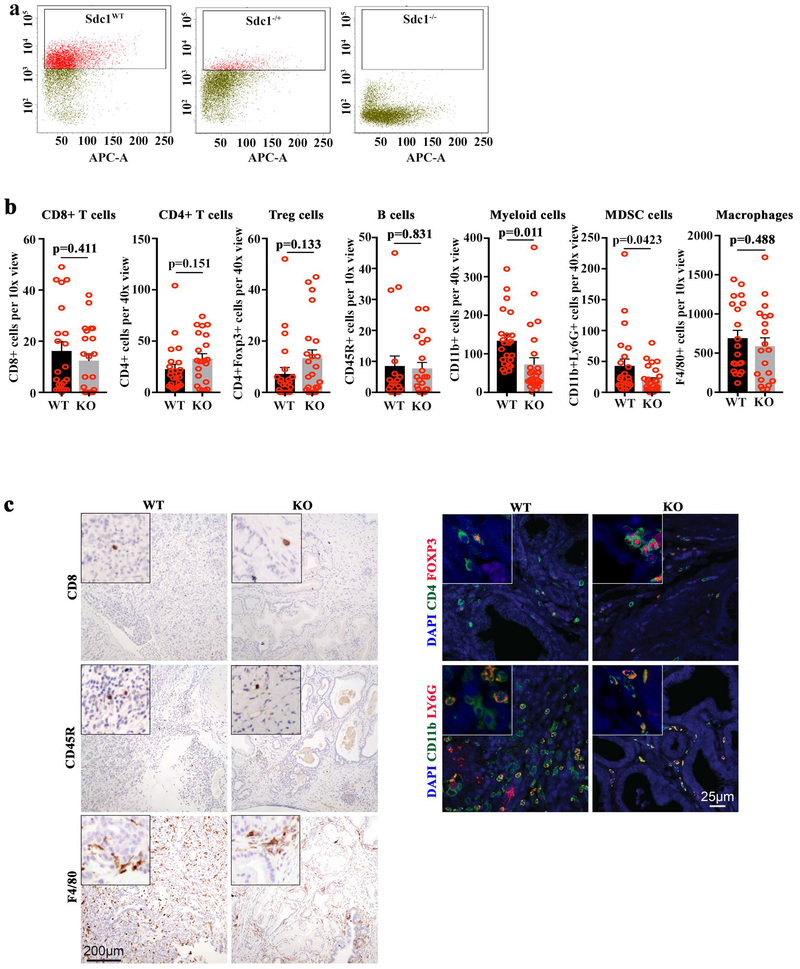
We investigated the role of SDC1 in KRAS*-driven PDAC development by generating p48Cre_LSL-KrasG12D p53L/+ (KPC) mice homozygous or heterozygous for the Sdc1-null allele. As reported previously13, Sdc1−/− mice showed normal postnatal development. In the PDAC model, Sdc1 deficiency prolonged survival relative to wild type (Fig.2g; 25 versus 16.75 weeks, respectively, p<0.0001) and, notably, median survival was also comparably extended in Sdc1+/− mice (24.3 weeks), suggesting a haploinsufficient phenotype. Flow cytometry confirmed Sdc1 expression in Sdc1+/− tumors, albeit at significantly reduced levels relative to Sdc1+/+ tumors (Extended Data Fig.5a). Morphologically, Sdc1−/− and Sdc1+/− tumors exhibited more well-differentiated ductal features accompanied by cystic lesions compared to Sdc1+/+ tumors. Both Sdc1−/− and Sdc1−/+ tumors showed decreased tumor cell proliferation (Fig.2h and data not shown) and less aggressive phenotypes, with distal metastases to lung or liver observed in 5% and 4.2% of mice, respectively, compared to 31% in Sdc1+/+ animals (Fig.2i). Interestingly, Sdc1−/− knockout tumors exhibited significantly decreased infiltration of myeloid-derived suppressor cells versus Sdc1+/+ lesions (Extended Data Fig.5b, c).
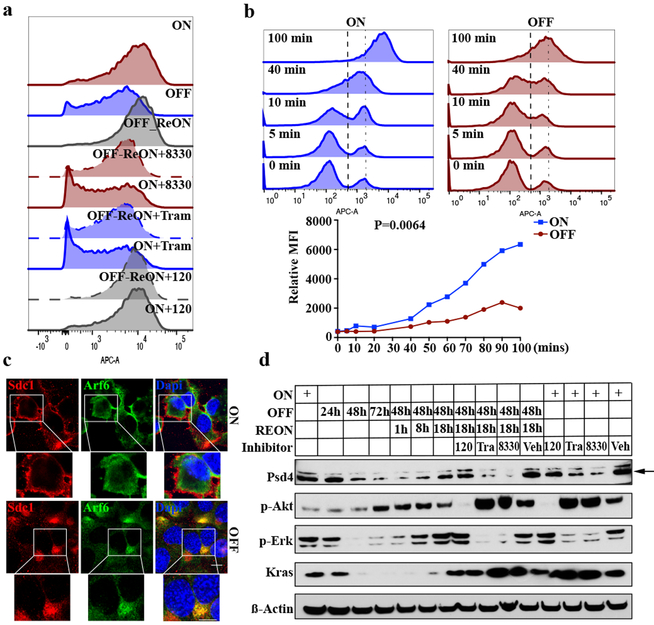
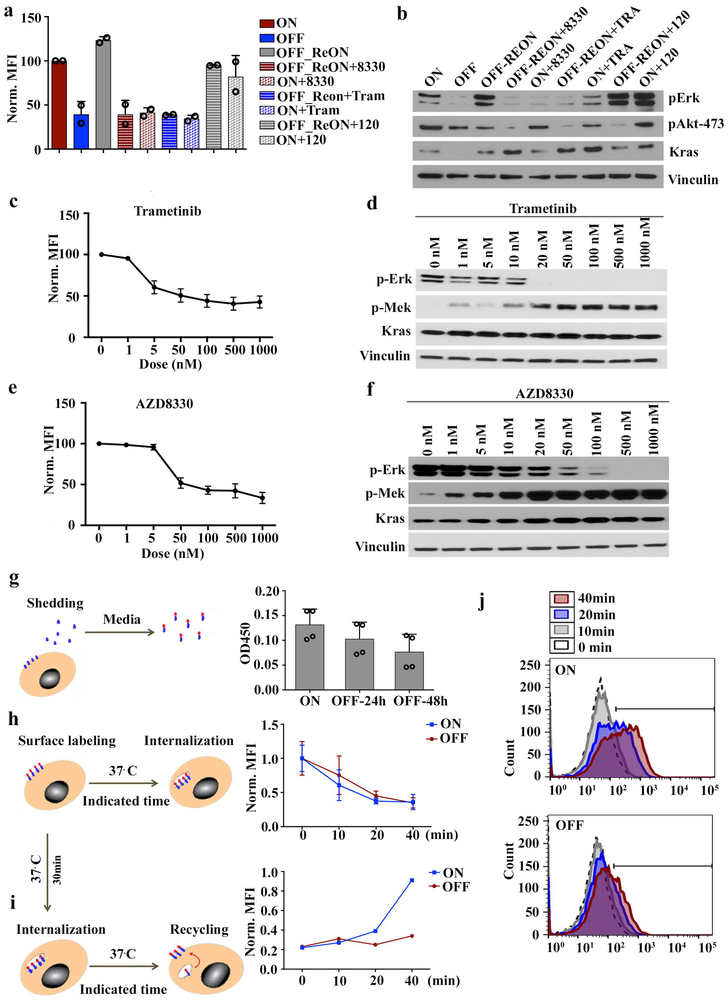
We investigated the requirement of major KRAS* surrogate for the surface expression of SDC1. Treatment of iKras* cells with either of two distinct MEK inhibitors (AZD8330, trametinib), but not a pan-PI3K inhibitor (BKM120), decreased membrane Sdc1 expression in a dose-dependent manner, similar to the effect of Kras* extinction (Fig.3a and Extended Data Fig.6a-f). MEK inhibition also blocked membrane re-localization of Sdc1 upon KrasG12D re-activation (Fig.3a and Extended Data Fig.6a, b), indicating that KRAS* drives SDC1 membrane localization through the MAPK pathway.
Figure 3. KRAS* induces SDC1 membrane recycling through MAPK-PSD4-ARF6 axis.
a-d, iKras p53L/+ PDAC cells were grown in presence (ON) or absence (OFF) of doxycycline for 48 hours or indicated times. REON: cells were grown in absence of doxycycline for 48 hours followed by doxycycline treatment for 24 hours. Treatment of ON or REON samples with trametinib (50 nM), AZD8330 (100 nM), or BKM120 (100 nM) for 16-18 hours is indicated. (a) Surface Sdc1 was measured via FACS. (b) Cells were detached with trypsin to remove Sdc1 ectodomain and re-suspended in culture medium. (Top) Surface Sdc1 was labeled with anti-Sdc1 antibody at indicated times following re-suspension and measured via FACS. (Bottom) Mean Sdc1 levels. (c) Cells grown in presence (ON) or absence (OFF) of doxycycline for 48 hours were subjected to IF staining for Sdc1 (red), Arf6 (green) and DAPI (blue) (scale bar: 20 μm). (d) Cell lysates were immunoblotted for Psd4, phosphor-Akt, phosphor-Erk, Kras and ß-Actin. a-d: Data are representative of two independent experiments with similar results.
Membrane SDC1 expression is primarily modulated via shedding14 (the proteolytic cleavage of the N-terminal domain into the extracellular space) and endocytosis15 (internalization through the endocytic route, which is balanced by endosomal recycling that return much of the endocytosed proteins back to cell surface)16. Using ELISA to detect shed Sdc1 from iKras* cells upon doxycycline withdrawal, we determined that Kras* extinction inhibited versus enhanced Sdc1 shedding in a time-dependent manner (Extended Data Fig.6g). We next used monovalent anti-syndecan antibodies, which are internalized in a syndecan-dependent manner and with comparable kinetics as bivalent antibodies16, with flow cytometry to measure changes in Sdc1 internalization and recycling rates upon oncogene extinction. Whereas Kras* extinction did not affect Sdc1 internalization (Extended Data Fig.6h), the rate of Sdc1 recycling back to the plasma membrane was significantly inhibited in the absence of Kras* (Extended Data Fig.6i, j). To validate this result, we removed the ectodomain of preexisting cell surface-exposed Sdc1 by trypsinization and then measured trafficking of endocytosed Sdc1 to the cell surface using an antibody recognizing the Sdc1 ectodomain. Recovery of surface Sdc1 expression levels was significantly delayed upon Kras* inactivation (Fig.3b), further supporting that Kras* promotes Sdc1 membrane localization by enhancing Sdc1 recycling.
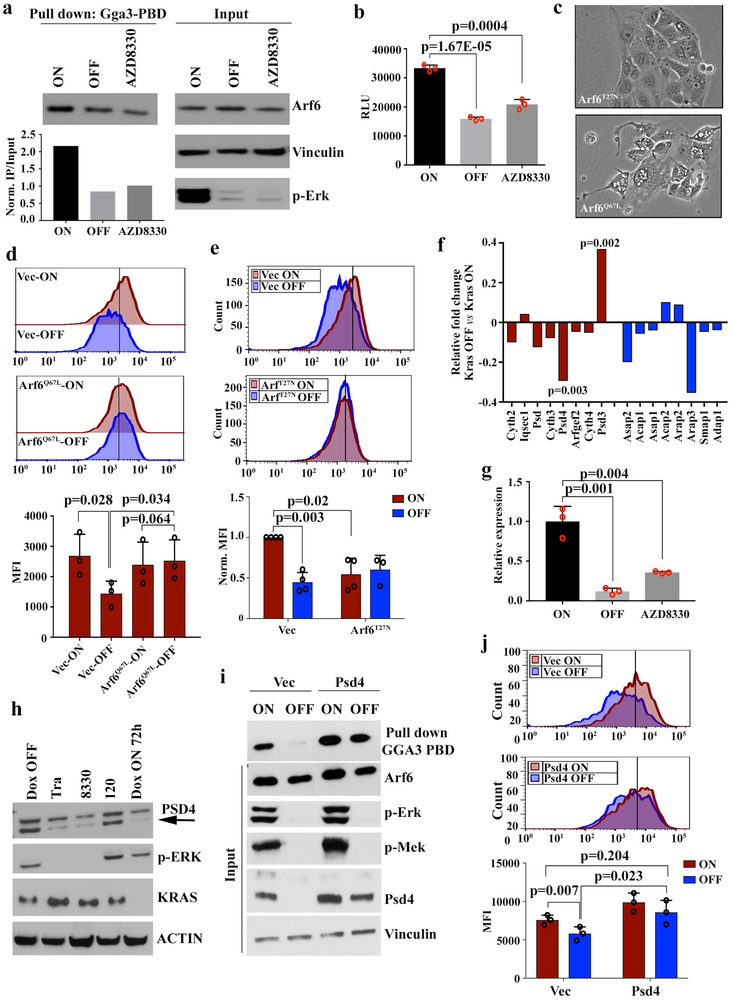
Trafficking of syndecan proteins to the plasma membrane is orchestrated by the small GTPase, ARF616. Interestingly, Kras* inactivation resulted in redistribution of Sdc1 from the cell surface to the juxtanuclear Arf6 endocytic recycling compartment (Fig.3c), a characteristic of reduced Arf6 activity16. Indeed, as previously reported17, Arf6 activity was suppressed upon Kras* extinction or MEK inhibitor treatment (Extended Data Fig.7a). Type I phosphatidylinositol 4-phosphate 5-kinase (PIPK) is a downstream effector of ARF618, and PIPK activity was also inhibited upon Kras* inactivation or MEK inhibition (Extended Data Fig.7b). Moreover, expression of the constitutively active Arf6Q67L mutant in iKras* cells resulted in the generation of membrane ruffling and rescued the decrease in Sdc1 membrane localization upon Kras* extinction, whereas expression of the dominant negative Arf6T27N inhibited Sdc1 membrane localization in the presence of Kras* (Extended Data Fig.7c-e). We thus conclude that KRAS* signaling stimulates ARF6 activity to promote SDC1 trafficking to the plasma membrane.
ARF6 activity is controlled by specific guanine nucleotide exchange factors (GEFs) and GTPase-activating proteins (GAPs). We mined the expression profiles of iKras* tumor cells upon Kras* extinction7 for Arf-specific GEFs and GAPs and found that expression of the Arf6-specific GEF, Pleckstrin and Sec7 Domain-containing 4 (Psd4), was significantly decreased upon Kras* extinction (Extended Data Fig.7f). This was validated by qPCR, where both Kras* extinction and MEK inhibitor treatment dramatically inhibited Psd4 expression (Extended Data Fig.7g). Moreover, Psd4 protein levels decreased in a time-dependent manner upon Kras* extinction and were restored upon re-induction of Kras* expression (Fig.3d). MEK inhibition, but not PI3K inhibition, blocked the increase in Psd4 protein upon Kras* re-expression. Similarly, genetic KRAS* depletion or MEK inhibitor treatment in human PDAC MiaPaCa-2 cells both decreased PSD4 levels, whereas PI3K inhibition had no effect (Extended Data Fig.7h). Ectopic Psd4 expression in iKras* cells rescued the suppressed Arf6 activity (Extended Data Fig.7i) and the decreased surface Sdc1 expression upon Kras* extinction (Extended Data Fig.7j), demonstrating that KRAS* regulates SDC1 surface localization through the PSD4-ARF6 axis.
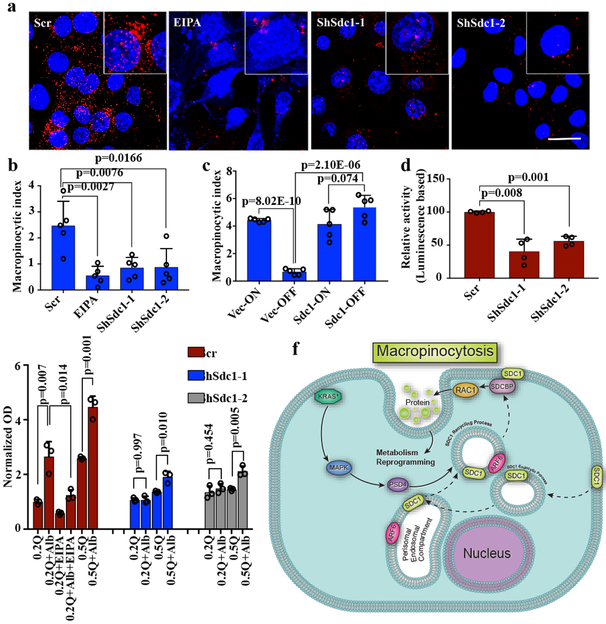
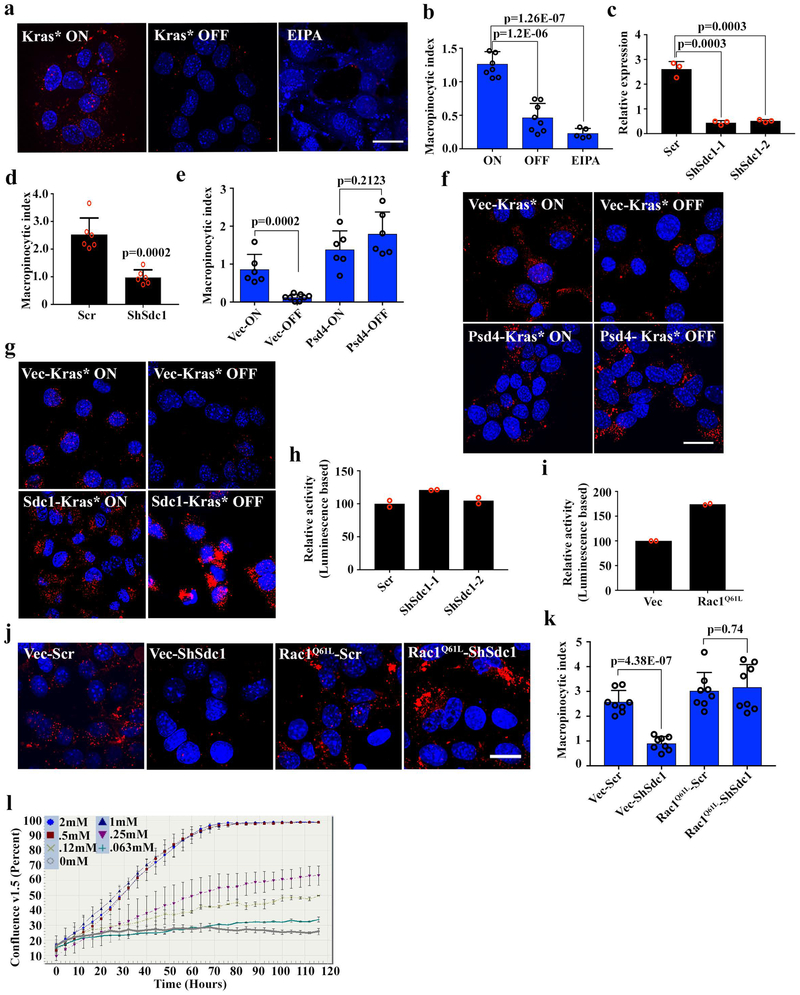
The ability to stimulate macropinocytosis, which is a regulated form of endocytosis, is a distinctive feature of KRAS* activation19, and PDAC cells harboring KRAS* rely on increased macropinocytosis for nutrient salvage to sustain uncontrolled growth20. Macropinocytosis was also among the enriched pathways identified by IPA of the Kras*-regulated surfaceome (Supplementary Table 3). These data, coupled with reports that EFA6-mediated ARF6 activation can induce formation of plasma membrane protrusions and macropinocytosis21,22, prompted us to investigate whether the KRAS*-dependent surface localization of SDC1 via the PSD4-ARF6 axis might regulate macropinocytosis. Consistent with previous findings20, iKras* tumor cells exhibited vast levels of macropinocytosis, as measured by tetramethylrhodamine-labeled dextran uptake. Macropinocytosis was dramatically inhibited upon Kras* inactivation or treatment with the micropinocytosis inhibitor EIPA (Extended Data Fig.8a, b), as well as in Sdc1-depleted mouse PDAC cells derived from iKras* or KPC models (Fig.4a, b and Extended Data Fig.8c, d). As anticipated, either overexpression of Sdc1 or Psd4 attenuated the decrease in macropinocytosis upon Kras* extinction (Fig.4c and Extended Data Fig.8e-g), supporting SDC1 membrane localization controlled by PSD4-ARF6 as an essential mechanism by which KRAS* drives macropinocytosis in PDAC.
Figure 4. SDC1 is critical for macropinocytosis in KRAS*-driven PDAC cells.
a-b, Macropinocytosis was visualized with TMR-dextran (scale bar: 20 μm) (a) and quantified (b) (n=5 random areas) in iKras* p53L/+ tumor cells infected with Sdc1-targeting or scrambled (Scr) shRNA. EIPA (50 μM) treatment served as positive control. Data are representative of three independent experiments with similar results. c, iKras p53L/+ tumor cells stably expressing SDC1 or empty vector were grown in the presence (ON) or absence (OFF) of doxycycline for 48 hours. Macropinocytosis index was visualized with TMR-dextran and quantified (n=5 random areas). d, Rac1 activity was measured by G-LISA activation assay in iKras* p53L/+ PDAC cells infected with Sdc1-targeting or scrambled (Scr) shRNA (n=4 biological replicates). e, iKras* p53L/+ PDAC cells were infected with Sdc1-targeting or scrambled (Scr) shRNA and grown in medium containing 0.2 or 0.5 mM glutamine, in the presence or absence of albumin. Cell proliferation was monitored for 10 days; data presented as relative percentage of remaining cells (n=3 biological replicates). f, Proposed mechanism of KRAS-MAPK-PSD4-ARF6 driven recycling pathway to mediate SDC1 membrane localization and macropinocytosis in KRAS*-dependent PDAC cells. b-e. Data are mean + s.d.; P-values were determined by unpaired two-sided Student’s t-test.
The small GTPase Rac1 plays a crucial role in the formation of initial membrane ruffles and macropinocytosis23. Rac1 activity was dramatically inhibited in Sdc1-depleted iKras* cells (Fig.4d), while RhoA activity remained unaffected (Extended Data Fig.8h). Moreover, ectopic expression of constitutively active Rac1 (Rac1Q61L) in Sdc1-depleted iKras* tumor cells rescued macropinocytosis activity (Extended Data Fig.8i-k), supporting an essential role for Rac1 in Sdc1-mediated macropinocytosis.
An essential function of macropinocytosis in PDAC cells is to uptake proteins from the extracellular space to supply amino acids, including glutamine, to fuel metabolism20. Correspondingly, we found that culturing iKras* cells in low-glutamine medium (≤0.5 mM) resulted in decreased proliferative capacity (Extended Data Fig.8l). Albumin is uptaken by cells via micropinocytosis and can rescue cell proliferation in low-glutamine conditions; thus it can be used to functionally measure macropinocytosis20. Sdc1 depletion reduced the effectiveness with which albumin rescued cell proliferation in iKras* tumor cells grown in low-glutamine conditions (Fig.4e), providing additional support of the critical role of Sdc1 to maintain macropinocytosis in PDAC cells.
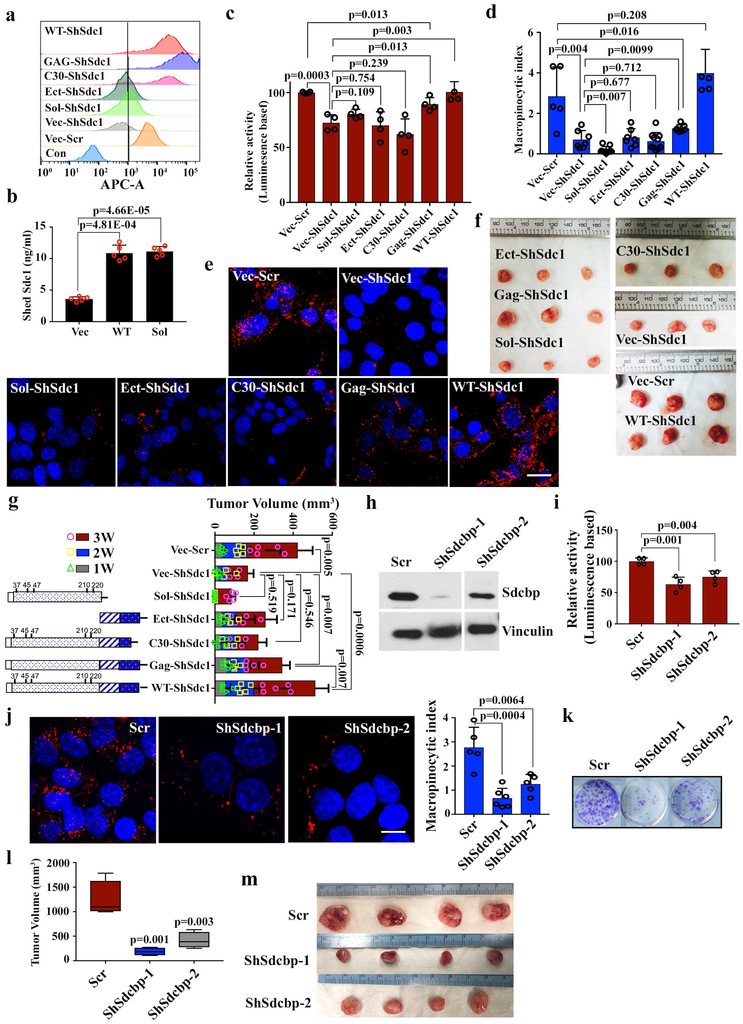
To identify Sdc1 domains required for Rac1 activation and macropinocytosis, we constructed a series of Sdc1 truncation mutants24,25 that were expressed on the cell surface, except for soluble Sdc1 protein, which was detected in culture medium because it lacks the transmembrane and intra-cellular domains (Extended Data Fig.9a, b). As expected, expression of full-length Sdc1 fully rescued Rac1 activity in Sdc-depleted cells. In contrast, soluble Sdc1 failed to reactivate Rac1 (Extended Data Fig.9c), indicating the membrane localization of SDC1 is essential for macropinocytosis. Deletion of Sdc1 extra-cellular domain (ΔEct) also abolished its activity toward Rac1. However, the GAG mutant with mutated heparan sulfate modification sites exerted a partial rescue effect (Extended Data Fig.9c), suggesting heparin sulfate may not be essential for this function. Interestingly, the C30 mutant (deletion of the C-terminal 30 amino acids) also failed to rescue Rac1 activity in Sdc1-depleted cells (Extended Data Fig.9c). The mutant constructs exhibit similar ability to restore macropinocytosis and rescue the in vivo tumor growth of Sdc1-deficient cells (Extended Data Fig.9d-g). The Sdc1 C-terminus binds to the PDZ-domain containing protein, syntenin, and this complex is involved in assembly of multimers that organize intracellular signal transduction pathways26. Ablation of syntenin significantly inhibited Rac1 activity, suppressed macropinocytosis, and inhibited clonogenic activity and tumor growth in Kras*-driven PDAC cells (Extended Data Fig.9h-m), suggesting that the syndecan1/syntenin complex is required to mediate extracellular-intracellular signaling to promote macropinocytosis and tumor growth in this context.
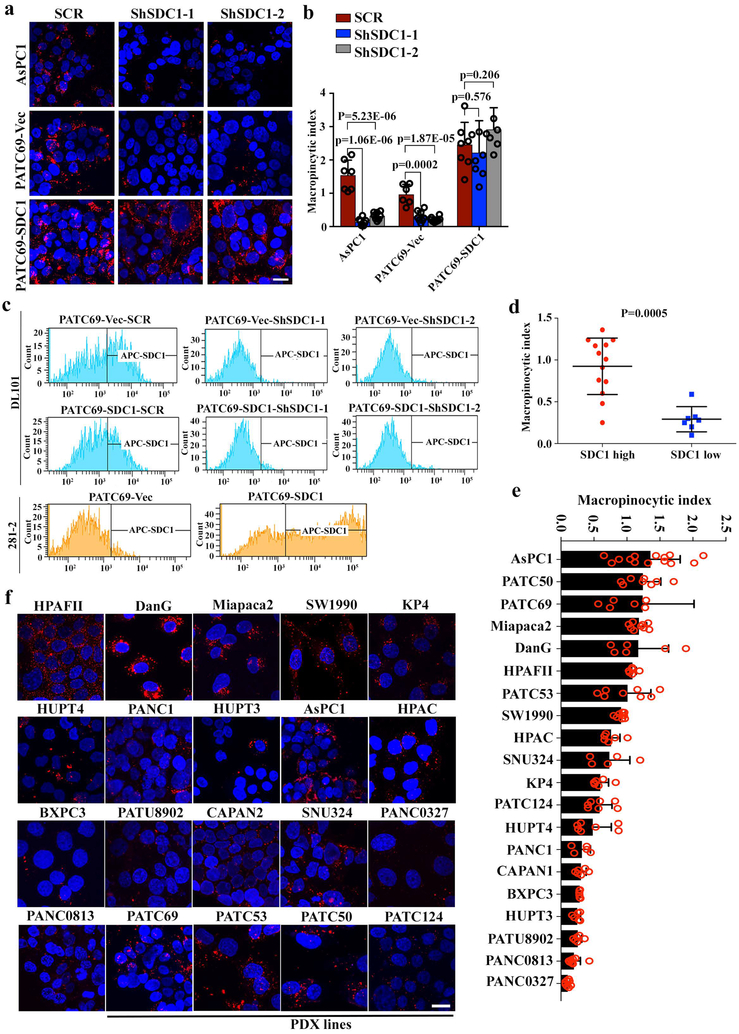
Finally, we validated the role of SDC1 in human AsPC1 and PDX-derived PATC69 cells, where significantly impaired macropinocytosis was observed upon SDC1 depletion, which was rescued by ectopic expression of shRNA-resistant mouse Sdc1 (Extended Data Fig.10a-c). Evaluation of macropinocytosis across 20 KRAS*-driven human PDAC models demonstrated that SDC1 abundance at the membrane was correlated with macropinocytosis (Extended Data Fig.10d-f). Thus, our data across a variety of models highlight the requirement for SDC1 to mediate macropinocytosis in KRAS*-driven PDAC (Fig.4f).
Although activation of macropinocytosis by KRAS* in transformed cells has long been established19, the molecular mechanisms controlling this process have remained elusive. Here we provide evidence that SDC1 serves as a KRAS* effector that induces macropinocytosis in PDAC. To date, pharmacological inhibition of macropinocytosis has not been accomplished; the critical role for SDC1 to regulate macropinocytosis in KRAS*-driven PDAC invites exploration of SDC1 targeting for therapeutic intervention. Monoclonal antibodies directed at SDC1 (CD138) are being tested for activity in multiple myeloma as antibody-drug conjugates, proving the feasibility of developing targeted therapeutics against this molecule.
Experimental Procedures
Transgenic Mice
TetO_Lox-Stop-Lox-KrasG12D (tetO_LKrasG12D), p48-Cre, Rosa26-Lsl-rtTA-Ires-Gfp (Rosa_rtTA) and Trp53L strains were donated by Dr. DePinho and described previously27,28. KrasLSLG12D mice were obtained through the Jackson Laboratory. SDCL mice were a generous gift from Dr. Bernfield29. Mice were interbred and maintained on FVB/C57Bl6 hybrid background in pathogen-free conditions at The University of Texas MD Anderson Cancer Center. Animals of both sexes are used in the experiments. Mice were fed with doxycycline water (doxycycline 2g/l, sucrose 20 g/l) where indicated. All manipulations were approved under Institutional Animal Care and Use Committee (IACUC) protocol 00001238. The maximal tumor size allowed by IACUC is 1.5cm in diameter.
SILAC based surface proteomic analysis
Cell lines derived from primary culture of the iKras* PDAC mouse model were grown in RPMI1640 (Gibco) containing 10% of dialyzed FBS (Invitrogen) and 1% penicillin/streptomycin cocktail for seven passages, with 13C-lysine and 13C-arginine for Kras-on cells and with regular lysine and arginine for Kras-off cells according to standard SILAC protocol30. The detailed procedure of enrichment of cell surface proteins is described in Extended Experimental Procedures.
Library design and construction
The custom library of the KRAS-related surfaceome was constructed by using chip-based oligonucleotide synthesis and cloned into the pRSI16 lentiviral vector (Cellecta) as a pool. The shRNA sequence includes two G/U mismatches in the passenger strand, a 7-nt loop, and a 21-nt targeting region. Targeting sequences were designed using a proprietary algorithm (Cellecta). The oligo corresponding to each shRNA was synthesized with a unique molecular barcode (18 nucleotides) for measuring representation by NGS. For each gene, 10 to 12 different shRNAs were designed and included in the surfaceome library.
In vivo shRNA screens
We performed the in vivo screen in an orthotopic xenograft mouse model of PDAC. The detailed screen procedure is described in Extended Experimental Procedures.
Xenograft studies
Xenograft studies were carried out in NSG mice or NCr Nude mice (Taconic) and were approved by the MD Anderson IACUC under protocol number 00001238. Details of the subcutaneous and orthotopic xenograft studies are listed in Extended Experimental Procedures.
Screen hit analysis
Read counting was performed as previously described31. Briefly, Illumina base calls were processed using CASAVA (v.1.8.2), and resulting reads were processed using our in-house pipeline. Raw FASTQ files are filtered for a 4-bp spacer (CGAA) starting at the 18th base allowing for one mismatch, such that only reads amplified using above mentioned PCRs are used for further processing. Then, 23–40 bp of the above reads for targeting libraries, and 1–18 bp for non-targeting library were extracted, and the number of reads aligned to each barcode was counted using SAMtools. Read counts were normalized for the amount of sequencing reads retrieved for each sample using library size normalization (to 100 million reads). Using normalized counts, each sample was compared with its respective reference and a Log2 fold change (FC) was calculated. RSA was used to summarize the effect of knockdown at gene level.
Code availability
Code for screen hit analysis are available upon request.
CRISPR-Cas9D10A-nickase-based knockout
Cells was transfected with plasmids containing Cas9D10A and Sdc1 targeting sgRNAs (Santa cruz). After 2 μg/ml puromycin selection for 2 weeks, single cell clones are isolated and analyzed by T7E1 assay and FACS analysis. Sdc1 locus of Sdc1 negative clones was PCRed. For clones with T7E1 cleavage pattern different from wild type cells, PCR products were cloned into a vector for Sanger sequencing. For each Sdc1 negative clones, 12 individual bacteria transformants were randomly selected for sequencing. Clone 1 and 12 were identified as Sdc1 negative by FACS. All three Sdc1 loci of single clone 1 were further confirmed to be frameshifted by sanger sequencing. All three Sdc1 loci of single clone 2 were confirmed to be modified by Cas9D10A. Two out of three were identified as frameshift or non-sense mutations while one was an in-frame deletion missing 6 nucleotides.
Flow cytometry, cell sorting and endocytosis assay
Cells were suspended using Non-enzymatic Cell Dissociation Buffer (Sigma), pelleted and resuspended in cold PBS with 1% (w/v) BSA (BSA/PBS). To measure surface populations, resuspended cells were incubated with APC-conjugated anti-SDC1 or its isotype control antibody (Biolegend) for 15 mins on ice and processed for flow cytometry analysis following the manufacturer’s instructions. To measure total SDC1, resuspended cells were immediately fixed in PBS containing 1.6% polyformaldehyde (PFA) and permeabilized in 0.5% saponin before performing incubation with conjugated antibodies and processing for flow cytometry analysis as above. Propidium iodide was used to exclude dead cells. All samples were acquired using a BD FACSCantoII flow cytometer or BD LSRFortessa analyzer. Cell sorting of the top 20% GFP positive cells was performed using BD FACSAria cell sorter.
To measure endocytosis rates, cells were incubated with anti-SDC1 antibody (Clone 281–2, Biolegend) on ice for 15 mins to label the surface population of SDC1. Cells were washed with ice-cold growth medium and then incubated for the indicated times at 37° C to allow internalization. At each time point, samples were immediately transferred to ice to halt trafficking, and APC anti-rat IgG antibody was added to detect the anti-SDC1 remaining at the cell surface. Samples were then washed in ice-cold PBS/BSA, fixed, washed and analyzed as described above. To measure recycling rate, cells were trypsinized at 37° C to thoroughly remove surface SDC1 and washed with ice-cold growth medium. Cells were incubated at 37° C for the indicated time points before being immediately cooled to 4° C to arrest trafficking. Cells harvested at sequential time points were incubated with APC-conjugated anti-SDC1 antibody, washed, and analyzed as described above.
Detection and quantification of macropinocytosis
Dextran uptake was performed with modification of previously published protocols32. The detailed procedure is described in Extended Experimental Procedures.
Statistical analysis
Pathway analysis of surfaceome data was performed using IPA software. Tumor volume and tumor-free survival were analyzed using GraphPad Prism. Results from survival experiments were analyzed with a Log-rank (Mantel-Cox) test and expressed as Kaplan–Meier survival curves. Statistical analyses for comparison of grouped samples were performed using a two-way ANOVA test. Others comparisons were performed using the unpaired Student’s test. Biological replicates that were drastic outliers due to experimental variability were excluded. For all experiments with error bars, standard deviation (SD) was calculated to indicate the variation with each experiments and data, and values represent mean ± SD.
Extended Experimental Procedure
Cell culture
293T, ASPC1, MIAPACA2, HPAFII, SW1990, HPAC, PANC1, CAPAN1, BXPC3, PANC0813, PANC0327 cells were obtained from ATCC. DAN-G, HUPT3, HUPT4 and PATU8902 were obtained form DSMZ. SNU324 was obtained from AcceGen Biotech. KP4 was obtained from JCRB. Cells were cultured according to recommended protocols. Establishment of primary PDAC lines was performed as described previously28,33. Mouse derived primary pancreatic cancer cells were maintained in RPMI-1640 medium containing 10% Tet-Approved FBS (Clontech) and 1 mg/ml doxy (Clontech).
Cell surface proteins preparation
To isolate cell surface proteins, ~2×10⁸ cells were biotinylated in the culture plate with 10 ml of 0.25 mg/ml of Sulfo-NHS-SS-BIOTIN (Thermo Scientific) in PBS at room temperature (23–24°C) for 10 min, after extensive PBS rinsing. The residual biotinylation reagent was quenched with 10 mM Lysine. Protein extraction was performed in a solution containing 3% (v/v) n-octylglucoside (Sigma-Aldrich) with cell disruption by sonication followed by centrifugation at 20,000×g. Biotinylated proteins were chromatographically isolated by affinity chromatography using 1 ml NeutrAvidin Plus UltraLink Resin (Pierce) according to the manufacturer’s instructions. Proteins bound to the column were recovered by reduction of the biotinylation reagent with 5 ml of a solution containing 65 μmol DTT and 1% octyl-glucoside detergent for overnight at 4° C. A total of 0.3 mg of cell surface proteins were reduced in DTT and alkylated with acrylamide before fractionation with reverse-phase high performance liquid chromatography (RP-HPLC). To obtain whole cell extracts for normalization, ~2×10⁷ cells were lysed in 1 ml of PBS containing the detergent octyl-glucoside (OG) (1% w/v) and protease inhibitors (complete protease inhibitor cocktail, Roche Diagnostics), followed by sonication and centrifugation at 20,000×g with collection of the supernatant, and filtration through a 0.22 μm filter. Cells and debris were removed by centrifugation at 5000×g and filtration through a 0.22 μm filter.
Mass spectrometry analysis
Samples were next fractionated at the protein level by reverse-phase chromatography followed by desalting for 5 min with 95% mobile-phase A (0.1% TFA in 95% H2O) at a flow rate of 3 mL/min. Proteins were eluted from the RPGS reversed-phase column (4.6 mm I.D. ×150 mm, 15 μm, 1000Å, Column Technology Inc., Fremont, CA) and collected into 24 fractions, at a flow rate of 2.1 mL/min with a gradient elution that included an increase from 5% to 70% mobile phase B (0.1% TFA in 95% ACN) over 25 min, 70% to 95% mobile phase B for 3 min, a wash step to hold at 95% mobile phase B for 2 min, and a re-equilibration step at 95% mobile phase A for 5 min. The collected fractions from RP-HPLC were dried by lyophilization and subjected to in-solution digestion with trypsin dissolved in 100 mM aminonium bicarbonate containing 2% acetonitrile buffer.
The samples were reconstituted with acetonitrile/water/trifluoroacetic acid (TFA) (3:97:0.1, v/v/v) and individually analyzed by LC-MS/MS in a Qexactive mass spectrometer coupled to an Easy nanoLC 1000 system (Thermo Scientific) using a 15 cm column (75 μm ID, C18 3 μm, column Technology Inc) as a separation column, and Symmetry C18 180 μm ID x 20 mm trap column (Waters) over a 120-minutes gradient. Mass spectrometer parameters were spray voltage 3.0 kV, capillary temperature 275° C, Full scan MS of scan range 350–1,800 m/z, resolution 70,000, AGC target 3e6, Maximun IT 50 msec and data-dependent MS2 scan of resolution 17,500, AGC target 1e5, Maximum IT 100 msec and repeat count 10.
Acquired mass spectrometry data were processed by Proteome Discover 1.4 (Thermo Scientific). The tandem mass spectra were searched against Uniprot human database using Sequest HT. A fixed modification of propionamide (+71.037114 Da) was added to Cys and a variable modification of oxidation (+15.994915 Da) was added to Met. SILAC heavy stable isotopes 13C6 (+6.020129) was added to Arg and Lys. The precursor mass tolerance was 10 ppm and the fragment mass tolerance 0.02 Da. The searched data was further processed with the Target Decoy PSM Validator function to filter with FDR 0.05.
Ingenuity Pathway Analysis (IPA)
The list of 221 Kras-regulated genes from SILAC screen was subjected to Ingenuity Pathway analysis (IPA) to find pathways enriched in changed genes. The enrichment of changed genes in certain pathways using mouse plasma membrane genes only as a background to ensure the enrichment is not from plasma membrane genes per se. All mouse plasma membrane genes (ca. 3000 genes) were subjected to IPA analysis. For a certain pathway, result from SILAC top genes was compared to that from all mouse plasma membrane genes by the Fisher exact test. An enrichment fold is calculated as percent of pathway related genes in SILAC screen over percent of pathway genes in all mouse plasma membrane genes.
In vivo shRNA screens
Transduction efficiency was determined sample- by- sample as the percentage of GFP positive cells two days post infection, as measured by FACS analysis. Large-scale infection of mouse GEMM-derived cells was conducted as previously described31. Briefly, cells were plated in with fresh media containing 8 μg/ml polybrene and sufficient virus to guarantee a 15%–30% infection rate, and more than 1000X coverage of the surfaceome library, based on precedent calculations. Following puromycin selection (2 μg/ml) over the course of 48 hours, cells were trypsinized, pooled together, and a minimum of 1×10⁶ cells were washed in PBS and frozen at −80°C as a reference. The remaining cells for the in vivo studies were separated into independent tubes (triplicates), suspended in PBS:Matrigel (1:1) solution and 106 cells per mouse were injected orthotopically into the pancreas of 4 to 6 week old female immunocompromised mice (NSG, The Jackson Laboratory). For each GEMM-derived cell line, the potential for sufficient in vivo representation of the surfaceome library, at the time of collection, was first determined through sufficient complexity coverage of a 2.75K empty barcoded library.
ORF constructs
Sdc1, Arf6 and Rac1 ORFs were cloned in pHAGE lentivirus vector (EF1 a promoter-GW-Ires-eGfp (GW: Gateway modified)).
Lentivirus preparation
Lentiviral particles were packaged in 293T cells using second-generation packaging plasmids psPAX2 (Addgene plasmid 12260) and pMD2.G (Addgene plasmid 12259). 293T cells were transfected using the Polyethylenimine (PEI) and supernatant was collected 48–72 hours after transfection. The virus was concentrated using ultracentrifuge at 23000 rpm for 3 hours and added to target cells with 10 μg/ml of polybrene (Milipore). Concentrated virus was used fresh or stored at −80°C for further applications.
Clonogenic assay
Five-hundred to two thousand-cells were seeded into each well of 6-well plates in duplicates and incubated to allow colony formation for 2–3 weeks. The colonies were stained with 0.2% crystal violet in 80% methanol.
Orthotopic and subcutaneous xenograft
Mice were anesthetized using a Ketamine/Xylazine solution (150mg/kg, 10mg/kg). Shaved skin was disinfected with betadine and ethanol. Incisions were performed through the skin/subcutaneous and muscular/peritoneal layers. The spleen and tail of the pancreas were exposed and cells (in 50% Matrigel, BD Bioscience) were directly injected in the tail of the pancreas. The muscular/peritoneal planes were closed by continuous resorbable sutures. The skin/subcutaneous planes were closed with interrupted resorbable sutures. Analgesia was achieved with buprenorphine (0.1mg/kg BID). For the subcutaneous xenografts, female homozygous NCr nude mice (Taconic) were injected subcutaneously in flank at about 8 weeks of age. Tumors were harvested and the volume was calculated according to the formula: Volume = ½ (width2 × length). All xenograft experiments were approved by the MD Anderson IACUC under protocol number 00001238. The maximal tumor size allowed by IACUC is 1.5cm in diameter.
Genomic DNA extraction and PCR for NGS library production
Following collection of orthotopic tumors and additional pancreas tissue from NSG mice, samples were first weighed and stored in liquid nitrogen for processing. Frozen tumors were then finely minced using clean scalpels and suspended in P1 buffer without RNase. The samples were then further dissociated using a gentlyMACS Dissociator. Following dissociation, 10 μL RNase A (Thermo Scientific DNase and Protease free, 10 mg/mL) and 50 μL of SDS (Promega) were applied, followed by DNA sheering via a sterile 23 ¼ gauge needle. Total genomic DNA from each sample was then isolated through a phenol-chloroform extraction, and the DNA was precipitated using 90 μL NaOAc (3M) and 720 μL isopropanol. Along with this, linearized acrylamide was applied to each reference to ensure optimal DNA precipitation for each reference sample. Precipitated DNA was washed in 70% ethanol once before being resuspended in DNase-free water overnight. Samples were shaken overnight at 1000 rpm at room temperature to aid with DNA resuspension.
The barcode sequences for each tumor and reference sample were amplified through a two-step PCR reaction as previously described31, and subsequently isolated from a 2% agarose gel. Primers utilized during the two-step PCR barcode amplification were based on sequences provided by Cellecta. The primers involved in the second PCR amplification included P5 and P7 adaptors for the illumina HiSeq 2000 platform. Two separate primer pairs were used in the two-step PCR reaction for the 2.75K empty barcode library and the shRNA library. As previously described31 and based on the two-step PCR amplification strategy outlined by Cellecta, the forward and reverse primers utilized were as follows: F_HTS3 and 13K_R (Empty Library PCR1), Gx1_Bp and P5_NR2 (Empty Library PCR2), F2 and 13K_R(2) (shRNA Library PCR1), and P7_NF2 and P5_NR2 (shRNA Library PCR2). Three separate indexed primers were utilized in the second, or nested, PCR amplification for the purpose of sample multiplexing during sequencing.
Immunohistochemistry and Western blot analysis
Tissues were fixed in 10% formalin overnight, moved in 70% ethanol, and embedded in paraffin. After cutting, immunohistochemical (IHC) analysis was performed as described28. For Western blot analysis, cells were lysed on ice using RIPA buffer (Boston BioProducts) supplemented with protease and phosphatase inhibitors (Roche). SDC1 western blot was conducted as previously reported34. Prior to removel of glycosaminoglycan chains, proteoglycans migrate as a heterodisperse smear in SDS-PAGE. Proteoglycan samples were digested with heparin lyases prior to analysis in gels. Briefly, cells were harvested into ice-cold lysis buffer and total protein was precipitated overnight at −20°C in methanol and washed with −20°C acetone. Soluble material was resuspended in lysase buffer containing 0.0001 units heparitinase (Amsbio) and 0.005 units chondroitin ABC lysase (Sigma) and were proceeded to be resolved by 4–12% SDS-PAGE, transferred to Immobilon-P PVDF, fixed in 0.05% glutaraldehyde (Sigma). Primary antibodies used for IHC and Western blot analysis are listed in the Extended Experimental Procedures. Human PDAC TMA samples were obtained from Brigham and Women’s Hospital Department of Pathology tumor bank.
Antibodies
Anti-Kras (Santa Cruz, Cat# sc-30); Anti-phospho erk (Cell Signaling Technologies, Cat#4376); Anti-vinculin (Cell Signaling Technologies, Cat#E1E9V); Anti-beta-actin (Sigma-Aldrich, Cat#A5441); Anti-syntenin (Abcam, Cat#ab19903); Anti-cytokeratin 19 (Proteintech, Cat#14965–1-AP); Anti-syndecan1 (281–2)(Biolegend, Cat#142502); Anti-ki67 (Vector Laboratories, Cat#VP-RM04); Anti-arf6 (Thermo Scientific, Cat#PA1–093X); Anti-cd8 (Cell Signaling Technologies, Cat#98941), Anti-cd45R (eBioscience, Cat#14–0452-82), Anti-F4/80 (Cell Signaling Technologies, Cat#70076), Anti-foxp3 (eBioscience, Cat#14–4771-80), Anti-cd4 (Abcam, Cat#183685), Anti-ly6g (Biolegend, Cat#127602), Anti-cd11b (Abcam, Cat#ab133357), Anti-phospho akt473 (Cell Signaling Technologies, Cat#3787); Anti-psd4 (Thermo Scientific, Cat#PA5–31837); Anti-epha2 (Cell Signaling Technologies, Cat#6997); Anti-cd19 (Fisher Scientific, Cat#NC0743599); Anti-syndecan1 (B-A38)(Abcam, Cat#34164); Anti-phospho mek (Cell Signaling Technologies, Cat#9154); APC-anti-mouse syndecan1 antibody (Biolegend, Cat#142506); APC-anti-human syndecan1 antibody (Biolegend, Cat#352308); Purified Rat IgG2a (Biolegend, Cat# RTK2758).
Immunofluorescence and confocal microscope
Cells were grown on the 8-wells chamber slides (LabTek), PFA fixed and followed with/without permabilization in 0.5% saponin. Cells were further incubated with the primary antibody for 2h at room temperature. 1% BSA/10% normal goat serum/0.3M glycine was used to quench autofluorescence and block non-specific protein-protein interactions. The secondary antibody was used at a 1/1500 dilution for 40 min at room temperature. DAPI was used to stain the cell nuclei. Images were captured with a FV1000 Olympus Confocal Microscope system.
Detection and quantification of macropinocytosis
Macropinocytic index was determined as described35. Briefly, cells were seeded in 8-well chamber slides (LabTek). 24–48 hours after cell seeding, cells were serum-starved for 12–18 hours. Macropinosomes were marked utilizing a high molecular weight TMR-dextran (Fina Biosolutions) uptake assay wherein TMR-dextran was added to serum-free medium at a final concentration of 1 mg/mL for 35 minutes at 37°C. At the end of the incubation period, cells were rinsed five times in cold PBS and immediately fixed in 4% polyformaldehyde. Cells were DAPI-treated to stain nuclei and coverslips mounted onto slides using DAKO Mounting Media (DAKO). Images were captured using an FV1000 Olympus Confocal Microscope system and analyzed using the ‘Analyze Particles’ feature in ImageJ (NIH). The total particle area per cell was determined from at least 6 fields that were randomly selected from different regions across the entirety of each sample.
Glutamine Deprivation assay
Glutamine deprivation assay was performed following previously published protocols32 with modification as below: cells were plated in 96-well plate format at a density of 500 cells per well in regular complete RPMI1640 medium containing 10% Tet-Approved FBS and 1 mg/ml doxy. Eighteen hours after seeding, cell were washed with PBS three times and incubated in the glutamine-deprivation RPMI1640 medium (Gibco). Glutamine-free RPMI1640 medium was supplemented to the indicated concentration of glutamine in the presence of 10% dialysed FBS, 25mM HEPES and 1 mg/ml doxy. For some experimental groups, medium was supplemented with 0.2% BSA (Sigma) and EIPA (Invitrogen) was used at 25μM with vehicle-only controls consisting of DMSO alone. For all experiments, medium was replaced every 24 h. Viable cell counts were obtained using CellTiter 96 Aqueous One Solution Cell Proliferation Assay (Promega Corporation). Plates were then scanned with PHERAstar FS (BMG Labtech) at 490 nm.
Extended Data
Extended Data Figure 1. Interrogation of surfaceome changes upon Kras* signaling by SILAC based proteomic analysis.
a, Western blot for p-Erk and Kras in iKras p53L/+ cells in the presence (ON) or absence (OFF) of doxycycline for 24 hours. The experiment was repeated twice with similar results.
b-c, Venn diagram shows the total number of identified (b) and quantified (c) proteins with SILAC-based proteomic analysis upon Kras* inactivation in three independent iKras p53L/+ cells.
d-e, Venn diagram shows the number of decreased (Kras* ON/OFF ratio >1.2) (d) or increased Kras* ON/OFF ratio <0.83) (e) proteins quantified with normalized MS2 counts >2 from the SILAC-based proteomic analysis upon Kras* inactivation in three independent iKras p53L/+ cell cultures.
f, IHC staining for EPHA2 and CD9 in orthotopic xenograft tumors from iKras p53L/+ model in the presence (ON) or absence (OFF) of doxycycline for 24 hours (scale bar: 100μm). The experiment was repeated twice with similar results.
g, Top 20 surfaceome genes preferentially regulated by Kras*.
Extended Data Figure 2. Functional surfaceome analysis identified SDC1 as a KRAS*-dependent surface candidate.
a, Normalized counts showing the distribution of reference and tumor barcodes to establish library coverage in vivo in three independent iKras p53L/+ tumor cells cultures, which show similar results. In vivo screens were conducted in 3-5 mice for for each cell culture.
b, Correlation matrix among replicates of orthotopic xenograft-derived AK192, AK196, and AK10965 tumors screened with the surfacome-targeting shRNA library (barcode level fold-change comparison, Pearson correlation coefficient).
c, Positive (Psma, Rpl30) and negative (Luc) controls were plotted applying the RSP/LogP score.
d, Venn diagram shows the number of hits identified from three independent iKras p53L/+ tumor cell cultures.
Extended Data Figure 3. SDC1 membrane expression is elevated in KRAS*-driven PDAC.
a, iKras p53L/+ tumor cells were grown in the presence (ON) or absence (OFF) of doxycycline for 48 hours and subjected to IF staining for SDC1 (red) and DAPI (blue) (scale bar: 20 μm). For REON sample, cells were grown in the absence of doxycycline for 48 hours followed by doxycycline treatment for 24 hours. Representative images were shown, which were repeated three times with similar results.
b, iKras p53L/+ tumor cells were grown in the presence (ON) or absence (OFF) of doxycycline for indicated time periods or treated with MEK inhibitor (AZD8330, 100nM) for 16-18 hours and surface protein levels of CTNNA1 and PMCA were measured by FACS analysis. The quantification of fluorescence intensity is shown. Representative figures and data from biological duplicates are shown.
c, iKras p53L/+ tumor cells were grown in the presence (ON) or absence (OFF) of doxycycline for 24 hours and Sdc1 mRNA level was measured with qPCR (n=3, Data are mean + s.d.). Experiments were repeated twice with similar results.
d, iKras p53L/+ tumor cells stably overexpressing Sdc1 (Sdc1-OE) or empty vector (Vec) and a stable single clone with double nickase-mediated Sdc1 deletion (SC1) derived from iKras p53L/+ tumor cells were blotted to validate SDC1 expression. Some samples were also treated with heparinase (Hepa) and chondroitinase (Cho) before Western blot analysis. Experiments were repeated twice with similar results.
e, iKras p53L/+ tumor cells grown in the presence (ON) or absence (OFF) of doxycycline for indicated time periods were processed for Western blot analysis to detect Sdc1, Vinculin, p-Erk and Kras. Experiments were repeated twice with similar results.
f, Representative IHC images of SDC1 staining from the LSL-Kras PDAC mouse model showing membrane Sdc1 level in normal pancreas, acinar-to-ductal metaplasia (ADM), and PanIN. Experiments were repeated twice with similar results. Scale bar: 200 μm.
g, Representative IHC images of SDC1 staining (lef) in normal pancreas, tumor adjacent pancreatitis (TAP), PanINs and invasive tumors (PDA) from the human PDAC TMA. Quantification of the TMA scores is shown in the right panel. Scale bar: 50 μm.
h, Representative HE and IHC images of SDC1 staining from the TMA analysis. Representative images of SDC1 IHC showing staining classified as low (Score 1), intermediate (Score 2) and high (Score 3). Scale bar: 200 μm.
i, mRNA expression of SDC1 in public microarray datasets. Data are mean ± s.d.; P-values were determined by unpaired two-sided Student’s t-test.
j, Outline of experimental design for sequential cerulein and doxycycline treatment in iKras* mice (Top). Chronic pancreatitis was induced in iKras* mice with cerulein injection for 6 weeks. The animals were then treated with doxycycline for indicated times. Pancreatic or tumor tissues were subjected to HE or IHC staining for CK19 and SDC1 (scale bar: 100 μm) (Bottom). Experiments were repeated twice with similar results.
Extended Data Figure 4. SDC1 is required for tumorigenic activity of KRAS*-driven PDAC.
a, Representative pictures of clonogenic assay for two independent iKras p53L/+ PDAC cells infected with scrambled (Scr) shRNA or shRNA against Sdc1. Experiments were repeated 3 times with similar results.
b-c, Validation of Sdc1 knockdown by qPCR (l) and FACS analysis with anti-Sdc1 antibody (c) in iKras p53L/+ PDAC cells infected with scrambled (Scr) shRNA or shRNA against Sdc. b: n=3; Data are mean + s.d.; P-values were determined by unpaired two-sided Student’s t-test. c: Experiments were repeated 3 times with similar results.
d, Two independent iKras p53L/+ tumor cells stably expressing Sdc1 or empty vector (Vec) were infected with scrambled (Scr) or shRNA against Sdc1. Quantification of clonogenic assay is displayed (n=4 biological replicates; Data are mean + s.d.). P-values were determined by unpaired two-sided Student’s t-test.
e, Digital photographs of dissected tumors from mice implanted with iKras p53L/+ tumor cells harboring scrambled (Scr) or shRNA against Sdc1.
f, Validation of double nickase-mediated Sdc1 deletion in iKras p53L/+ PDAC cells using 281-2 anti-Sdc1 antibody and FACS analysis. Experiments were repeated twice with similar results.
g, Representative figure of clonogenic assay for iKras p53L/+ PDAC cells with wild type Sdc1 or double nickase-mediated Sdc1 deletion. Experiments were repeated twice with similar results.
h, Digital photographs of dissected tumors from mice implanted with iKras p53L/+ tumor cells with wild type Sdc1 or double nickase-mediated Sdc1 deletion.
i, Representative figure of clonogenic assay for human PDAC cells infected with scrambled (SCR) shRNA or shRNA against human SDC1. Experiments were repeated twice with similar results.
j, Validation of SDC1 knockdown by shRNA in human PDAC cell lines from (i) using DL-101 anti-SDC1 antibody and FACS analysis. Experiments were repeated twice with similar results.
k, Digital photographs of dissected tumors from subcutaneous xenografts of mice implanted with PATC69 cells infected with scrambled (SCR) shRNA or shRNA against human SDC1.
Extended Data Figure 5. Sdc1 loss leads to changes in tumor microenvironment.
a, Validation of Sdc1 level by FACS analysis in primary cultures derived from the PDAC mouse model with indicated Sdc1 genotypes. Experiments were repeated twice with similar results.
b-c, Quantification (a) and representative images (b) of immuno-profiling of Sdc1 wild type and knockout (KO) tumors from GEM model by IHC or IF staining (n=20 random images from 4 biological replicates). P-values were determined by unpaired two-sided Student’s t-test.
Extended Data Figure 6. KRAS* induces SDC1 membrane expression through MAPK pathway.
a-b, iKras p53L/+ PDAC cells were grown in presence (ON) or absence (OFF) of doxycycline for 48 hours. REON: cells were grown in absence of doxycycline for 48 hours followed by doxycycline treatment for 24 hours. Treatment of ON or REON samples with trametinib (50 nM) or BKM120 (100 nM) for 16-18 hours is indicated. (a) Cells were stained with anti-Sdc1 antibody and surface Sdc1 was measured via FACS. The quantification of fluorescence intensity from biological duplicates is shown as mean + s.d.. (b) Cell lysates were blotted for phospho-Erk, phospho-Akt, Kras and Vinculin as loading controls. Experiments were repeated twice with similar results.
c-f, iKras p53L/+ PDAC cells were treated with different concentrations of MEK inhibitor Tramatinib (c, d) and AZD8330 (e, f) for overnight (16-18h), and then the live cells were prepared for FACS analysis for SDC1 (c, e) (Data is shown as mean + s.d.); cell lysates were blotted for phospho-ERK, phospho-MEK, KRAS and Vinculin as loading control (d, f). Experiments were repeated twice with similar results.
g, Outline of experimental design to measure Sdc1 shedding (Left). iKras p53L/+ PDAC cells were grown in the presence (ON) or absence (OFF) of doxycycline for 24 or 48 hours. Medium was collected and shed Sdc1 was measured by anti-Sdc1 ELISA (Right) (n=4 biological replicates; Data is shown as mean + s.d.).
h, Outline of experimental design to measure surface Sdc1 internalization (Left). iKras p53L/+ PDAC cells were grown in the presence (ON) or absence (OFF) of doxycycline for 48 hours. Cells were then incubated at 37° C for indicated times and surface Sdc1 was labeled with anti-Sdc1 antibody at 4° C after internalization for indicated times. FACS was performed to detect remaining Sdc1 on the cell membrane (Right) (n=2 biological replicates; data is shown as mean + s.d.).
i-j, Outline of experimental design to measure surface Sdc1 recycling (i, left). iKras p53L/+ PDAC cells were grown in the presence (ON) or absence (OFF) of doxycycline for 48 hours (Left). Surface Sdc1 was labeled with anti-Sdc1 at 4° C. Cells were then incubated at 37° C for 30 minutes to allow Sdc1 internalization. This was followed by incubating cells on ice to halt internalization; subsequently, cells were returned to 37° C for indicated times to allow Sdc1 recycling. Recycled Sdc1 was measured via FACS (i, right). The histograms of FACS analysis illustrating the recycled cell surface Sdc1 at the indicated detecting time points were shown in j. Experiments were repeated twice with similar results.
Extended Data Figure 7. MAPK-PSD4-ARF6 axis mediates KRAS*-dependent SDC1 membrane localization.
a, Cells were grown in presence (ON) or absence (OFF) of doxycycline or treated with AZD8330 (100 nM) for 16-18 hours. (Top) ARF6 activity was measured with GGA3-PBD pull down assay. GTP and GDP used as positive and negative controls, respectively. (Bottom insert) ARF6 activity was calculated as ratio of captured Arf6:input Arf6/vinculin.
b, iKras p53L/+ tumor cells were grown in the presence (ON) or absence (OFF) of doxycycline, or treated with AZD8330 (100 nM) for 16-18 hours. Cell lysates were used for measurement of PIPK activity (n=3 biological replicates; Data are mean + s.d.). P-values were determined by unpaired two-sided Student’s t-test.
c, Representative images of morphology change in iKras p53L/+ tumor cells with dominant negative Arf6 (ArfT27N) or constitutively active Arf6 (ArfQ67L). Experiments were repeated 3 times with similar results.
d, iKras p53L/+ tumor cells stably expressing Arf6Q67L or its empty vector (Vec) were grown in the presence (ON) or absence (OFF) of doxycycline for 48 hours and surface Sdc1 were measured with FACS using anti-Sdc1 antibody (Top). The fluorescence intensity of surface SDC1 is shown (Bottom) (n=4 biological replicates; Data are mean + s.d.). P-values were determined by paired two-sided Student’s t-test.
e, iKras p53L/+ tumor cells stably expressing Arf6T27N or empty vector (Vec) were grown in the presence (ON) or absence (OFF) of doxycycline for 48 hours and surface Sdc1 were measured with FACS using anti-Sdc1 antibody. Representative histograms (top) and bar figure of fluorescence intensity were shown (bottom) (n=3 biological replicates; Data are mean + s.d.). P-values were determined by paired two-sided Student’s t-test.
f, mRNA expression of GAPs and GEFs of Arf6 in iKras p53L/+ tumor cell microarray dataset upon KrasG12D inactivation (n=4 biological replicates). P-values were determined by unpaired two-sided Student’s t-test.
g, iKras p53L/+ tumor cells were grown in the presence (ON) or absence (OFF) of doxycycline, or treated with Trametinib (50 nM) for 16-18 hours and Psd4 mRNA level was measured by qPCR (n=3). P-values were determined by unpaired two-sided Student’s t-test.
h, MiaPaCa2 cells harboring doxycycline-inducible shRNA targeting human KRAS were grown in the absence (OFF) or presence (ON) of doxycycline, or treated with Trametinib (50 nM), AZD8330 (50 nM), or BKM120 (100 nM) for 18 hours. Cell lysates were blotted for PSD4, phosphor-ERK and KRAS. Arrow: band for PSD4. Experiments were repeated twice with similar results.
i, iKras p53L/+ tumor cells stably expressing Psd4 or its empty vector were grown in the presence (ON) or absence (OFF) of doxycycline for 48 hours. ARF6 activity was measured by GGA3-PBD pull down assay. Input lysates were immunoblotted to validate expression of Arf6, p-Erk, p-Mek, Psd4, and Kras. Experiments were repeated twice with similar results.
j, iKras p53L/+ tumor cells stably expressing Psd4 or its empty vector (Vec) were grown in the presence (ON) or absence (OFF) of doxycycline for 48 hours and surface Sdc1 was measured by FACS using anti-Sdc1 antibody. Representative histograms of FACS analysis (top) and bar figure of fluorescence intensity of surface Sdc1 (bottom) were shown in the plot (n=3 biological replicates; Data are mean + s.d.). P-values were determined by paired two-sided Student’s t-test.
Extended Data Figure 8. SDC1 mediates macropinocytosis in KRAS*-driven mouse PDAC cells.
a-b, iKras p53L/+ tumor cells were grown in the presence (ON) or absence (OFF) of doxycycline for 24 hours. For a positive control, cells grown in the presence of doxycycline were treated with EIPA (50 μM) for 16 hours. Macropinocytosis was visualized with TMR-dextran (scale bar: 20 μm) (a) and quantified (b) (n=8 random areas for ON/OFF groups and n=5 for EIPA group; data are mean + s.d.). Data are representative of three independent experiments with similar results.
c, Validation of Sdc1 knocking down by qPCR in iKras p53L/+ tumor cells (n=3; data are mean + s.d.).
d, Macropinocytosis index in LSL-Kras p53L/+ tumor cells harboring scrambled (Scr) shRNA or shRNA against Sdc (n=6 random areas; data are mean + s.d.).
e-f, iKras p53L/+ tumor cells stably expressing Psd4 or empty vector (Vec) were grown in the presence (ON) or absence (OFF) of doxycycline for 48 hours. Macropinocytosis was visualized with TMR-dextran (scale bar: 20 μm) and quantified (n=6 random areas for Vec-ON, Psd4-ON and Psd4-OFF groups and n=8 for Vec-OFF group; data are mean + s.d.). Data are representative of two independent experiments with similar results.
g, iKras p53L/+ tumor cells stably expressing Sdc1 or empty vector (Vec) were grown in the presence (Kras* ON) or absence (Kras* OFF) of doxycycline for 48 hours. Macropinocytosis was visualized with TMR-dextran (scale bar: 20 μm). Experiments were repeated twice with similar results.
h, RhoA activity of iKras p53L/+ tumor cells harboring scrambled (Scr) shRNA or shRNA against Sdc1 was measured with G-LISA activation assay (n=2 biological replicates; data are mean + s.d.).
i, Rac1 activity in iKras p53L/+ tumor cells harboring Rac1Q61L or empty vector (Vec) was measured with G-LISA activation assay (n=2 biological replicates; data are mean + s.d.).
j-k, iKras p53L/+ tumor cells stably expressing Rac1Q61L or its empty vector were infected with scrambled (Scr) shRNA or shRNA against Sdc1. Macropinocytosis was visualized with TMR-dextran (scale bar: 20 μm) (j) and quantified (k) (n=8 random areas; data are mean + s.d.). Data are representative of two independent experiments with similar results.
l, iKras p53L/+ tumor cells were cultured in medium with serial concentrations of glutamine. Growth rate was measured and the timelapse graph was generated by Incucyte Live Cell Analysis System (n=3 technical replicates; data are mean + s.d.). Data is representative of two independent experiments with similar results.
Extended Data Figure 9. SDCBP1 is required for SDC1-mediated macropinocytosis.
a, iKras p53L/+ tumor cells harboring wild type or different mutant constructs of Sdc1 or empty vector (Vec) were infected with scrambled (Scr) shRNA or shRNA against Sdc1 and surface expression of Sdc1 was measured by FACS; representative histograms are shown. Experiments were repeated twice with similar results.
b, Shed Sdc1 from iKras p53L/+ tumor cells stably expressing wild type (WT), soluble mutant Sdc1 (Sol), or empty vector (Vec) was measured by anti-Sdc1 ELISA (n=5 biological replicates; data are mean + s.d.).
c-e, iKras p53L/+ tumor cells harboring wild type (WT) or different mutant constructs of Sdc1 or empty vector (Vec) were infected with scrambled (Scr) shRNA or shRNA against Sdc to measure Rac1 activity using G-LISA activation assay (c) (n=4 biological replcates) or macropinocytosis index by visualizing with TMR-dextran (scale bar: 20 μm) and subsequent quantification (d, e). Data are mean + s.d.. Experiments were repeated twice with similar results.
f-g, iKras p53L/+ tumor cells harboring wild type (WT) or different mutant constructs of Sdc1 or empty vector (Vec) were infected with scrambled (Scr) shRNA or shRNA against Sdc1 and subcutaneously injected into nude mice. Digital photographs of dissected tumors (f) and tumor volume at indicated time points (g) were shown (n=5 for Vec Scr, Sol-ShSdc1, Ect-ShSdc1, Gag-ShSdc1 and WT-ShSdc1 groups; n=4 for Vec-ShSdc1 and C30-ShSdc1 groups; data are mean + s.d.).
h-m, iKras p53L/+ tumor cells were infected with scrambled (Scr) shRNA or shRNA against Sdcbp. (h) Sdcbp knockdown was validated with Western blot. Image of ShSdcbp-2 was cropped from the same picture as Scr and ShSdcbp-1. Experiments were repeated twice with similar results. (i) Rac1 activity was measured by G-LISA activation assay (n=4 biological replicates; data are mean + s.d.). (j) Macropinocytosis was visualized with TMR-dextran (scale bar: 20 μm) and quantified (n=5 random areas for Scr and ShSdcbp-2; n=6 random areas for ShSdcbp-1 group; data are mean + s.d.). Data are representative of two independent experiments with similar results. (k) Representative images of clonogenic assay are shown from two independent experiments with similar results. (l) Cells were subcutaneously injected into nude mice (n=4 for Scr and ShSdcbp-1 groups and n=5 for ShSdcbp-2 group) and tumor size were measured with digital photographs of dissected tumors shown in (m).
P-values were determined by unpaired two-sided Student’s t-test.
Extended Data Figure 10. SDC1 is critical for macropinocytosis in KRAS*-dependent human PDAC.
a-c, ASPC1 or PATC69 PDAC cells expressing mouse SDC1 or empty vector (Vec) were infected with scrambled (SCR) shRNA or shRNA against SDC1. Macropinocytosis was visualized with TMR-dextran (scale bar: 20 μm) (a) and quantified (b) (data are mean + s.d.). Data are representative of two independent experiments with similar results. P-values were determined by unpaired two-sided Student’s t-test. (c) Surface SDC1 evaluated by FACS using human anti-SDC1 antibody DL101 or mouse anti-Sdc1 antibody 281-2. Histograms show representative images from two independent experiments with similar results.
d, Macropinocytic index of 20 human PDAC cell lines with high (n=13) or low (n=7) SDC1 membrane expression, as determined by FACS analysis. P-value was determined by Mann-Whitney test.
e-f, Macropinocytic index was quantified in 20 different PDAC cell lines (e) (Data are mean + s.d.). Representative images of TMR-Dextran (red) staining are shown in f (scale bar: 20 μm). Data are representative of two independent experiments with similar results.
Supplementary Material
Acknowledgement
We thank Dafna Bar-Sagi and Craig Ramirez (New York University) for their suggestions and constructive feedback. We thank Ralph Sanderson at University of Alabama for sharing syndecan-1 constructs. We thank Trang Tieu, Michael Peoples, Jiangong Ren and Qing Chang for technical assistance. We thank Dave Aten for help with the graphical abstract. We would also like to thank our colleagues at the Institute for Applied Cancer Science (IACS), the Flow Cytometry and Cellular Imaging Core, the Sequencing and Microarray Facility, the Department of Veterinary Medicine, Medical Graphics & Photography at The MD Anderson Cancer Center (MDACC) (Cancer Center Support Grant, CA016672). We wish to thank all members of G.F.D.’s, R.A.D.’s, H.Y.’s and S.H.’s labs for discussion and reagents. The research was supported by the Odyssey Postdoctoral Fellowship at MDACC, the PanCAN-AACR Pathway to Leadership Grant (16–70-25-YAO) and 2017 Hirshberg foundation for pancreatic cancer research to W.Y.; Pancreatic Cancer Moon Shot Program at MDACC, CPRIT (RP160471), DOD (W81XWH-11–1-0418), and Harrington Discovery Institute Grant to G.F.D.; P01 Grant (P01CA117969 12, NIH) to H.W., A.M., R.A.D., G.F.D., H.Y.
Footnotes
Data Availability
All data are available from the corresponding author (G.G.) upon reasonable request.
Competing Interests
Dr. Draetta reports personal fees from, and stock ownership in, Karyopharm Therapeutics, Forma Therapeutics, Metabomed, BiovelocITA, Nurix, Inc., Orionis Biosciences; personal fees from Blueprint Medicines, Taiho Pharmaceutical Co., Symphogen, Helsinn Ventures. Dr. Draetta is a member of the European Molecular Biology Organization (EMBO), the American Association of Cancer Research (AACR), the American Society of Clinical Oncology (ASCO).
References
- 1.Siegel RL, Miller KD & Jemal A Cancer Statistics, 2017. CA Cancer J Clin 67, 7–30, doi: 10.3322/caac.21387 (2017). [DOI] [PubMed] [Google Scholar]
- 2.Mann KM, Ying H, Juan J, Jenkins NA & Copeland NG KRAS-related proteins in pancreatic cancer. Pharmacol Ther 168, 29–42, doi: 10.1016/j.pharmthera.2016.09.003 (2016). [DOI] [PubMed] [Google Scholar]
- 3.Pettazzoni P et al. Genetic events that limit the efficacy of MEK and RTK inhibitor therapies in a mouse model of KRAS-driven pancreatic cancer. Cancer Res 75, 1091–1101, doi: 10.1158/0008-5472.CAN-14-1854 (2015). [DOI] [PMC free article] [PubMed] [Google Scholar]
- 4.Shimizu T et al. The clinical effect of the dual-targeting strategy involving PI3K/AKT/mTOR and RAS/MEK/ERK pathways in patients with advanced cancer. Clin Cancer Res 18, 2316–2325, doi: 10.1158/1078-0432.CCR-11-2381 (2012). [DOI] [PubMed] [Google Scholar]
- 5.Kapoor A et al. Yap1 activation enables bypass of oncogenic Kras addiction in pancreatic cancer. Cell 158, 185–197, doi: 10.1016/j.cell.2014.06.003 (2014). [DOI] [PMC free article] [PubMed] [Google Scholar]
- 6.Viale A et al. Oncogene ablation-resistant pancreatic cancer cells depend on mitochondrial function. Nature 514, 628–632, doi: 10.1038/nature13611 (2014). [DOI] [PMC free article] [PubMed] [Google Scholar]
- 7.Ying H et al. Oncogenic Kras maintains pancreatic tumors through regulation of anabolic glucose metabolism. Cell 149, 656–670, doi: 10.1016/j.cell.2012.01.058 (2012). [DOI] [PMC free article] [PubMed] [Google Scholar]
- 8.da Cunha JP et al. Bioinformatics construction of the human cell surfaceome. Proc Natl Acad Sci U S A 106, 16752–16757, doi: 10.1073/pnas.0907939106 (2009). [DOI] [PMC free article] [PubMed] [Google Scholar]
- 9.Binder JX et al. COMPARTMENTS: unification and visualization of protein subcellular localization evidence. Database : the journal of biological databases and curation 2014, bau012, doi: 10.1093/database/bau012 (2014). [DOI] [PMC free article] [PubMed] [Google Scholar]
- 10.Biankin AV et al. Pancreatic cancer genomes reveal aberrations in axon guidance pathway genes. Nature 491, 399–405, doi: 10.1038/nature11547 (2012). [DOI] [PMC free article] [PubMed] [Google Scholar]
- 11.Capello M et al. Carboxylesterase 2 as a Determinant of Response to Irinotecan and Neoadjuvant FOLFIRINOX Therapy in Pancreatic Ductal Adenocarcinoma. Journal of the National Cancer Institute 107, doi: 10.1093/jnci/djv132 (2015). [DOI] [PMC free article] [PubMed] [Google Scholar]
- 12.Carugo A et al. In Vivo Functional Platform Targeting Patient-Derived Xenografts Identifies WDR5-Myc Association as a Critical Determinant of Pancreatic Cancer. Cell reports 16, 133–147, doi: 10.1016/j.celrep.2016.05.063 (2016). [DOI] [PubMed] [Google Scholar]
- 13.Alexander CM et al. Syndecan-1 is required for Wnt-1-induced mammary tumorigenesis in mice. Nat Genet 25, 329–332, doi: 10.1038/77108 (2000). [DOI] [PubMed] [Google Scholar]
- 14.Subramanian SV, Fitzgerald ML & Bernfield M Regulated shedding of syndecan-1 and −4 ectodomains by thrombin and growth factor receptor activation. J Biol Chem 272, 14713–14720 (1997). [DOI] [PubMed] [Google Scholar]
- 15.Chen K & Williams KJ Molecular mediators for raft-dependent endocytosis of syndecan-1, a highly conserved, multifunctional receptor. J Biol Chem 288, 13988–13999, doi: 10.1074/jbc.M112.444737 (2013). [DOI] [PMC free article] [PubMed] [Google Scholar]
- 16.Zimmermann P et al. Syndecan recycling [corrected] is controlled by syntenin-PIP2 interaction and Arf6. Developmental cell 9, 377–388, doi: 10.1016/j.devcel.2005.07.011 (2005). [DOI] [PubMed] [Google Scholar]
- 17.Robertson SE et al. Extracellular signal-regulated kinase regulates clathrin-independent endosomal trafficking. Mol Biol Cell 17, 645–657, doi: 10.1091/mbc.E05-07-0662 (2006). [DOI] [PMC free article] [PubMed] [Google Scholar]
- 18.Honda A et al. Phosphatidylinositol 4-phosphate 5-kinase alpha is a downstream effector of the small G protein ARF6 in membrane ruffle formation. Cell 99, 521–532 (1999). [DOI] [PubMed] [Google Scholar]
- 19.Bar-Sagi D & Feramisco JR Induction of membrane ruffling and fluid-phase pinocytosis in quiescent fibroblasts by ras proteins. Science 233, 1061–1068 (1986). [DOI] [PubMed] [Google Scholar]
- 20.Commisso C et al. Macropinocytosis of protein is an amino acid supply route in Ras-transformed cells. Nature 497, 633–637, doi: 10.1038/nature12138 (2013). [DOI] [PMC free article] [PubMed] [Google Scholar]
- 21.Brown FD, Rozelle AL, Yin HL, Balla T & Donaldson JG Phosphatidylinositol 4,5-bisphosphate and Arf6-regulated membrane traffic. J Cell Biol 154, 1007–1017, doi: 10.1083/jcb.200103107 (2001). [DOI] [PMC free article] [PubMed] [Google Scholar]
- 22.Radhakrishna H, Klausner RD & Donaldson JG Aluminum fluoride stimulates surface protrusions in cells overexpressing the ARF6 GTPase. J Cell Biol 134, 935–947 (1996). [DOI] [PMC free article] [PubMed] [Google Scholar]
- 23.Fujii M, Kawai K, Egami Y & Araki N Dissecting the roles of Rac1 activation and deactivation in macropinocytosis using microscopic photo-manipulation. Sci Rep 3, 2385, doi: 10.1038/srep02385 (2013). [DOI] [PMC free article] [PubMed] [Google Scholar]
- 24.Su G, Blaine SA, Qiao D & Friedl A Shedding of syndecan-1 by stromal fibroblasts stimulates human breast cancer cell proliferation via FGF2 activation. J Biol Chem 282, 14906–14915, doi: 10.1074/jbc.M611739200 (2007). [DOI] [PubMed] [Google Scholar]
- 25.Langford JK, Yang Y, Kieber-Emmons T & Sanderson RD Identification of an invasion regulatory domain within the core protein of syndecan-1. J Biol Chem 280, 3467–3473, doi: 10.1074/jbc.M412451200 (2005). [DOI] [PubMed] [Google Scholar]
- 26.Beekman JM & Coffer PJ The ins and outs of syntenin, a multifunctional intracellular adaptor protein. J Cell Sci 121, 1349–1355, doi: 10.1242/jcs.026401 (2008). [DOI] [PubMed] [Google Scholar]
- 27.Ying H et al. Oncogenic Kras maintains pancreatic tumors through regulation of anabolic glucose metabolism. Cell 149, 656–670, doi: 10.1016/j.cell.2012.01.058 (2012). [DOI] [PMC free article] [PubMed] [Google Scholar]
- 28.Kapoor A et al. Yap1 activation enables bypass of oncogenic Kras addiction in pancreatic cancer. Cell 158, 185–197, doi: 10.1016/j.cell.2014.06.003 (2014). [DOI] [PMC free article] [PubMed] [Google Scholar]
- 29.Alexander CM et al. Syndecan-1 is required for Wnt-1-induced mammary tumorigenesis in mice. Nat Genet 25, 329–332, doi: 10.1038/77108 (2000). [DOI] [PubMed] [Google Scholar]
- 30.Taguchi A et al. Lung cancer signatures in plasma based on proteome profiling of mouse tumor models. Cancer Cell 20, 289–299, doi: 10.1016/j.ccr.2011.08.007 (2011). [DOI] [PMC free article] [PubMed] [Google Scholar]
- 31.Carugo A et al. In Vivo Functional Platform Targeting Patient-Derived Xenografts Identifies WDR5-Myc Association as a Critical Determinant of Pancreatic Cancer. Cell reports 16, 133–147, doi: 10.1016/j.celrep.2016.05.063 (2016). [DOI] [PubMed] [Google Scholar]
- 32.Commisso C et al. Macropinocytosis of protein is an amino acid supply route in Ras-transformed cells. Nature 497, 633–637, doi: 10.1038/nature12138 (2013). [DOI] [PMC free article] [PubMed] [Google Scholar]
- 33.Aguirre AJ et al. Activated Kras and Ink4a/Arf deficiency cooperate to produce metastatic pancreatic ductal adenocarcinoma. Genes Dev 17, 3112–3126 (2003). [DOI] [PMC free article] [PubMed] [Google Scholar]
- 34.Burbach BJ, Friedl A, Mundhenke C & Rapraeger AC Syndecan-1 accumulates in lysosomes of poorly differentiated breast carcinoma cells. Matrix biology : journal of the International Society for Matrix Biology 22, 163–177 (2003). [DOI] [PubMed] [Google Scholar]
- 35.Commisso C, Flinn RJ & Bar-Sagi D Determining the macropinocytic index of cells through a quantitative image-based assay. Nat Protoc 9, 182–192, doi: 10.1038/nprot.2014.004 (2014). [DOI] [PMC free article] [PubMed] [Google Scholar]
Associated Data
This section collects any data citations, data availability statements, or supplementary materials included in this article.


