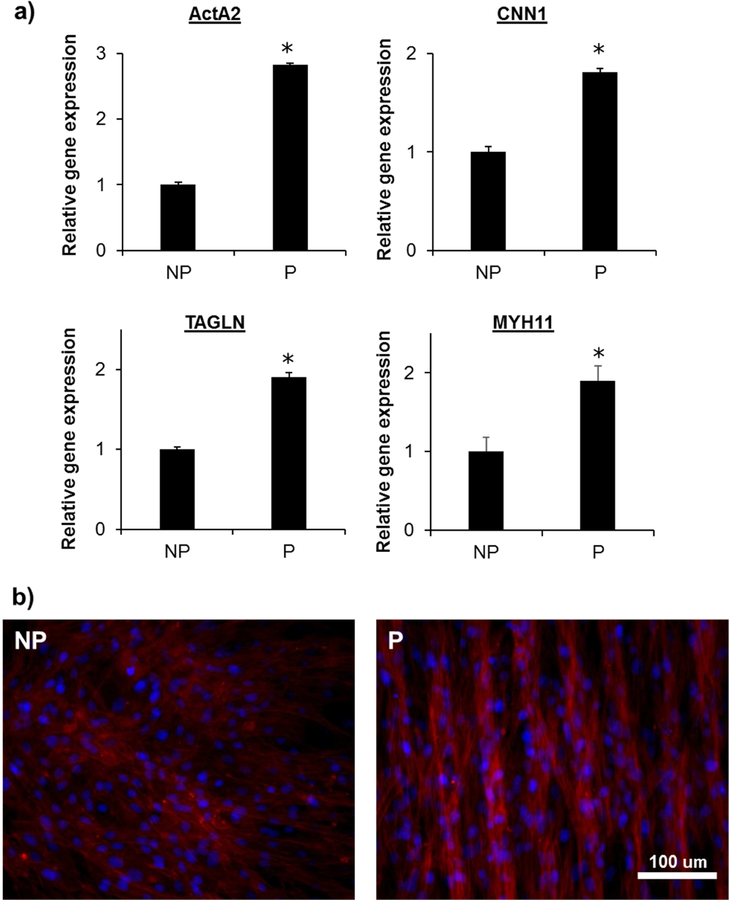
Figure 3.
Effect of cellular alignment on contractile marker expression. (a) Gene expression analysis using TaqMan assay. Relative gene expression level was normalized by GAPDH as housekeeping gene and NP as control. (n=3; *, p<0.05) (b) Smooth muscle myosin heavy chain (SM-MHC or MYH11) immunofluorescence stained VSMC sheet images. Red indicates SM-MHC and blue indicates nuclei. Scale bar 100 µm.

