Abstract
Mutations in the FOXA1 transcription factor define a unique subset of prostate cancers but the functional consequences of these mutations and whether they confer gain or loss of function is unknown1-9. By annotating the FOXA1 mutation landscape from 3086 human prostate cancers, we define two hotspots in the forkhead domain: Wing2 (~50% of all mutations) and R219 (~5%), a highly conserved DNA contact residue. Clinically, Wing2 mutations are seen in adenocarcinomas at all stages, whereas R219 mutations are enriched in metastatic tumors with neuroendocrine histology. Interrogation of the biologic properties of FOXA1WT and 14 FOXA1 mutants revealed gain-of-function in mouse prostate organoid proliferation assays. 12 of these mutants, as well as FOXA1WT, promoted an exaggerated pro-luminal differentiation program whereas two different R219 mutants blocked luminal differentiation and activate a mesenchymal and neuroendocrine transcriptional program. ATAC-seq of FOXA1WT and representative Wing2 and R219 mutants revealed dramatic, mutant-specific changes in open chromatin at thousands of genomic loci, together with novel sites of FOXA1 binding and associated increases in gene expression. Of note, peaks in R219 mutant expressing cells lack the canonical core FOXA1 binding motifs (GTAAAC/T) but are enriched for a related, non-canonical motif (GTAAAG/A), which is preferentially activated by R219 mutant FOXA1 in reporter assays. Thus, FOXA1 mutations alter its normal pioneering function through perturbation of normal luminal epithelial differentiation programs, providing further support to the role of lineage plasticity in cancer progression.
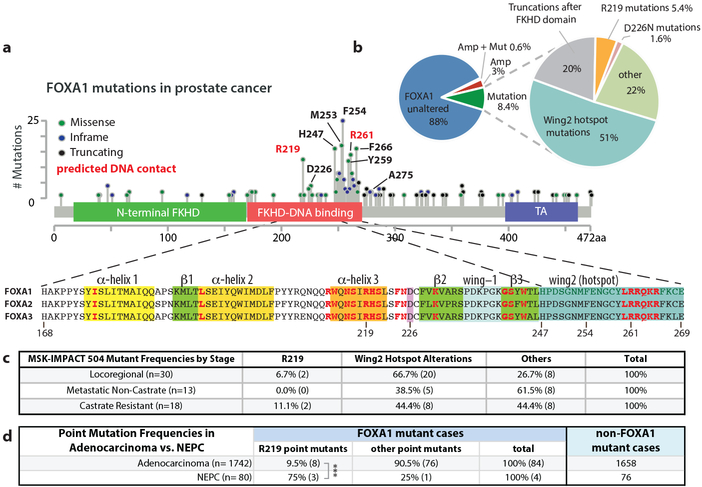
To investigate the role of mutant and wild-type FOXA1 in prostate cancer, we examined the landscape of FOXA1 alterations across a cohort of 3086 patients with primary or metastatic disease. The overall frequency of FOXA1 alteration is ~11% (Fig. 1a, b), 3% of which are genomic amplifications and 8.4% somatic point mutations, with <1% having both (Fig. 1b). Over 50% of FOXA1 mutations map to a specific hotspot in Wing2 of the forkhead (FKHD) DNA-binding domain, often as missense or indels in Wing2 (mainly between H247 and F266), some of which are predicted direct DNA contact sites10 (Fig. 1a, Extended Data Fig. 1). R219 is a DNA contact site in α-helix 3, a highly conserved fold of the FKHD domain that sits in the major groove of target DNA (Extended Data Fig. 1). Finally, 20% encode truncation mutations just downstream of the FKHD DNA-binding domain, resulting in loss of the C-terminal transactivating domain. Annotation of all FOXA1 mutations in the MSK-IMPACT 504 cohort11 revealed that Wing2 hotspot mutations, the most common subclass, are found across all disease stages but more prevalent in primary locoregional cases (Fig. 1c). There are only 4 cases of FOXA1R219 mutation in this cohort but, intriguingly, 2 had castration resistant disease. We therefore expanded the analysis to 1822 patients by including a larger cohort from MSK-IMPACT and a published cohort from Weill-Cornell enriched for neuroendocrine prostate cancer (NEPC)12 and observed significant enrichment (p<0.006) of FOXA1R219 mutation versus other FOXA1 mutations in NEPC (3 out of 4) versus adenocarcinoma (8 out of 84) (Fig. 1d).
Fig. 1. Recurrent FOXA1 mutations in prostate cancer cluster in the FKHD DNA-binding domain.
(a) Distribution of FOXA1 mutations from a pan-prostate cancer analysis of 3086 patients along linear protein sequence, depicting the various alterations seen in patients, and the amino acid sequence of the conserved FKHD DNA-binding domain, with secondary structural elements indicated. Residues in red are predicted to make contacts with DNA10. (b) Classification of FOXA1 alterations observed. Mutations can be subdivided into several classed based on their location within the FOXA1 protein. (c) Frequency of the various classes of FOXA1 alterations in the 3 clinical stages reported in MSK-IMPACT 504. All values are % of the total number of samples with FOXA1 mutations at a given clinical stage. (d) Prevalence of R219 mutations compared to all other point mutations found in FOXA1 in adenocarcinoma versus NEPC. Cases pooled from Trento/Cornell/Broad12 dataset and MSK-IMPACT 1708. ***p=0.0059, Fisher’s exact test, two-sided.
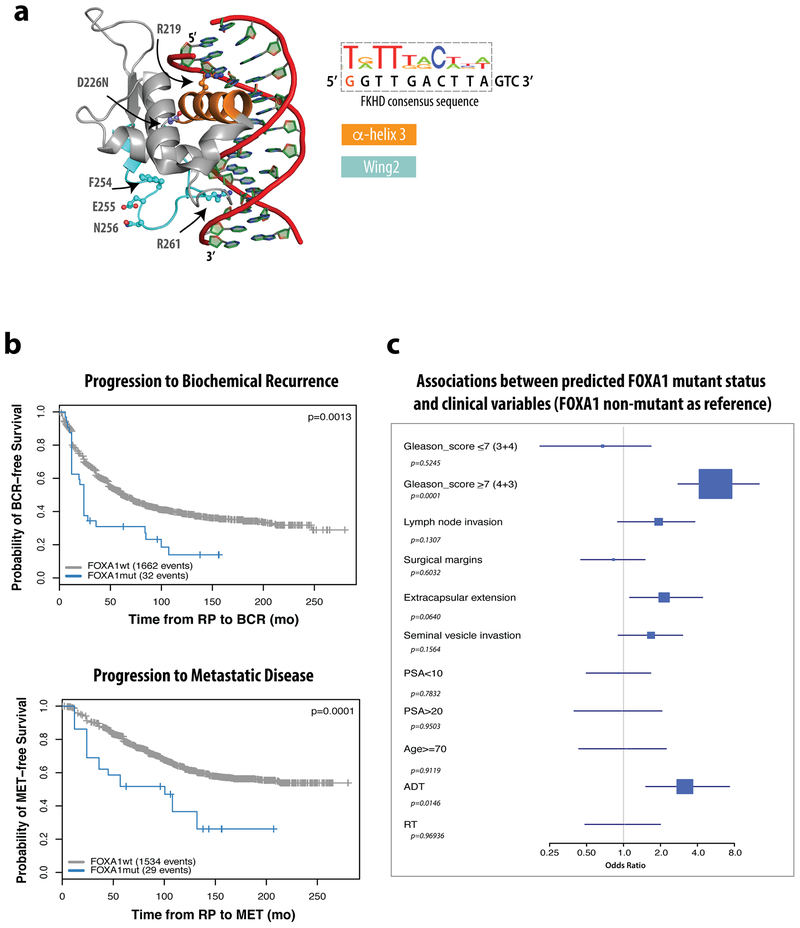
We next asked if FOXA1 mutation in patients is associated with clinical outcome. In the absence of appropriate longitudinal data, we generated an RNA signature using mutant FOXA1 status of TCGA samples to query the Decipher GRID cohort of 1626 primary prostate cancer patients13 and found that tumors predicted to be FOXA1 mutant were significantly associated with higher Gleason Scores, shorter time to biochemical recurrence, and more rapid progression to metastatic disease than unaltered cases (Extended Data Fig. 1b,c). Together with recent evidence14, these data suggest that patients with FOXA1 mutations have less favorable prognosis.
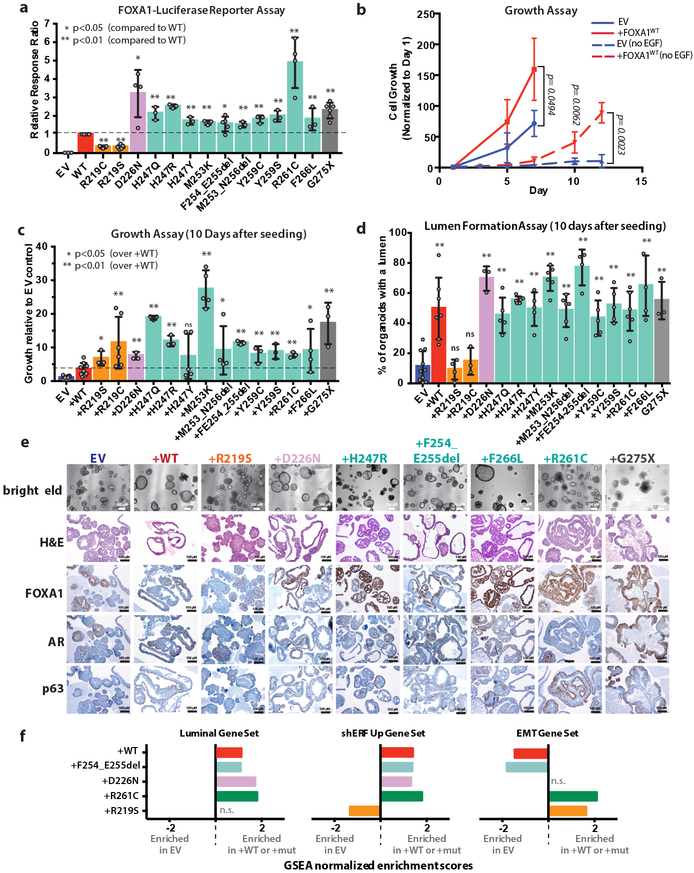
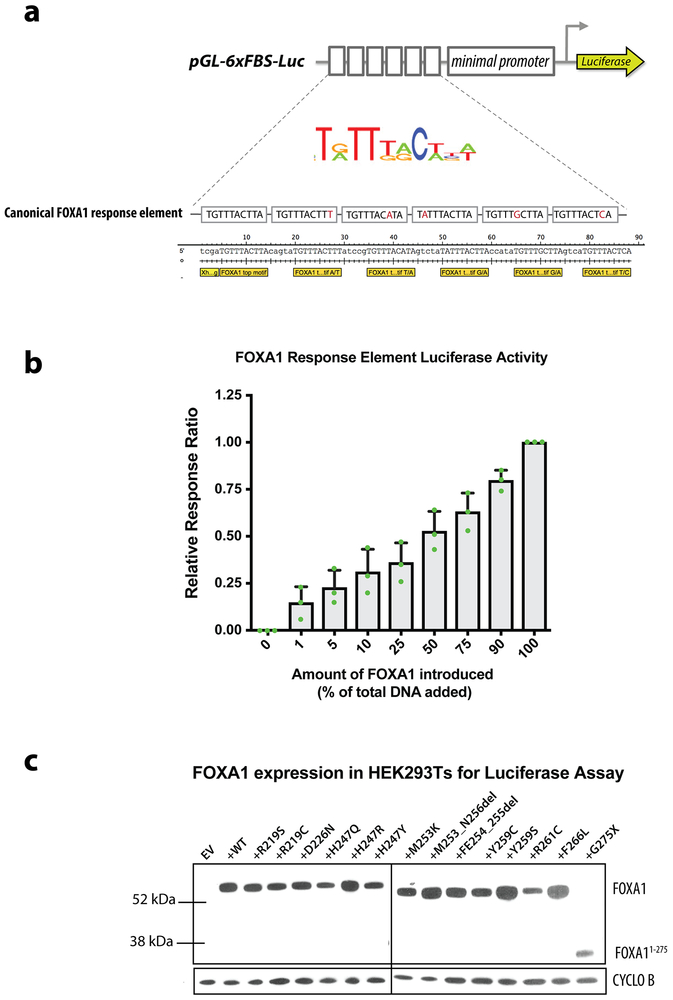
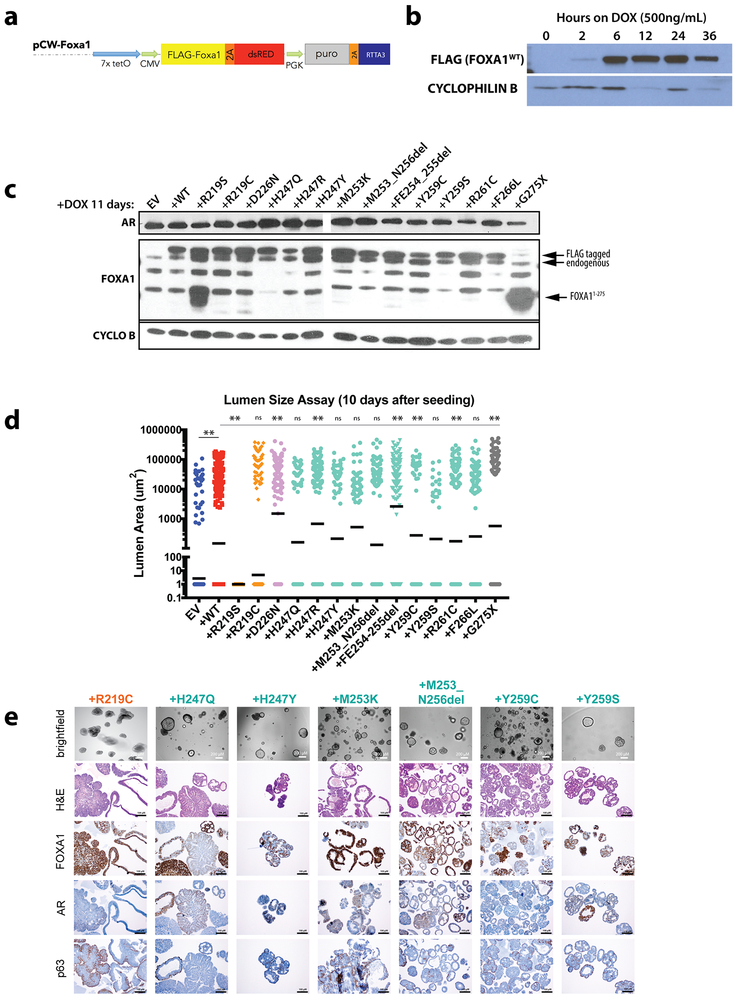
To characterize a large panel of the most recurrent alterations seen in prostate cancer, including truncating mutations (G275X), we generated a novel FOXA1 reporter construct (Extended Data Fig. 2), and found that all Wing2 mutations, D226N (a mutation in 3D proximity to Wing210) and the truncation mutant G275X have increased transcriptional activity (~2 fold) compared to wild-type, whereas mutations at R219 (R219S and R219C) showed impaired activity (~50% of WT) (Fig. 2a). To explore the consequences of FOXA1 mutations on growth of prostate cells, we utilized primary mouse prostate organoid culture (previously used to model tumor initiation)15 by introducing a series of wild-type or mutant mouse Foxa1 alleles using doxycycline (dox)-inducible lentiviral constructs (Extended Data Fig. 3a-c). Increased expression of FOXA1WT resulted in a 2–3 fold increase in growth compared to vector control (EV). This relative difference was substantially greater (~50-fold) after removal of epidermal growth factor (EGF), a critical growth factor for normal organoid proliferation (Fig. 2b). In this setting, nearly all mutants tested led to an increase in growth compared to overexpression of FOXA1WT, including the two helix 3 mutants (R219S and R219C) that had reduced reporter activity, as well as the truncation mutant G275X (Fig. 2c). All 14 promoted growth relative to the EV control line.
Fig. 2. Expression of FOXA1 mutants promotes growth and reveals distinct morphologies for the various classes of alterations.
(a) FOXA1-luciferase reporter assay with results normalized to level of FOXA1WT activity. Colors indicate position of altered amino acid within the FKHD DNA-binding domain depicted in Fig. 1a. Grey indicates truncation. (b) Overexpression of FOXA1 promotes growth in prostate organoids in standard media conditions (solid lines, n=3) and in restrictive media conditions (dashed lines, no EGF, n=8). EV = pCW empty vector control. (c) Overexpression of wild-type (+WT) or various FOXA1 mutants promotes growth 10 days after seeding in media lacking EGF. (d) Quantification of lumen containing organoids for each line in the FOXA1 allelic series. All p-values are relative to EV, calculated using unpaired, two-tailed Student’s T-test. (e) Histology and IHC of organoid lines overexpressing various alleles of FOXA1 (+WT or +Mut) via the doxycycline-inducible pCW vector 10 days after seeding. Images from a single biological experiment. (f) Summary of GSEA comparing FOXA1 wild type or mutant organoid lines to EV control for a basal_low (luminal) gene set, the hallmark EMT gene set, and a gene set of the top 100 genes induced following ERF knockdown in organoids. Data from RNA-seq of 3 biological replicates for each organoid line. Only comparisons with an FDR of <0.25 are shown with the corresponding normalized enrichment score (NES). Gene sets with a positive NES are enriched in organoids carrying either FOXA1 wild-type or mutant alleles. For panels a-d, data represented as mean +/− standard deviation (SD). Values for n biological replicates (indicated as dots) as well as specific p-values can be found in the source data file. * indicates p<0.05, ** indicates p<0.01. All p-values are relative to +WT unless otherwise noted, calculated using unpaired, two-tailed Student’s T-test.
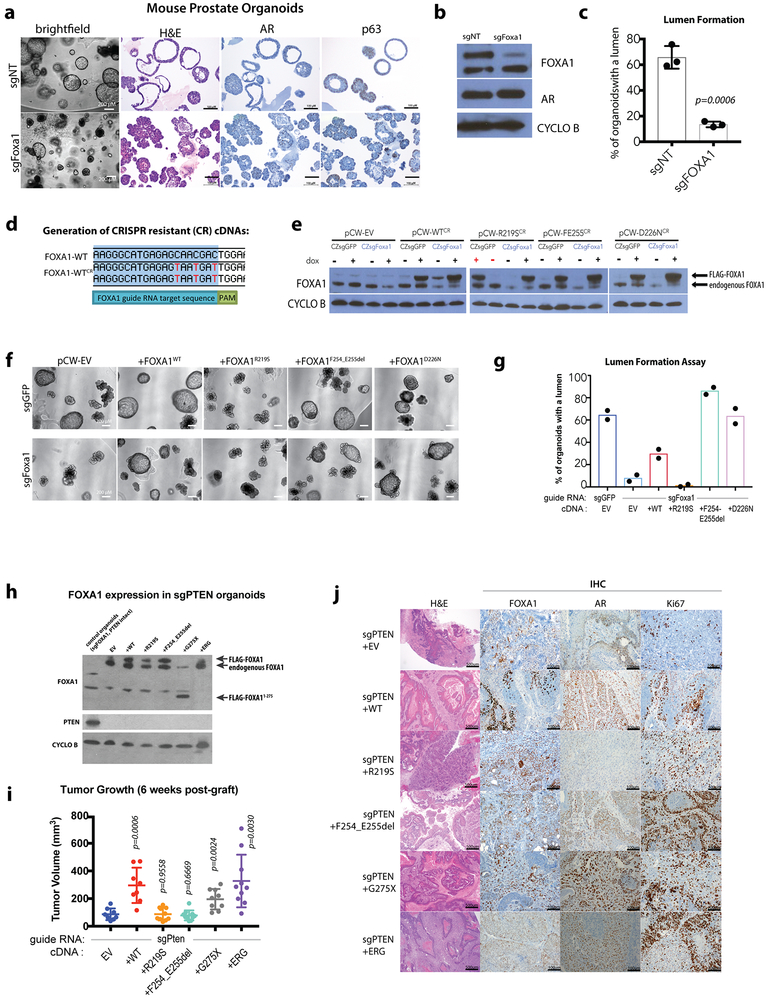
We next examined the histological features of these organoids. Strikingly, we observed that increased expression of FOXA1WT, FOXA1D226N and the Wing2 hotspot mutations all promote exaggerated lumen formation and size (Fig. 2d-e, Extended Data Fig. 3d). In contrast, organoids expressing FOXA1R219S, and to a lesser extent those expressing FOXA1R219C, were unable to form measurable lumens and the bi-layer orientation of basal (p63+) and luminal (AR+) cell layers appeared disrupted (Fig. 2e, Extended Data Fig. 3e). This phenotype resembles that of FOXA1-deficient organoids generated using CRISPR/Cas9 (Extended Data Fig. 4a-c), consistent with mouse models16. We also repeated the overexpression studies in endogenous Foxa1-deleted organoids using CRISPR-resistant cDNAs encoding two pro-luminal mutants (FOXA1F254_E255del and FOXA1D226N) and found that the pro-luminal phenotype was unchanged (Extended Data Fig. 4d-g). Findings from RNA sequencing were consistent with these histologies. Mutants conferring a pro-luminal phenotype showed similarity to ETS-mutant luminal organoids17 by gene set enrichment analysis with the notable exception being FOXA1R219S which instead showed enrichment of an epithelial-mesenchymal-transition (EMT) program and a repression of the ETS mutant gene set (Fig. 2f), consistent with its distinct morphology. We also examined the activity of FOXA1 in an in vivo setting18,19 and saw increased proliferation across all lines, an increase in subcutaneous tumor size in 2 of 4 lines (FOXA1WT and FOXA1G275X), and an increased prevalence of invasive, intraductal basal disease (defined by the loss of AR expression) in tumors derived from sgPTEN+FOXA1R219S organoids, consistent with FOXA1R219S histology in vitro (Extended Data Fig. 4h-j).
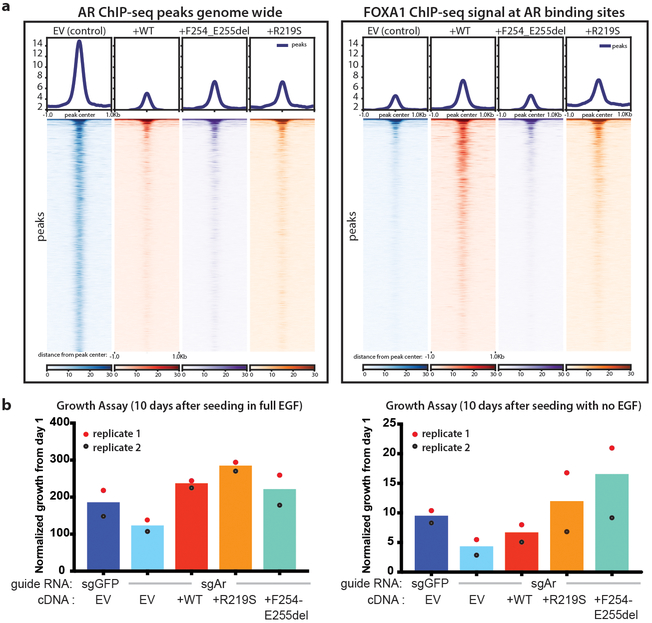
Given that FOXA1 is a cofactor for AR and that FOXA1 mutant cases in the TCGA cohort have higher AR scores than either normal samples or other subtypes6, we examined the AR cistrome. Intriguingly, the number of AR binding peaks (defined by AR ChIP-seq) is markedly reduced in organoids overexpressing wild-type or mutant FOXA1 (Fig. 3a, left, Extended Data Fig. 6a). However, FOXA1 binding is enhanced at the sites where AR binding is lost (Fig. 3a, right, p<1e-300, Extended Data Fig. 5a). This result suggests that FOXA1 may replace AR function at these sites, supported by the fact that the increased growth advantage conferred by FOXA1 is retained despite CRISPR deletion of Ar (Fig. 3b, Extended Data Fig. 5b). To reconcile the high AR scores seen in TCGA with this AR-independent growth program, we examined expression levels of the mouse orthologs of the human AR gene signature20 and found that the majority are induced by FOXA1 (Extended Data Fig. 5c). Thus, while the number of AR binding sites is substantially reduced, a core set of AR target genes are maintained in the setting of increased FOXA1 activity. We also asked if transcriptomic changes observed in the FOXA1-mutant mouse organoids were similar to those observed in FOXA1-mutant human tumors. Remarkably, the human orthologs of differentially expressed genes (DEGs) in FOXA1F254_E255del murine organoids were sufficient to cluster FOXA1 mutant tumors within the TCGA cohort (P = 2.1 × 10⁻⁸, Extended Data Fig. 5d).
Fig. 3. FOXA1 expression constricts the AR cistrome and promotes AR-independent growth programs.
(a) AR ChIP-sequencing in organoids overexpressing wild-type or mutant FOXA1 compared to control show significant changes in the AR cistrome in response to FOXA1 expression (left) and FOXA1 ChIP-seq showing FOXA1 binding at same loci. ChIP-seq data from two biological replicates. Statistical analysis of peaks can be found in Ext Data Fig. 6. (b) Overexpression of FOXA1 promotes growth in prostate organoids in the setting of significantly reduced AR (CRISPR-mediated deletion in a bulk population), in both standard media conditions (left panel) and in the absence of EGF (right panel). Two independent experiments result in the same growth trends for biological replicate 1 and 2.
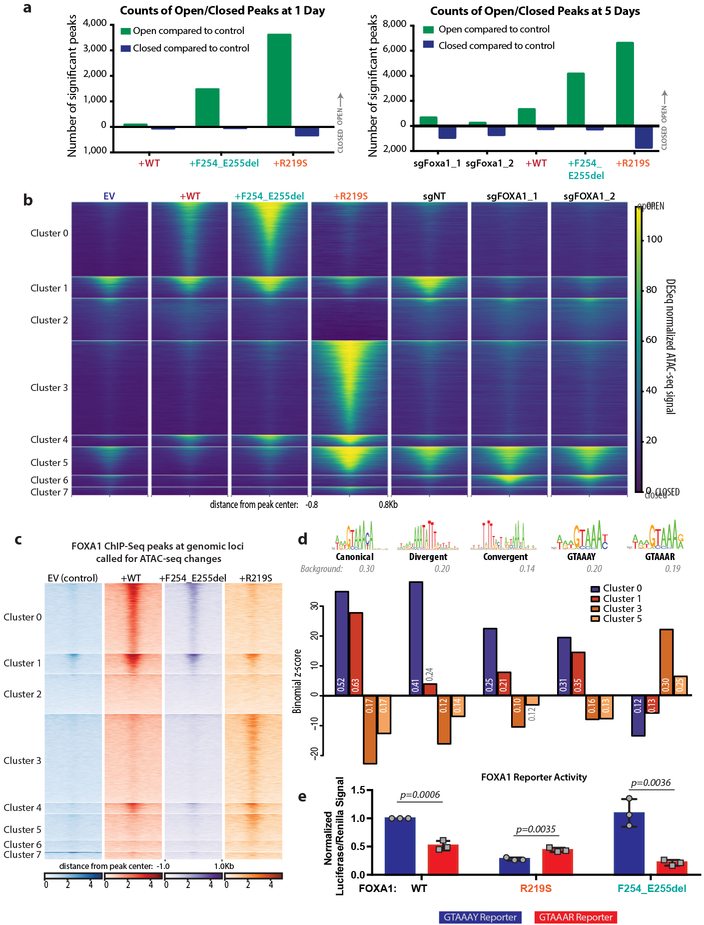
Given the role of FOXA1 as a pioneering transcription factor, we conducted a genome wide analysis of changes in open and closed chromatin using Assay for Transposase Accessible Chromatin sequencing (ATAC-seq). FOXA1WT expression led to an increase in open chromatin after 5 days (>1000 open peaks with significant change in accessibility, FDR < 0.05, log fold change of 2 in peak read coverage compared to control) whereas Foxa1 deletion led to the opposite, with the closing of ~1000 peaks. Organoids expressing FOXA1F254_E255del and FOXA1R219S also had increased peak numbers, but these changes occurred substantially faster (1 day) and involved many more peaks (Fig. 4a), consistent with altered pioneering activity.
Fig. 4. FOXA1 mutations cause dramatic shifts in the chromatin landscape.
(a) Number of significant peaks open or closed (log2FC >2 for open, <−2 for closed peaks) after dox treatment for pCW-FOXA1wild-type or mutant organoids relative to EV. Right panel includes counts for FOXA1 CRISPR organoids 5 days after trypsinization relative to sgNT. Data from 3 biological replicates, with FDR <0.05 using two-sided Wald test, with Benjamini-Hochberg FDR correction for multiple observations. (b) ATAC-seq peak heat maps comparing organoids with (sgFOXA1_1, sgFOXA1_2) or without (sgNT) CRISPR deletion of Foxa1 or expression of WT or mutant FOXA1 after 5 days of dox treatment, with eight clusters defined by hierarchical clustering. (c) FOXA1 ChIP-seq signal at genomic loci matching ATAC-seq clusters defined in panel b shows a similar pattern of peaks correlating FOXA1 binding with open chromatin. Data from two biological replicates. (d) Enrichment or depletion of FOXA1 motif variants in clusters that gain accessibility in +F254_E255del or +R219S organoids, including the canonical motif, divergent and convergent dimer motifs, and altered versions of the FOXA1 motif (GTAAAY, similar to canonical and GTAAAR, non-canonical), expressed as a binomial Z-score computed from the number of cluster peaks with >1 motif occurrence relative to background occurrence in all heatmap peaks. Occurrence within a given cluster is reported within the bar graph. Positive scores indicate enrichment; negative scores indicate depletion. (e) Luciferase reporter assay depicting activity of FOXA1 variants on GTAAAY (blue) or GTAAAR (red) DNA templates. Luciferase/Renilla signal normalized to signal from FOXA1WT on GTAAAY reporter. Data from 3 biological replicates represented as mean +/− standard deviation. p-values determined using unpaired, two-tailed Student’s T-test. No significant difference between activity of WT and R219S on the GTAAAR reporter (p= 0.2314). F254_E255del has significantly less activity on GTAAAR than either WT (p= 0.0059) or R219S (p= 0.0033).
Unsupervised clustering analysis identified distinct sets of peaks for FOXA1F254_E255del and FOXA1R219S (Fig. 4b). Cluster 0 is largely defined by dramatic peak changes observed with both FOXA1WT and FOXA1F254_E255del, demonstrating that overexpression of wild-type FOXA1 opens new regions of chromatin compared to control, which are even further exaggerated in cells expressing FOXA1F254_E255del. In contrast, organoids expressing FOXA1R219S gain thousands of distinct peaks (defined by clusters 3 and 5) without changes in cluster 0. ChIP-seq reveals that FOXA1 protein is binding at these same ATAC-seq loci (Fig. 4c, Extended Data Fig. 6a-d) and CDF plots confirm mutant-specific changes in expression of the genes that map to these newly open chromatin peaks (Extended Data Fig. 6e-h).
Curiously, motif analysis revealed enrichment of FOXA binding motifs in clusters 0 and 1 (FOXA1WT and FOXA1F254_E255del) (Extended Data Fig. 7a) but not in clusters 3 and 5 (FOXA1R219S) despite evidence of FOXA1R219S DNA binding and associated gene expression changes. However, de novo motif analysis of cluster 3 peaks identified a motif with similarities to the core GTAAA(C/T) FOXA1 binding motif but with substitution of (G/A) at position 6 for (C/T) (Extended Data Fig. 7b). This impression was confirmed by selective enrichment of the (G/A) motif in clusters 3 and 5 versus the (C/T) motif in clusters 0 and 1 (Fig. 4d). To provide evidence that this neomotif is functional, we repeated the reporter assays described previously (Fig. 2a) and found FOXA1R219S preferentially activates a DNA template modified to reflect the (G/A) bias at position 6, whereas FOXA1WT and FOXA1F245_E255del exhibit substantially higher activity on the canonical (C/T) sequence (Fig. 4e, Extended Data Fig. 7c-e), suggesting a mechanism by which FOXA1R219S selectively targets novel genomic loci. Finally, two motifs recently associated with FOXA1 dimers (convergent, divergent)21 were relatively enriched in cluster 0 versus cluster 1, potentially explaining the novel pioneering activity of FOXA1F254_E255del (Fig. 4d).
Collectively our analysis of mutant FOXA1 alleles in prostate cancer revealed unanticipated and diverse consequences for its pioneering function. Wing2 mutants have a gain in pioneering activity that is substantially greater than that observed by overexpression of comparable levels of FOXA1WT, but both alterations affect nearly identical regions of the genome (cluster 0) that are distinguishable from endogenous Foxa1 sites (cluster 1) based on enrichment of FOXA1 dimer motifs. We postulate that the changes in gene expression associated with these novel open regions contribute to oncogenesis. In contrast, FOXA1R219 mutants display pioneering function over distinct regions of the genome (clusters 3 and 5) enriched for a variant FOXA1 binding motif that, based on reporter assays, is permissive for FOXA1R219 binding despite mutation of the helix 3 consensus DNA binding residue. Further investigation of relative DNA binding affinities of these mutants for the different motifs, as well as the potential role of the Wing2 domain in this retained DNA binding (based on known DNA contacts through the minor groove) is warranted. In both classes of mutations, the biological consequence is lineage plasticity for pro- versus anti-luminal programs.
Methods
Pan-prostate mutation analysis
The 12 cohorts used for analysis (total of 3086 samples) included published data sets as well as unpublished data from MSK-IMPACT 1708 cohort (frozen 5–25-18), across all stages of prostate cancer (see Table S1). Samples were compiled and duplicate samples were pruned to generate a master list of 3086 prostate cancer cases, which were then stratified based on their FOXA1 alteration status and the class of mutation in the samples. Wing2 hotspot includes cases with mutations or indels between H247 and E269. Truncations after the FKHD domain were defined as any frameshift alteration distal to residue E269. Any mutations that did not specifically fall into one of the distinct classes was called ‘other.’ Sample analysis was performed in part using the CBioPortal for Cancer Genomics22,23.
3D modeling
Three-dimensional representation of the FKHD domain of FOXA3 complexed with DNA was generated using PyMOL (PDB: 1VTN).
Constructs
To create pCW-FLAG-2A-dsRED (pCW-EV), sequences for p2A and DsRED were cloned in the pCW-Cas9 plasmid (Addgene Plasmid #50661) using in-fusion cloning (Takara Bio). To generate pCW-FLAG-mFoxa1-2A-dsRED (pCW-Foxa1), mouse Foxa1 cDNA was cloned into pCW-FLAG-2A-dsRED using in-fusion cloning (Takara Bio). All primers and sequences are listed in Supplementary Table 2. To generate the sgRNA vector CRISPR-Zeo, GFP from pLKO5.sgRNA.EFS.GFP (a gift from Benjamin Ebert, Addgene plasmid #57822) was excised with BamHI and MluI. The Zeo-resistance gene was removed from lenti sgRNA(MS2)_zeo backbone (a gift from Feng Zhang, Addgene plasmid #61427) using BsrGI and EcoRI. ZeoR was ligated into the pLKO5.sgRNA.EFS backbone in a four-way ligation using BamHI/BsrGI and EcoRI/MluI adaptors. To create LVX-UbC-EGFP-Luc2_Hygro construct in order to be able to visualize injected cells by live imaging or GFP IHC, we first generated the plasmid LVX-UbC-EGFP-Luc2_Puro in the following way: 0.72 kb EGFP cDNA from pQCXIP-EGFP24 was cloned into the BamHI and NotI sites of pLVX-TRE3G-IRES (Clontech, cat. 631362) via a EcoRI/NotI cloning adaptor to make pLVX-TRE3G-EGFP-IRES. The TRE3G promoter was then removed with an XhoI and BamHI digestion, and replaced with the 1.26 kb UbC promoter obtained from Duet011 (Addgene) with a PacI and BamHI digest and using a XhoI/PacI cloning adaptor to make pLVX-UbC-EGFP-IRES. pLVX-UbC-EGFP-Luc2 was then constructed by cloning the 1.7 kb Luc2 cDNA derived from pGL4.10(luc2) (Promega) with a HindIII and XbaI digest into the MluI and EcoRI sites of pLVX-UbC-EGFP-IRES via MluI/HindIII and XbaI/EcoRI cloning adaptors. The puromycin cassette was replaced with the hygromycin to generate LVX-UbC-EGFP-Luc2_Hygro.
Generation of FOXA1 mutant cDNA
Site directed mutagenesis was carried out on pCW-FLAG-Foxa1–2A-dsRED to induce patient mutations in the cDNA using the QuikChange II XL Site-Directed Mutagenesis Kit (Agilent), according to manufacturer’s protocol. Primers were designed using Agilent’s QuikChange Primer Design tool (https://www.genomics.agilent.com/primerDesignProgram.jsp). To prevent CRISPR/Cas9 targeting by sgFOXA1_1 sgRNA mutagenesis was used to introduce three silent mutations in the sgRNA recognition sequence (see Extended Data Fig. 8A).
Guide RNA design
Guide RNAs targeting murine Foxa1, Ar, and Pten were generated using the CRISPR Design Tool (http://crispr.mit.edu). sgFoxa1_1 targets the cDNA near the 5’ end, while sg_Foxa14 and sgFoxa1_15 target the FKHD DNA-binding domain. Control guides sgNT (targeting safe harbor locus AAVS125 and sgGFP were used. All guide RNAs were cloned into lentiCRISPRv2 (Addgene #52961), lentiGuide-Puro (Plasmid #52963) or CRISPR-Zeo using BsmbI digest, per Zhang lab protocol. For cells carrying CRISPR-Zeo or lentiGuide-Puro, lentiCas9-Blast (a gift from Feng Zhang, Addgene plasmid #52962) was used as the Cas9 source.
FOXA1 luciferase reporter pGL-5xFBS-Luc
Oligonucleotide fragments containing 6 tandem FKHD consensus (canonical or non-canonical) motifs with 5bps spacers (Table S2) were cloned into pGL4.28 luc2CP/minP/hygro (Pomega) between HindIII and XhoI restriction sites. Oligonucleotide sequences were verified using Sanger sequencing. Canonical FOXA1 binding sites were based on the top binding motifs predicted based on ChIP-seq results in HepG2 cells26, while non-canonical was based on top hit of de novo motif analysis of ATAC-seq cluster 3 using HOMER (Extended Data Fig. 10). The pGL-5xFBS-Luc was transiently transfected using Lipofectamine 2000 (ThermoFisher) into lentiX293T cells (Clonetech) along with CMV-Renilla (pRL-CMV Renilla, Promega) as an internal control. Response ratios are expressed relative to signal obtained for the positive control wells transfected 170ng of pCMV6-mFOXA1mycDDK (Origene #MR225487), which was set to 1, and the negative control well receiving 170ng of ‘stuffer’ DNA (pCW-FLAG-2A-dsRED (pCW-EV), no exogenous FOXA1), which was set to 0. To test the response of these reporters to varying levels of FOXA1 introduced into the system, ratios of pCMV6-mFOXA1mycDDK and pCW-EV constructs were altered, keeping the total amount of DNA transfected into each well constant. In evaluating the relative response ratios (RRR) between FOXA1WT and various mutants, one concentration of cDNA (170ng/well) was used and RRR reflect activity of given variant on the reporter. Luminescence measurements were taken 24 hours after transfection. All results are means and standard deviations from experiments performed in at least replicates (see figure legends for details), and Firefly luciferase activity of individual wells were normalized against Renilla luciferase activity.
Organoid Lines
Blue Red Organoids (BRO line) was established as previously described15 from mice harboring Red Fluorescent Protein (RFP) driven by a composite human Keratin 18 promoter and a Cerulean Fluorescent Protein (CFP) driven by a bovine Keratin 5 promoter27. BROs were transduced with lentiCrispv2 carrying either sgNT or sgFoxa1_1 and selected using puromycin. BRO lines were maintained in standard mouse organoid media conditions15. K14–1 organoids were derived from mice harboring an actin-GFP fusion protein driven by a human Keratin14 promoter28. K14–1 organoids were transduced with the allelic series of pCW-Foxa1 wild-type or mutant constructs, as well as pCW-EV as a control. Bulk cells were selected using puromycin. K14–1 organoids were maintained in standard mouse organoid media conditions15, with 2.5ng/mL EGF supplementation. For rescue experiments of either Foxa1 deletion or Ar deletion, K14–1 organoids carrying pCW-Foxa1 constructs were subsequently transduced with lentiCas9-blast, bulk selected with blasticidin, and next transduced with either CRISRP-Zeo sgFoxa1_1 or sgNT, or sgAR and bulk selected with zeocin. Rosa26-Cas9-sgPTEN-luc2-pCW-FOXA1 organoids were derived from a homozygous Rosa26 Lox-stop-Lox Cas9 mouse (C67BL/6J background, Jackson Laboratory # 026175) and transduced with adenoCRE-GFP in vitro to gain expression of Cas9. These cells were then transduced with lentiGuide-Puro-sgPten and bulk selected with puromycin, transduced with LVX-UbC-EGFP-Luc2_Hygro and bulk selected with hygromycin, then were transduced with the allelic series of pCW-Foxa1 wild-type or mutant constructs or pCW-ERG, as well as pCW-EV as a control, and sorted for dsRED expression to enrich for transduced cells.
Organoid Culture
Murine organoids were sorted, cultured in 3D and transduced with lentiviruses as described previously15,29. Organoids infected with pCW-EV, pCW-FOXA1, or LentiCrispV2 constructs were selected with 2μg/ml puromycin for 5 days, 3–4 days post transduction, while those infected with CRISPR-Zeo were selected for 7 days with 30μg/mL, 3–4 days post transduction. Transduction with Lenti-Cas9-Blast was followed by 5 days of selection in 10μg/ml blasticidin. Preparation of 3D organoids for histology was carried out as previously described15. H&E staining and IHC was carried out by the MSKCC Molecular Cytology Core.
Growth Assays
Organoids were treated with doxycycline (dox) (500ng/mL) to induce expression of the FOXA1–2A-DsRED fusion then sorted 2 days later to enrich for DsRED+ cells. Cells were seeded at a density of 10cells/μl (2,000 cells/20μl dome, 3 domes per line per time point, each dome in a single 48-well plate well) and maintained on dox for the duration of the assay, refreshing media every 2–3 days. Y-27632 was supplemented for the first feeding at 10 μM. To measure proliferation, matrigel domes were washed with PBS, and then resuspended in 100μl of PBS, and CellTiter-Glo 2.0 Assay was used, following manufactures instructions. Triplicate values for each time point were averaged, and all values on subsequent days were normalized to the day 1 reading. Experiments were repeated at least three independent times and each line was normalized to the EV control readings for a given replicate.
Lumen Formation Assays
Organoids treated with doxycycline (dox) (500ng/mL) to induce expression of the FOXA1–2A-DsRED fusion. Dox treated cells were sorted 2 days later to enrich for DsRED+ cells. Sorted cells were seeded in matrigel at a density of 3 cells/μl (eight 25μl domes per) and maintained on dox for the duration of the assay, with the media refreshed every 2–3 days. Y-27632 was supplemented for the first feeding at 10μM. After 10 days, organoids were scored for the presence or absence of a visible lumen by bright field microscopy, and percent of the total number of organoids that possessed a lumen was determined based on examining ~50 to 200 organoids in a typical experiment. In CRISPR organoid lines sorting was not performed for lumen formation assay. Instead cells were trypsinized to a single cell suspension, counted using trypan blue exclusion, and then seeded as described above. Experiments were repeated three independent times.
Lumen Area Measurements
Organoids treated with doxycycline (dox) (500ng/mL) to induce expression of the FOXA1–2A-DsRED fusion. Dox treated cells were sorted 2 days later to enrich for DsRED+ cells. Sorted cells were seeded in matrigel in dilution series of densities ranging from 32 cells/μl down to 4 cells/μl (5 domes per density per line) and maintained on dox for the duration of the assay, with the media refreshed every 2–3 days. Y-27632 was supplemented for the first feeding at 10 μM. After 10 days, the area of each visible lumen was measured using light microscopy and Nikon NIS elements software. In a typical experiment, ~30–50 organoids were measured.
Western Blot
Membranes were probed with antibodies directed against AR (1:1,000, ER179(2), Abcam), FOXA1 (1:1000, Ab2, Sigma), Cyclophilin B (1:1000, EPR12703(B), Abcam), FLAG (1:1000, M2, Sigma) or PTEN (1:1000, D4.3, Cell Signaling). Signal was visualized with secondary HRP conjugated antibodies and ECL.
Immunohistochemistry
Organoids and tumors were processed and stained as described previously15. The following antibodies were used for staining on murine organoids and organoid derived xenografts: HNF-3 alpha/FoxA1 Antibody (3B3NB) 5ug/mL (Novus Biologicals), AR (1:1,000, N-20, Santa Cruz), p63 (1:800, 4A4, Ventana). Stainings were visualized with bright vision (Dako), Ki67 (Abcam #ab15580 at 1ug/ml).
In vivo experiments
In vivo xenograft experiments were done by subcutaneous injection of 2 ×10⁶ dissociated organoid cells (Rosa26-Cas9-sgPTEN-luc2-pCW-FOXA1 or ERG) resuspended in 100 μl of 50% matrigel (BD Biosciences, San Jose, CA) and 50% growth media into the flanks of 5 8–12 week old male NOD.Cg-Prkdcscid Il2rgtm1Wjl/SzJ mice (#005557, The Jackson Laboratory, Bar Harbor, ME) to yield 10 tumors per group. As soon as palpable, tumor volume was measured weekly using the tumor measuring system Peira TM900 (Peira bvba, Belgium). Tumors were then harvested at given timepoints for histology using 4% paraformaldehyde. All animal experiments were performed in compliance with the guidelines of the Research Animal Resource Center of the Memorial Sloan Kettering Cancer Center. In accordance with our IACUC and our approved protocol, none of the mice exceeded the maximal tumor burden allowed (total for both sides) of 2000mm3.
RNA isolation and sequencing
RNA was extracted from organoids using an RNeasy Kit (Qiagen). Freshly sorted dsRED+ cells were seeded in triplicate per infected construct at the start of the assay, and moving forward, replicates were processed independently, collected at the appropriate time points. Library preparation and sequencing were performed by the New York Genome Center, where RNA-sequencing libraries were prepared using the TruSeq Stranded mRNA Library Preparation Kit in accordance with the manufacturer’s instructions. Briefly, 100ng of total RNA was used for purification and fragmentation of mRNA. Purified mRNA underwent first and second strand cDNA synthesis. cDNA was then adenylated, ligated to Illumina sequencing adapters, and amplified by PCR (using 10 cycles). Final libraries were evaluated using fluorescent-based assays including PicoGreen (Life Technologies) or Qubit Fluorometer (Invitrogen) and Fragment Analyzer (Advanced Analytics) or BioAnalyzer (Agilent 2100), and were sequenced on an Illumina HiSeq2500 sequencer (v4 chemistry, v2 chemistry for Rapid Run) using 2 × 50bp cycles. Reads were aligned to the mm10 mouse reference using STARaligner30 (v2.4.2a). Quantification of genes annotated in Gencode vM2 was performed using featureCounts (v1.4.3) and quantification of transcripts using Kalisto (doi:10.1038/nbt.3519). QC was collected with Picard (v1.83) and RSeQC31 (http://broadinstitute.github.io/picard/). Normalization of feature counts was done using the DESeq2 package (doi:10.1101/002832).
Analysis of RNA-sequencing from mouse organoids and patient samples
The gene read count data of TCGA primary prostate cancer were downloaded by GDC tool. The mouse and human homologous genes were downloaded from Mouse Genome Informatics of The Jackson Laboratory (http://www.informatics.jax.org/homology.shtml). Differential expression analyses were performed using DESeq2 (https://bioconductor.org/packages/release/bioc/html/DESeq2.html) based on the gene read count data. Multiple-hypothesis testing was considered by using Benjamini-Hochberg (BH; FDR) correction. The statistical significance of the overlap between two groups of genes was tested using Fisher’s exact test. GSEA was performed using JAVA program (http://www.broadinstitute.org/gsea) and run in pre-ranked mode to identify enriched signatures. The GSEA plot, normalized enrichment score and FDR and q-values were derived from GSEA output. The following gene sets were used: Hallmark Gene Sets, Neuroendocrine High12, Basal low32, and shERF up17.
Prostate cancer tumor samples and microarray data
A total of 1,959 radical prostatectomy (RP) tumor expression profiles were used for training and testing. For training and testing, we utilized RNA-seq expression and DNA mutation data from The Cancer Genome Atlas (TCGA) prostate cancer project6 (n=333). For testing, the expression profiles of retrospective (n=1,626) were derived from the Decipher GRID registry (). The retrospective GRID cohort was pooled from seven published microarray studies: Cleveland Clinic33 (CCF), Erasmus MC34, Johns Hopkins35 (JHMI), Memorial Sloan Kettering36 (MSKCC), Mayo Clinic37,38 (Mayo I and Mayo II), and Thomas Jefferson University39 (TJU). Associated accession numbers are: GSE79957, GSE72291, GSE62667, GSE62116, GSE46691, GSE41408, and GSE21032. DNA and RNA from the TCGA cohort were extracted from fresh frozen RP tumor tissue, as previously described6. RNA from the GRID cohorts was extracted from routine formalin-fixed, paraffin embedded (FFPE) RP tumor tissues, amplified and hybridized to Human Exon 1.0 ST microarrays (Thermo-Fisher, Carlsbad, CA).
FOXA1 mutant transcriptional signature
By following the similar strategy as previously reported for SPOP mutants13, we developed the FOXA1 mutant transcriptional signature that includes 67 genes differentially expressed between FOXA1 mutant and wild-type samples from TCGA prostate cancer RNA-seq data. The low-expressed genes (mean RSEM <1) were filtered before the analysis. Specifically, we identified significantly differentially expressed genes by comparing FOXA1 mutants within forkhead DNA-binding domain and wild-type cases as determined from DNA mutational analyses among TCGA samples lacking ETS family gene fusions (ERG, ETV1, ETV4 and FLI1), using Wilcoxon rank-sum test and controlled for false discovery using Benjamini-Hochberg adjustment (FDR ≤0.05).
SCaPT development based on FOXA1 mutant transcriptional signature and SVM model
To predict tumors in the FOXA1 mutant subclass in the absence of DNA sequencing data (i.e., microarray datasets), we developed the SCaPT (SubClass Predictor based on Transcriptional data) model based on support vector machine (SVM) model. Given a set of training data marked with two categories, SVM builds a model that assigns testing data into one category or the other, making it a non-probabilistic binary linear classifier. In our SCaPT model, the training data were defined as the transcriptional z-scores of FOXA1 mutant signature from TCGA cohort. The testing data would be the transcriptional z-scores from RNA-seq or microarray expression data of FOXA1 mutant signature.
Prostate cancer molecular subclass prediction by decision tree
In each individual study of retrospective and prospective GRID cohorts, FOXA1 mutant subclass was firstly predicted using the SCaPT model. Next, using a decision tree and previously developed microarray-based classifiers for the ERG+ and ETS+ subtypes, we classified the remaining cases in each cohort. Some cases with both predicted FOXA1 mutant and ERG+/ETS+ status were classified as conflict subclass, and the rest without FOXA1 mutant calling and outlier expression were considered as ‘other’ subclass.
Statistical analysis of human data
Statistical analyses were performed in R v3.4.0 (R Foundation, Vienna, Austria). All statistical tests were two-sided with the significance level of p <0.05. Univariate logistic regression analyses were performed on the combined cohort to test the statistical association between FOXA1 mutant status and clinical variables, including age, race, preoperative PSA, Gleason score, lymph node invasion (LNI), surgical margin status (SMS), extracapsular extension (ECE), and seminal vesicle invasion (SVI). We evaluated the associations between FOXA1 mutant status and patient outcomes including biochemical recurrence (BCR), metastasis (MET) and prostate cancer specific mortality (PCSM), based on Kaplan-Meier analysis.
Assay for Transposase Accessible chromatin (ATAC) coupled with Next Generation Sequencing (NGS)
Freshly sorted cells carrying pCW constructs (dsRED+) were seeded in triplicate per infected construct at the start of the assay, and moving forward, replicates were processed independently, collected at the appropriate time points. CRISPR cell lines carried LentiCRISPRv2 with either the control guide (sgNT), guide 14 for FOXA1 (“sgFOXA1_1”) or guide 15 for FOXA1 (“sgFOXA1_2”). At time of collection, cells were trypsinzed, and 50,000 cells (counted by using trypan blue exclusion) were processed for ATAC-sequencing as follows. After a wash step in cold Cell Wash Buffer (CWB= 10 mM Tris-HCl pH 7.4, 10 mM NaCl, 3 mM MgCl2), outer membranes were disrupted in lysis buffer (CWB + 0.1% NP40) for 2min on ice. Lysis reaction was stopped with the addition of 1ml of CWB. After a centrifugation step 1,500g for 10min, pelleted nuclei are kept for the next step. In a 50μl final volume, tagmentation was performed for 30min at 37C, using the kit Nextera DNA library prep kit (Illumina cat# FC-121–1030). After addition of SDS 0.2% final concentration, DNA is purified in AMPure XP beads (Beckman Coulter cat# A63881) using a ratio 2:1 (V/V) beads:tagmented DNA.Freshly eluted DNA was barcoded and amplified in 110μl PCR volume (NEB Next Q5 Hot Start HiFi PCR, cat# M0543L) to generate library with the following PCR program: 65C, 5min, 98C, 30sec, (98C, 10sec – 65C, 30sec) *11cycles, 4C hold. Quality control of the libraries was performed with Bioanalyzer 2200 (Agilent technologies, D1000 screentapes & reagents, cat# 5067–5582) to assess size range of amplified DNA fragments and with Quant-iT™ PicoGreen™ dsDNA Assay Kit (Thermofisher cat# P11496) to quantify the DNA fragments generated. ATAC Libraries were then pooled at equimolar concentration and were sequenced multiplexed on the Illumina HiSeq with 50bp paired-end.
ATAC data and preprocessing
ATAC-seq data preprocessing was performed as previously described Raw ATAC-seq reads were trimmed and filtered for quality using Trim Galore! v0.4.5 (http://www.bioinformatics.babraham.ac.uk/projects/trim_galore/) powered by CutAdapt v1.16 (https://doi-org.proxy.library.cornell.edu/10.14806/ej.17.1.200) and FastQC v0.11.7 (http://www.bioinformatics.babraham.ac.uk/projects/fastqc/). Paired end reads were aligned to the mm10 genome using Bowtie2 v2.3.4.1 in very sensitive local mode (-q –local –very-sensitive-local –no-discordant –no-mixed –dovetail -I 10 X 20), and paired reads that mapped to different chromosomes or that mapped too far away were discarded. Unpaired reads, discordant reads, reads with mapQ < 20, or SAM flags 0×4 and 0×400, as well as reads marked as optical or PCR duplicates using picard MarkDuplicates v2.18.3-SNAPSHOT and reads overlapping the ENCODE mm10 functional genomics regions blacklist (at mitra.stanford.edu/kundaje/akundaje/release/blacklists/mm10-mouse/mm10.blacklist.bed.gz) were removed to improve the quality of the retained fragments. To correct for the fact that the Tn5 transposase binds as a dimer and inserts two adapters in the Tn5 tagmentation step, all positive-strand reads were shifted 4 bp downstream and all negative-strand reads were shifted 5bp upstream to center the reads on the transposase binding event.
Overall mapping statistics confirmed high quality ATAC-seq data, with a high alignment rate (over 76.8% in all samples) and high coverage (over 30M aligned read pairs per sample) across experiments (Supplementary Table 13). As an additional quality control metric, we confirmed that all ATAC-seq libraries displayed the expected insert size distribution computed from aligned read pairs, with nucleosome-free, mono-nucleosomal, and di-nucleosomal modes (see Extended Data Fig. 8a for representative plots).
ATAC peak calling, reproducibility analysis and atlas creation
We then pooled the shifted reads by sample and identified peaks using MACS2 with a threshold of FDR-corrected P < 0.01 using the Benjamini-Hochberg procedure for multiple hypothesis correction. As called peaks may be caused by noise in the assay and not reflect true chromatin accessibility, we calculated an irreproducible discovery rate (IDR) for all pairs of replicates across a cell type. Given two ranked lists of events from replicate experiments, in this case peak calls ranked by P value, IDR estimates a threshold at which events are no longer reproducible. Using this measure, we excluded peaks that were not reproducible (IDR < 0.005) in at least one pair of replicates for at least one cell type/time point.
Reproducible peaks from each cell type were combined to create a genome-wide atlas of accessible chromatin regions. Reproducible peaks from different samples were merged if they overlapped by more than 75%. This produced an atlas of ~182.8K reproducible peaks of median width 586 bp. The numbers of reproducible peaks per time point and organoid line are provided in Supplementary Table 14. Track diagrams at specific loci visually confirm that replicate ATAC-seq experiments show reproducible accessible sites (Extended Data Fig. 8b).
Assignment of ATAC-seq peaks to genes
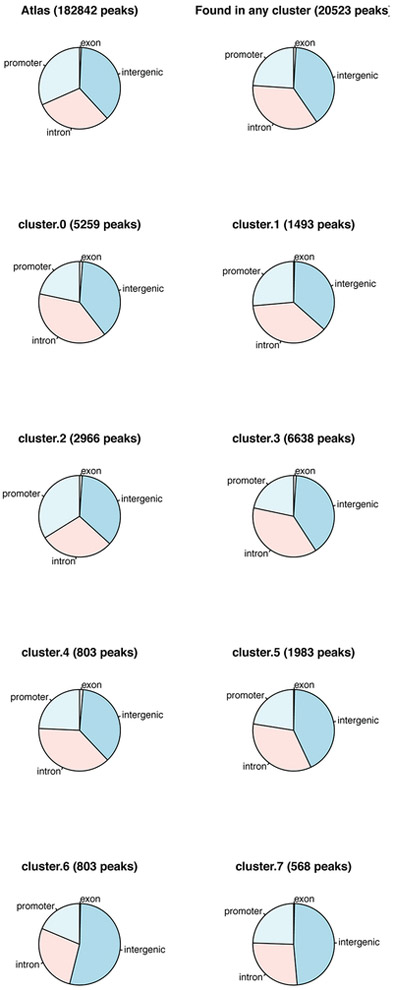
The RefSeq transcript annotations of the mm10 mouse genome were used to define the genomic location of transcription units. For genes with multiple gene models, the longest transcription unit was used for the gene locus definition. ATAC-seq peaks located in the body of the transcription unit, together with the 2kb regions upstream of the TSS and downstream of the 3′ end, were assigned to the gene. If a peak was found in the overlap of the transcription units of two genes, one of the genes was chosen arbitrarily. Intergenic peaks were assigned to the gene with a TSS or 3′ end that was closest to the peak. In this way, each peak was unambiguously assigned to one gene. Peaks were annotated as promoter peaks if they were within 2kb of a transcription start site. Non-promoter peaks were annotated as intergenic, intronic or exonic according to the relevant RefSeq transcript annotation. The atlas-wide distribution of promoter/intergenic/exonic peak assignment was consistent with high-quality ATAC-seq data sets (Extended Data Fig. 9), with 31.6% of peaks at promoters and the rest nearly equally divided between intergenic and intronic regions, with a small fraction annotated as exonic.
Differential peak accessibility
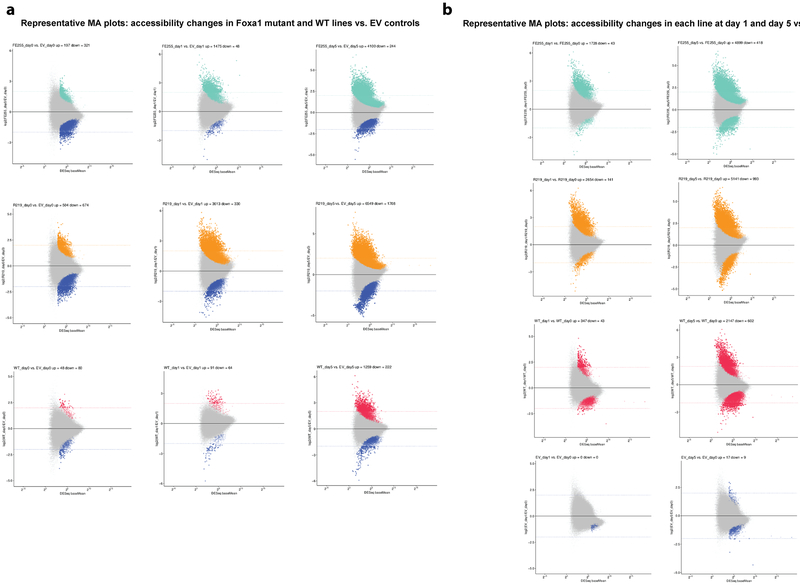
Reads aligning to the atlas peak regions were counted using htseq-count (-r pos s no). Differential accessibility of the peaks was assessed by applying DESeq2 v1.18.1 to this count table, considering all pairwise comparisons of cell types. Peaks were defined as differentially accessible if they satisfied an FDR-corrected P < 0.05 and if the magnitude of the DESeq-normalized counts changed by a stringent factor of 4 or more between at least one pairwise comparison of organoid line to control (the comparisons used were EV day 1 vs. FE255 day 1, EV day 1 vs. R219 day 1, EV day 1 vs. WT day 1, EV day 5 vs. FE255 day 5, EV day 5 vs. R219 day 5, EV day 5 vs WT day 5, WT day 1 vs. FE255 day 1, WT day 1 vs. R219 day 1, EV day 5 vs. FE255 day 5, WT day 5 vs. R219 day 5, sgNT day 5 vs. sgFOXA1-sg1 day5, and sgNT day5 vs sgFOXA1-sg2 day5) two-sided Wald test, with Benjamini-Hochberg correction for multiple observations. MA plots for pairwise differential accessibility analyses confirmed that normalization was appropriate and that differential peaks displayed robust changes (see Extended Data Fig. 10 for representative plots and Supplementary Table 16 for numbers of differentially accessible peaks). These analyses produced a set of ~20.5K differentially accessible peaks of median width 410bp; as expected, differential peaks were enriched for intergenic/intronic annotations and depleted for promoter annotations (Extended Data Fig. 9).
ATAC-seq peak clustering
The ATAC-seq peak heat maps were created using the DESeq size-factor normalized read counts, applying the variance-stabilizing transformation to the full peak atlas, selecting the differentially accessible peaks, and then clustering using hierarchical clustering with the ward.D distance metric. Clusters were defined by cutting the hierarchical clustering at the first 8 bifurcations of the dendrogram by ward.D distance. The number of clusters was chosen to be 8 based on observation of biologically interesting patterns of accessibility observation of biologically interesting differences in the clustering, and then peaks were sorted within each cluster by maximum signal
Peak heat maps
Heat maps (tornado plots) of peaks were generated by combining signals across replicates and binning the region +/− 750bp around the peak summit in 1bp bins after adjusting the reads for Tn5-induced bias, resulting in one signal track for each cell type/time point. Heat maps were generated using deeptools 3.0.2.
De novo transcription factor motif analysis
The Homer v4.10 utility findMotifsGenome.pl was used to identify the top ten transcription factor (TF) motifs enriched in each of the clusters produced by deeptools from each time point relative to genomic background. The top motifs were reported and compared to the Homer database of known motifs and then manually curated to restrict to TFs that are expressed based on RNA-seq data and to group similar motifs from TFs belonging to the same family.
FIMO motif search
Motif enrichment was performed relative to the 8 clustered defined by hierarchical clustering of 20,523 differentially accessible peaks (described above). Each ATAC-seq peak in the atlas was scanned for 718 TF motifs in the Mus musculus CIS-BP database40 using FIMO41 of MEME suite42, using the default P value cutoff of 1e-4. The background sequence distribution for motif analysis was based on nucleotide frequencies in the full set of 20,523 differentially accessible peaks (A = T = 0.2711, C = G = 0.2289). Of the 718 motifs in the database, 713 had a match within at least one peak among the differentially accessible peaks.
FIMO motif analysis
We restricted to 298 TFs whose median RNA-seq expression across biological replicates was above 5 RPKM in at lease one organoid line/time point. In addition, CTCF and CTCFL, DNA-binding proteins associated with 3D chromatin structure, were excluded. To rank the level of enrichment of TF motifs in each cluster relative to the background, the number of peaks containing each motif was calculated for each cluster and for the full set of differentially accessible peaks. Enrichment/depletion scores for each motif in a cluster were reported as binomial Z-scores relative to the background of motif occurrences in the set of differential ATAC-seq peaks. Namely, if p represents the probability that a peak in the background set contains an occurrence of the motif, then the binomial Z-score for a cluster of size N with C peaks containing the motif is . While these Z-scores do not incorporate a correction for multiple hypotheses, in practice the top-ranked motifs have such strong enrichments that they would still be highly significant after correction.
Non-canonical FOXA1 motif analysis
To examine enrichment/depletion of non-canonical Foxa1 motifs, we considered four additional motifs. First, we examined previously reported convergent and divergent Foxa1 dimer motifs. Second, we altered the canonical Foxa1 motif by replacing position 6 of the core GTAAAC/T pattern with either and equal probability of C/T (similar to canonical) or an equal probability of A/G (non-canonical). We used FIMO to search for hits of these motifs across differential peaks and reported enrichment/depletion within clusters as binomial Z-scores as before.
Chromatin Immuno-Precipitation (ChIP) coupled with Next Generation Sequencing (NGS)
Freshly sorted cells carrying pCW constructs (dsRED+) were seeded in duplicate per infected construct at the start of the assay, and moving forward, replicates were processed independently, collected following 5 days of doxycycline treatment. At time of collection, cells were trypsinized, and 70,000 cells (counted by using trypan blue exclusion) were processed for ChIP-sequencing as follows. Cells were fixed with formaldehyde (1%) and reaction was quenched with Glycine 1.25M and Tris 1M pH8. Fixed cells were lysed with SDS lysis solution containing protease inhibitors. Re-suspended pellets were sonicated, precipitated with antibodies (HNF-3 alpha/FoxA1 Antibody (3B3NB) (Novus Biologicals), AR (ER179(2), Abcam) and protein A/G bead complex. The chromatin and immune-complex were sequentially washed with a low-salt solution, high-salt solution, LiCl solution and Tris-NaCl solution. Chromatin was eluted from the complex with a solution containing 1% of SDS and 0.1 mol/l of NaHCO3. Cross-linking between DNA and protein was reversed by adding NaCl solution and incubating at 65°C over-night. Libraries were made using NEBNext Ultra II DNA library prep kit for Illumina (NEB E7645L). Quality control was performed with Bioanalyzer 2200 (Agilent technologies, D1000 screentapes & reagents, cat# 5067–5582) to assess size range of amplified DNA fragments, and with Quant-iT™ PicoGreen™ dsDNA Assay Kit (Thermofisher cat# P11496) to quantify the DNA fragments generated. ChIP Libraries were then pooled at equimolar concentration and were sequenced multiplexed on the Illumina HiSeq with 50bp paired-end sequencing.
Bioinformatic analysis ChIP-seq
Raw reads were first trimmed with Trimmomatic 43 (v0.35, options: LEADING:3 TRAILING:3 SLIDINGWINDOW:4:15 MINLEN:36) to remove adapters and low-quality sequences. They were then aligned with bowtie244 (v 2.2.6, options: --local --mm --no-mixed --no-discordant) using mm10 genome. After alignment, PCR duplicates were removed with Picard tools (http://broadinstitute.github.io/picard/) (MarkDuplicates v2.9.0) and peaks were called individually for each replicate with MACS245 (v2.1.0.20151222, --options: keep-dup 1 -g mm -p 0.05). These called peaks between replicates were then used with IDR46 (v2.0.2) framework to identify reproducible peaks. Deeptools (v3.1.3) was used for visualization and HOMER (v4.10.3) was used for discovering de novo motifs.
ChIP-seq normalization and analysis
To analyze ChIP-seq signal for AR and FOXA1 in each organoid line relative to ATAC-seq clusters, we normalized ChIP-seq data across experiments based on background signal, namely by defining flanking regions of reproducible peaks and using DEseq scaling factors relative to these regions for library size normalization. To compare AR or FOXA1 binding between a pair of organoid lines with respect to an ATAC-seq cluster, we compared the corresponding distributions of normalized ChIP-seq signal over peaks in the cluster by a one-sided Wilcoxon rank sum test.
Extended Data
Extended Data Figure 1. Patients with predicted FOXA1 mutant status have worse outcomes.
(a) Co-crystal structure of the FKHD domain of FOXA3 in complex with DNA resembling the FKHD consensus sequence (PDB 1VTN), with residues and folds of interest indicated, including α-helix3 (orange), which sits in the major groove of DNA, and Wing2 (cyan), which undergoes frequent mutation in prostate cancer. (b) Kaplan-Meier showing significantly different clinical outcomes of time to biochemical recurrence (BCR, left) or progression to metastatic disease (MET,right) for predicted FOXA1 mutant cases vs. wild-type in the GRID cohort. The difference of MET/BCR survival curves was tested via R survdiff function using G-rho family of tests, without adjustments for multiple comparisons. (c) Associations between predicted FOXA1 mutation status and clinical variables using univariate analysis of the GRID cohort, with FOXA1 wild type as reference. The GRID cohort included 1,626 radical prostatectomy (RP) tumor samples. The center values represent the median odds ratio via univariate analysis. The error bars represent first and third quartiles of odds ratio. The lines represent minimum and maximum odd ratio. Univariate logistic regression analyses were performed on the GRID cohort to test the statistical association between FOXA1 mutant status and clinical variables via generalized linear test, without adjustments for multiple comparisons. The test was two-sided with the significance level of p <0.05 as the cutoff.
Extended Data Figure 2. Details of FOXA1 luciferase reporter assay.
(a) Schematic of FOXA1 luciferase reporter, depicting the modified response elements (at wobble positions within the canonical FOXA1 motif) cloned in tandem upstream of a minimal promoter driving luciferase expression. (b) Dose response curve of FOXA1 luciferase reporter activity in response to increased amounts of Foxa11WT cDNA introduced into the system, expressed as a relative response ratio with 100% Foxa1WT cDNA set to 1 and 0% Foxa1WT cDNA (100% “stuffer” DNA) set to 0. Data from 3 biological replicates, central line and error bars represent mean +/− standard deviation. (c) Western blot of allelic series of FOXA1 mutants in HEK293T cells 24 hours after transfection with equal amounts of cDNA as used in FOXA1-luciferase reporter assay. CYCLO B = loading control Cyclophilin B. Representative blot, experiment repeated 3 independent times with similar results. For source gel data, see Supplementary Figure 1.
Extended Data Figure 3. Inducible overexpression of FOXA1 variants influences organoid lumen size and morphology.
(a) Schematic of dox-inducible pCW-FOXA1 constructs used in the study. (b) Western blot analysis of lysates from pCW-FOXA1WT organoids following acute dox treatment. Representative blot, experiment repeated 2 independent times with similar results. For source gel data, see Supplementary Figure 1. (c) Western blot analysis of lysates from organoids following long term dox treatment. Size of endogenous and FLAG-tagged FOXA1 noted, as well as the smaller truncated form from G275X at the expected size ~38kDa. Representative blot, experiment repeated 3 independent times with similar results. For source gel data, see Supplementary Figure 1. (d) Quantification of lumen areas measured at 10 days post-seeding. Solid black bar represents geometric mean, Values for sample size (indicated as dots) and p-values are as follows: EV (292), +WT (284, p<0.0001 over EV), +R219S (60, <0.0001), +F254_E255del (119, <0.0001), +D226N (120, <0.0001), +R261C (114, <0.0001), +R219C (333, 0.2915), +G275X (75, <0.0001), +M253_N256del (150, 0.2006), +M253K (63, 0.2343), +Y259S (32, 0.2045), +Y259C (45, 0.0082), +F266L (107, 0.1219), +H247Q (63, 0.8343), +H247R (180, <0.0001), +H247Y (71, 0.9104). All p-values are relative to WT unless noted, calculated using unpaired, two-tailed Student’s T-test. Colors represent location of mutation within FOXA1. (e) Histology and IHC of organoid lines overexpressing additional alleles of FOXA1 (+WT or +Mut) via the doxycycline-inducible pCW vector 10 days after seeding. Images from a single biological experiment.
Extended Data Figure 4. Analysis of FOXA1 alterations in FOXA1-deleted or PTEN-deleted contexts.
(a) CRISPR/Cas9 mediated knockdown of FOXA1 results in a significantly altered morphology. Organoids lacking FOXA1 (sgFOXA1) have a reduced capacity to form lumens while maintaining expression of AR and the basal marker p63 sgNT (guide RNA targeting human gene AAVS1) serves as a negative control. (b) Western blot analysis of lysates from organoids carrying control guide RNA (sgNT) or guide RNA targeting FOXA1. Representative blot, experiment repeated 3 times with similar results. For source gel data, see Supplementary Figure 1. (c) Quantification of organoids containing lumens, 7 days after trypsinization in normal organoid media. Data from 3 biological replicates, bars represent mean +/− standard deviation, p-value calculated using unpaired, two-tailed Student’s T-test. (d) Sequence indicating the location of 3 silent point mutations introduced upstream of the PAM sequence for Foxa1 targeting RNA sgFoxa1_1. (e) Western blot analysis of lysates from organoids carrying either CRISPR-Zeo-sgGFP or sgFoxa1_1 in addition to the pCW construct indicated, either EV or with a FOXA1 allele present, plus or minus dox treatment for 10 days. Representative blot, experiment repeated 2 times with similar results. For source gel data, see Supplementary Figure 1. (f) Images of organoid lines carrying various combinations of guide RNA and cDNAs, 10 days after dox treatment. (g) Quantification of lumen containing organoids in lines with endogenous Foxa1 deleted via CRISPR/Cas9 (sgFoxa1, sgNT as control guide) and overexpression of CRIPSR-resistant Foxa1 WT or mutant cDNA 10 days after seeding. Data from 2 biological replicates, bars represent mean. (h) Western blot analysis of lysates from PTEN-deficient organoids grafted into mice, with dox-induced overexpression of appropriate FOXA1 mutants. Representative blot, experiment repeated 2 times with similar results. For source gel data, see Supplementary Figure 1. (i) Overexpression of FOXA1WT or FOXA1G275X in sgPTEN organoids promotes tumor growth in mice at 6-weeks post engraftment into the flank of NOD-Scid Gamma mice. Data from the following number of tumors: EV=8, +WT=8, +R219S=10, +F254_E255del=10, +G275X=9, +ERG=10. Error bars represent mean +/− standard deviation, p-values calculated using unpaired, two-tailed Student’s T-test vs EV. Colors represent location of mutation within FOXA1. (j) Representative histology and immunohistochemistry (IHC) of a single tumor for given PTEN-deficient, FOXA1 expressing lines. Histology and IHC done on 5–9 tumors per line, from a single in vivo experiment, with similar results.
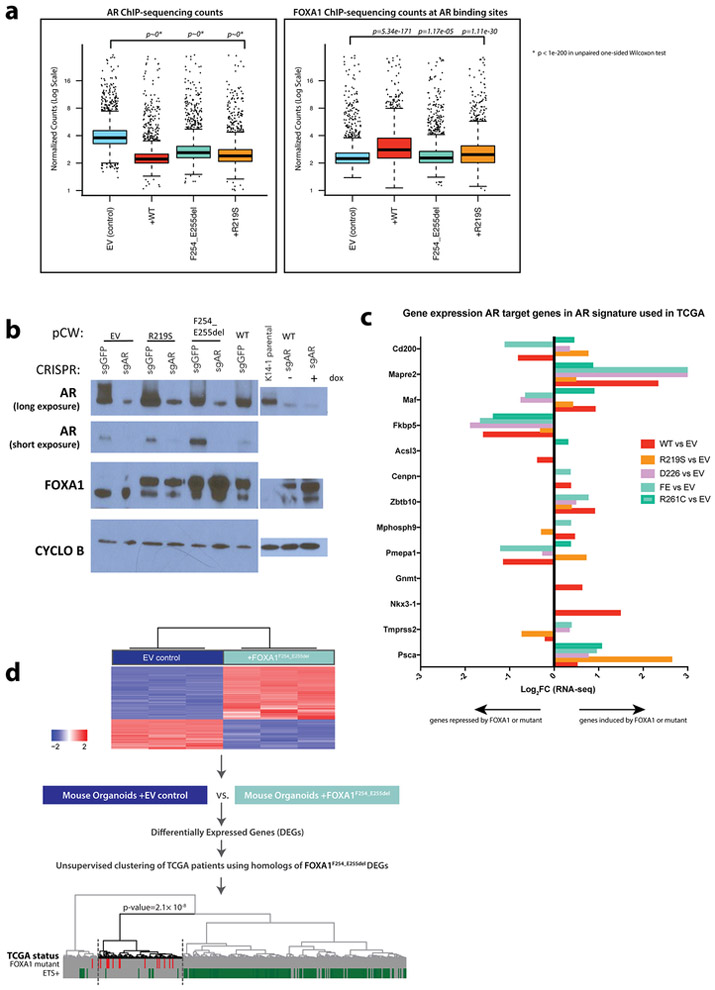
Extended Data Figure 5. Analysis of the interplay between AR and FOXA1 in mouse organoids expressing FOXA1 variants.
(a) Box-plot representations of normalized counts from AR (left) and FOXA1 ChIP-seq (right) shown in Figure 3a to quantify the reduction in AR binding following FOXA1 wild-type or mutant overexpression, and the increase in FOXA1 wild-type binding at those sites where AR is lost. Box: 25th to 75th percentile, band: median, top whisker: 75th percentile plus 1.5 times interquartile range, bottom whisker: 25th percentile minus 1.5 times interquartile range. Sample size = 2914 peaks. . p-values calculated using an unpaired, one-sided Wilcoxon test. (b) Western blot analysis of lysates from AR-deficient organoids generated using CRISPR-Cas9 carrying representative FOXA1 alleles. Levels are significantly reduced but AR is not completely absent (as seen on the long exposure) given that this is a bulk population rather than single cell clones thus a small number of cells escaped CRISPR/Cas9 mediated Ar deletion. Cells were treated with dox for at least 10 days. Representative blot, experiment repeated 2 times with similar results. For source gel data, see Supplementary Figure 1. (c) Expression of mouse orthologs of AR target genes found in AR signature used in TCGA cohort analysis based on mouse organoid RNA-sequencing analysis. Genes depicted are those that have a mouse ortholog of the human gene found in the signature, and a significant expression change (DESeq2 adjusted p-value < 0.05) compared to EV control at 11 days +dox, as well as Psca, an AR target gene expressed in mouse organoids. Data from RNA-sequencing of 3 biological replicates. (d) FOXA1F254_E255del signature can predict mutant tumors in TCGA. Hierarchical clustering and heat map of significantly differentially expressed genes between mouse FOXA1F254_255 organoids and EV control (FDR<=1×10⁻¹⁰). Human homologs of differentially expressed genes (DEGs) from this analysis were used to cluster FOXA1 mutant (n=14) and can detect nearly all FOXA1 mutant human tumors (p=2.1×10⁻⁸) out of the 333 TCGA samples, 199 of which are ETS+. Two-sided Fisher-exact test was used to test the enrichment of FOXA1 mutant samples within in sub-cluster, without adjustments for multiple comparisons.
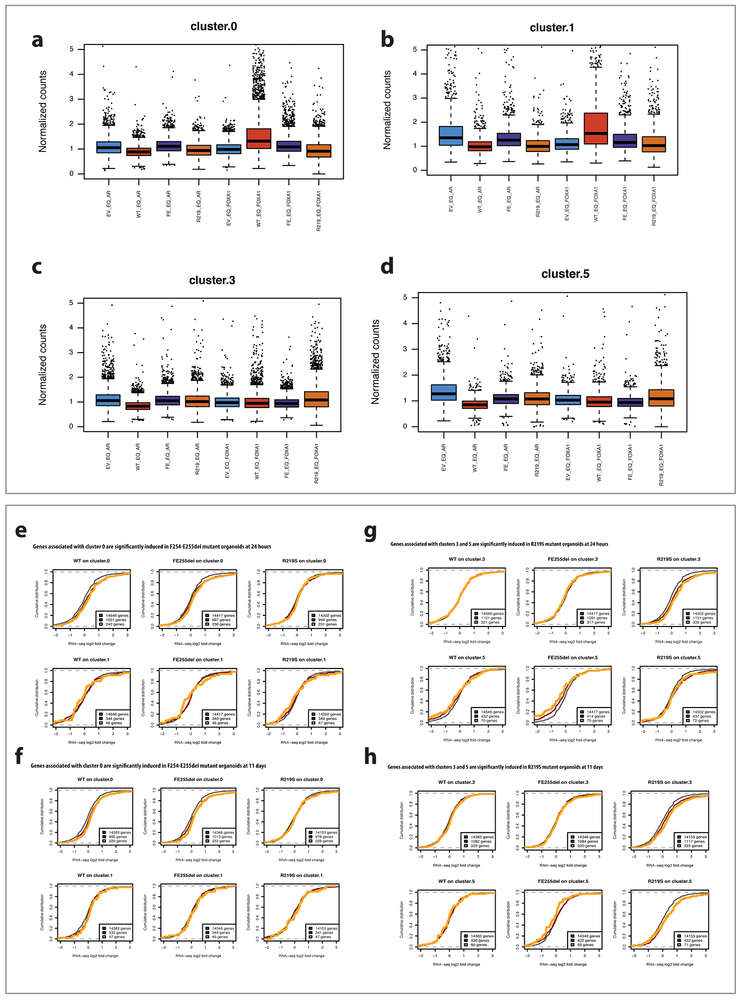
Extended Data Figure 6. Integrated analysis of ChIP-seq, ATAC-seq, and RNA-seq data in FOXA1 mutant organoid lines.
(a) Cluster 0 peaks have higher FOXA1 ChIP-seq signal in F254_E255del mutant organoid than empty vector control. Box plots show normalized day 5 AR ChIP-seq signal and FOXA1 ChIP-seq signal across different organoid lines at peaks from cluster 0, where normalization is based on background ChIP signal. FOXA1 ChIP signal is significantly higher in F254_E255del and in WT compared to EV control (all P values can be found in Supplementary Table 11). Sample size = 5260 peaks. (b) Cluster 1 peaks have higher FOXA1 ChIP-seq signal and lower AR ChIP-seq signal in WT FOXA1 overexpressing organoid than empty vector control. Box plots show normalized day 5 AR ChIP-seq signal and FOXA1 ChIP-seq signal across different organoid lines at peaks from cluster 1, where normalization is based on background ChIP signal. FOXA1 ChIP signal is significantly higher, and AR ChIP signal significantly lower, in WT compared to EV control. Sample size = 1493 peaks. (c) Cluster 3 peaks have higher FOXA1 ChIP-seq signal in R219S organoid than empty vector control. Box plots show normalized day 5 AR ChIP-seq signal and FOXA1 ChIP-seq signal across different organoid lines at peaks from cluster 3, where normalization is based on background ChIP signal. FOXA1 ChIP signal is significantly higher in R219S compared to EV control. Sample size = 6641 peaks. (d) Cluster 5 peaks have higher FOXA1 ChIP-seq signal and lower AR ChIP-seq signal in R219S organoid than empty vector control. Box plots show normalized day 5 AR ChIP-seq signal and FOXA1 ChIP-seq signal across different organoid lines at peaks from cluster 5, where normalization is based on background ChIP signal. FOXA1 ChIP signal is significantly higher, and AR ChIP signal significantly lower, in R219S compared to EV control. Sample size = 1983 peaks. For panels a-d, box: 25th to 75th percentile, band: median, top whisker: 75th percentile plus 1.5 times interquartile range, bottom whisker: 25th percentile minus 1.5 times interquartile range. p-values calculated using an unpaired, one-sided Wilcoxon test. (e) Genes associated with cluster 0 are significantly induced in F254_E255del mutant organoids. Top row: Plots show empirical cumulative distribution of log2 expression changes at 24hrs vs. day 0 in WT (left), F254_E255del mutant (middle) and R219S mutant (right) organoids for all expressed genes (black), genes associated with at least one ATAC-seq peak in cluster 0 (‘cluster 0-associated genes’, red), and the top quartile of these genes based on number of assigned cluster 0 peaks (‘strong cluster 0-associated genes’, yellow). Cluster 0-associated genes show strong expression induction compared to all genes in F254_E255del as well as in WT (red vs. black) but not in R219. Bottom row: As a control, similar cumulative log2 expression changes for cluster 1-associated genes (red) or strong cluster 1-associated genes (yellow) do not show significant induction in F254_E255del. All P-values are listed in Supplementary Table 12 and are one-sided Wilcoxon rank sum tests. (f) Genes associated with cluster 0 are significantly induced in F254-E255del mutant organoids. Top row: Plots show empirical cumulative distribution of log2 expression changes at 11 days vs. day 0 in WT (left), F254_E255del mutant (middle) and R219S mutant (right) organoids for all expressed genes (black), genes associated with at least one ATAC-seq peak in cluster 0 (‘cluster 0-associated genes’, red), and the top quartile of these genes based on number of assigned cluster 0 peaks (‘strong cluster 0-associated genes’, yellow). Cluster 0-associated genes show strong expression induction compared to all genes in F254_E255del as well as in WT but not in R219. Bottom row: As a control, similar cumulative log2 expression changes for cluster 1-associated genes (red) or strong cluster 1-associated genes (yellow) do not show significant induction in F254_E255del. All P-values are listed in Supplementary Table 12 and are one-sided Wilcoxon rank sum tests. (g) Genes associated with clusters 3 and 5 are significantly induced in R219S mutant organoid. Top row: Plots show empirical cumulative distribution of log2 expression changes at 24hrs vs. day 0 in WT (left), F254_E255del mutant (middle) and R219S mutant (right) organoids for all expressed genes (black), genes associated with at least one ATAC-seq peak in cluster 3 (‘cluster 3-associated genes’, red), and the top quartile of these genes based on number of assigned cluster 0 peaks (‘strong cluster 3-associated genes’, yellow). Cluster 3-associated genes show strong expression induction compared to all genes in R219S but not in WT or F255del. Bottom row: Similar analysis for cumulative log2 expression changes for cluster 5-associated genes (red) and strong cluster 5-associated genes (yellow). These genes are significantly induced in R219S and repressed in F254_E255del in WT for this time point. All P-values are listed in Supplementary Table 12 and are one-sided Wilcoxon rank sum tests. (h) Genes associated with clusters 3 and 5 are significantly induced in R219S mutant organoid. Top row: Plots show empirical cumulative distribution of log2 expression changes at day 11 vs. day 0 in WT (left), F254_E255del mutant (middle) and R219S mutant (right) organoids for all expressed genes (black), genes associated with at least one ATAC-seq peak in cluster 3 (‘cluster 3-associated genes’, red), and the top quartile of these genes based on number of assigned cluster 0 peaks (‘strong cluster 3-associated genes’, yellow). Cluster 3-associated genes show strong expression induction compared to all genes in R219S but not in WT or F255del. Bottom row: Similar analysis for cumulative log2 expression changes for cluster 5-associated genes (red) and strong cluster 5-associated genes (yellow). These genes are significantly induced in R219S and repressed in F254_E255del. All P-values are listed in Supplementary Table 12 and are one-sided Wilcoxon rank sum tests.
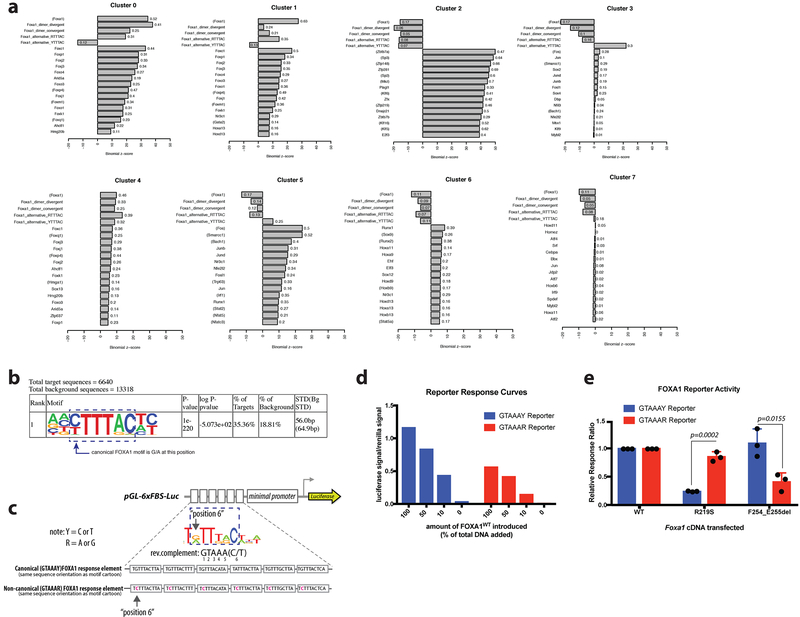
Extended Data Figure 7. Motif analysis of ATAC-sequencing and modification of FOXA1 reporter assay for evaluation of non-canonical FOXA1 motif.
(a) FIMO motif analysis of ATAC-seq clusters. Summary of motif enrichments/depletion results for each cluster relative to the background of all differentially accessible peaks, as reported by binomial Z-score. The top 15 enriched database motifs for expressed transcription factors are shown for each cluster. In addition, enrichment/depletion results for four additional FOXA1-related motifs are shown: convergent and divergent dimer motifs, and altered FOXA1 core binding motifs with either G/A or C/T at position 6. Transcription factors in parentheses represent motifs inferred from other species. Complete lists can be found in Supplementary Tables 3-10. (b) Top motif identified de novo using HOMER on ATAC-seq cluster 3 (R219S-specific) with motif core indicated, and variation from canonical FOXA1 motif depicted. p-values derived from one-sided binomial test. (c) Schematic of reporter design. Canonical response element reporter is same reporter used in Fig. 2, with various iterations of the canonical FOXA1 motif in tandem. Non-canonical motif has substitutions at position 6, indicated in pink, to reflect the newly identified motif enriched in cluster 3 of ATAC-seq. Note: the orientation of the upper motif cartoon and the sequence in the reporter schematic are the reverse complement of the motif identified by HOMER (GTAAAR). Modified base noted in position 6. (d) Dose response curve for both FOXA1 luciferase reporters’ activity in response to increased amounts of Foxa1WT cDNA introduced into the system. Data shown is one representative biological replicate of 3 carried out, all showing same trends, but absolute luciferase/renilla ratios vary from experiment to experiment. (e) Results of reporter assays expressed as a relative response ratio, normalized to level of FOXA1WT activity for a given reporter. Data from 3 biological replicates, bars indicate mean +/− standard deviation. p-values derived using unpaired, two-tailed Student’s T-test.
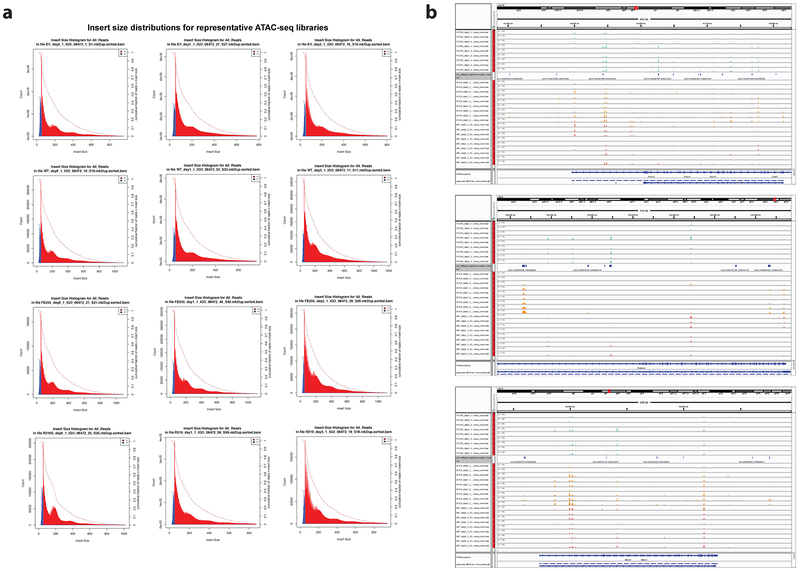
Extended Data Figure 8. Insert size distributions for ATAC-seq experiments and track figures demonstrating peak reproducibility across ATAC-seq replicates.
(a) Representative insert size distributions computed from individual ATAC-seq experiments based on aligned read pairs, showing modes corresponding to nucleosome-free regions, mono-nucleosomal fragments, and di-nucleosomal fragments. (b) Signal tracks for individual replicate ATAC-seq experiments at the Runx2, Plekha5, and Mbnl1 loci show reproducibility of accessibility events. DEseq scaling factors estimated from the atlas of IDR-reproducible peaks were used for library size normalization.
Extended Data Figure 9. ATAC-seq peak annotation distributions.
Fraction of peaks annotated as promoter, intergenic, intronic, and exonic for full atlas of reproducible peaks, differentially accessible peaks, and by ATAC-seq cluster. See Supplementary Table 15 for full annotation counts.
Extended Data Figure 10. MA plots for differential accessibility analysis.
(a) MA plots for differential accessibility analysis relative to EV controls. Representative MA plots (logFC vs mean read counts) for differential peak accessibility analysis of mutant and WT expressing organoid lines vs. empty vector controls at day 0, day 1, and day 5. Peaks that are significantly differential at FDR-corrected P < 0.05 are shown in color. Dotted lines at logFC = 2 and logFC = −2 show cut-offs used for requiring robust accessibility changes in pairwise comparisons. (b) MA plots for differential accessibility analysis at different time point relative to day 0. Representative MA plots (logFC vs mean read counts) for differential peak accessibility analysis in each organoid line at day 1 vs. day 0 and day 5 vs. day 0. For a-b, all sample size n=183093 (number of peaks in the atlas). Peaks that are significantly differential at FDR-corrected P < 0.05 are shown in color, using two-sided Wald test with Benjamini-Hochberg correction.
Supplementary Material
Acknowledgments
We thank P. Iaquinta, B. Carver, Z. Cao, I. Ostrovnaya, H. Hieronymous, W. Abida, E. Wasmuth, K. Lawrence, T. Nadkarni, S. P. Gao, and all members of the Sawyers laboratory for comments, Memorial Sloan Kettering Cancer Center core facilities, especially Ning Fan and Dmitry Yarilin from the MSKCC Molecular Cytology Core Facility, and the MSKCC Integrated Genomics Operation. We also thank the New York Genome Center for conducting the RNA-sequencing, and R. Jeffrey Karnes MD (Department of Urology, Mayo Clinic), Robert B. Den MD, (Department of Radiation Oncology, Thomas Jefferson University), Eric A. Klein MD, (Glickman Urological and Kidney Institute, Cleveland Clinic), and Bruce Trock PhD, (Department of Urology, Johns Hopkins University) for providing access to patient outcome data. Some of the results shown here are in part based upon data generated by the TCGA Research Network: https://www.cancer.gov/tcga. E.J.A was supported by an American Association for Cancer Research Basic Cancer Research Fellowship, the MSKCC Translational Research Oncology Training Program, and the MSKCC Functional Genomics Initiative. R.D. was supported by NIH training grant 1T32GM083937. Z.Z. is supported by the NCI Predoctoral to Postdoctoral Fellow Transition Award (F99/K00 award ID: F99CA223063). R.B. was supported by grants from Department of Defense (W81XWH1510277), NCI (1K08CA226348–01), and the Prostate Cancer Foundation. D.L., A.S. and C.E.B were supported by: the NCI (K08CA187417–01, C.E.B., R01CA215040–01, C.E.B., P50CA211024–01, C.E.B.), a Urology Care Foundation Rising Star in Urology Research Award (C.E.B.), Damon Runyon Cancer Research Foundation MetLife Foundation Family Clinical Investigator Award (C.E.B.), and the Prostate Cancer Foundation (C.E.B). C.L.S. is an investigator of the HHMI and this project was supported by National Institutes of Health grants CA155169, CA193837, CA224079, CA092629, CA160001, CA008748 and the Starr Cancer Consortium grant I10–0062.
Footnotes
Data Availability
The described RNA-seq, ATAC-seq and ChIP–seq data have been deposited in the Gene Expression Omnibus under the following accession numbers: GSE128667 (all data), GSE128421 (ATAC-seq sub-series), GSE128666 (RNA-seq sub-series), GSE128867 (ChIP-seq sub-series). Source data for tumor microarrays previously published are as follows: GSE79957, GSE72291, GSE62667, GSE62116, GSE46691, GSE41408, and GSE21032. Patient predicted FOXA1 mutant status and outcome data from Decipher GRID are available from the authors upon reasonable request.
Main Text References
- 1.Pomerantz MM et al. The androgen receptor cistrome is extensively reprogrammed in human prostate tumorigenesis. Nat Genet 47, 1346–1351, doi: 10.1038/ng.3419 (2015). [DOI] [PMC free article] [PubMed] [Google Scholar]
- 2.Grasso CS et al. The mutational landscape of lethal castration-resistant prostate cancer. Nature 487, 239–243, doi: 10.1038/nature11125 (2012). [DOI] [PMC free article] [PubMed] [Google Scholar]
- 3.Gerhardt J et al. FOXA1 promotes tumor progression in prostate cancer and represents a novel hallmark of castration-resistant prostate cancer. Am J Pathol 180, 848–861, doi: 10.1016/j.ajpath.2011.10.021 (2012). [DOI] [PubMed] [Google Scholar]
- 4.Jin HJ, Zhao JC, Ogden I, Bergan RC & Yu J Androgen receptor-independent function of FoxA1 in prostate cancer metastasis. Cancer Res 73, 3725–3736, doi: 10.1158/0008-5472.CAN-12-3468 (2013). [DOI] [PMC free article] [PubMed] [Google Scholar]
- 5.Barbieri CE et al. Exome sequencing identifies recurrent SPOP, FOXA1 and MED12 mutations in prostate cancer. Nat Genet 44, 685–689, doi: 10.1038/ng.2279 (2012). [DOI] [PMC free article] [PubMed] [Google Scholar]
- 6.Cancer Genome Atlas Research, N. The Molecular Taxonomy of Primary Prostate Cancer. Cell 163, 1011–1025, doi: 10.1016/j.cell.2015.10.025 (2015). [DOI] [PMC free article] [PubMed] [Google Scholar]
- 7.Robinson D et al. Integrative clinical genomics of advanced prostate cancer. Cell 161, 1215–1228, doi: 10.1016/j.cell.2015.05.001 (2015). [DOI] [PMC free article] [PubMed] [Google Scholar]
- 8.Annala M et al. Frequent mutation of the FOXA1 untranslated region in prostate cancer. Communications Biology 1, 122, doi: 10.1038/s42003-018-0128-1 (2018). [DOI] [PMC free article] [PubMed] [Google Scholar]
- 9.Wedge DC et al. Sequencing of prostate cancers identifies new cancer genes, routes of progression and drug targets. Nat Genet 50, 682–692, doi: 10.1038/s41588-018-0086-z (2018). [DOI] [PMC free article] [PubMed] [Google Scholar]
- 10.Ciriello G et al. Comprehensive Molecular Portraits of Invasive Lobular Breast Cancer. Cell 163, 506–519, doi: 10.1016/j.cell.2015.09.033 (2015). [DOI] [PMC free article] [PubMed] [Google Scholar]
- 11.Abida W et al. Prospective Genomic Profiling of Prostate Cancer Across Disease States Reveals Germline and Somatic Alterations That May Affect Clinical Decision Making. JCO Precis Oncol 2017, doi: 10.1200/PO.17.00029 (2017). [DOI] [PMC free article] [PubMed] [Google Scholar]
- 12.Beltran H et al. Divergent clonal evolution of castration-resistant neuroendocrine prostate cancer. Nat Med 22, 298–305, doi: 10.1038/nm.4045 (2016). [DOI] [PMC free article] [PubMed] [Google Scholar]
- 13.Liu D et al. Impact of the SPOP Mutant Subtype on the Interpretation of Clinical Parameters in Prostate Cancer. JCO Precision Oncology 2, 1–13, doi: 10.1200/PO.18.00036 (2018). [DOI] [PMC free article] [PubMed] [Google Scholar]
- 14.Armenia J et al. The long tail of oncogenic drivers in prostate cancer. Nat Genet 50, 645–651, doi: 10.1038/s41588-018-0078-z (2018). [DOI] [PMC free article] [PubMed] [Google Scholar]
- 15.Karthaus WR et al. Identification of multipotent luminal progenitor cells in human prostate organoid cultures. Cell 159, 163–175, doi: 10.1016/j.cell.2014.08.017 (2014). [DOI] [PMC free article] [PubMed] [Google Scholar]
- 16.Gao N et al. Forkhead box A1 regulates prostate ductal morphogenesis and promotes epithelial cell maturation. Development 132, 3431–3443, doi: 10.1242/dev.01917 (2005). [DOI] [PubMed] [Google Scholar]
- 17.Bose R et al. ERF mutations reveal a balance of ETS factors controlling prostate oncogenesis. Nature 546, 671–675, doi: 10.1038/nature22820 (2017). [DOI] [PMC free article] [PubMed] [Google Scholar]
- 18.King JC et al. Cooperativity of TMPRSS2-ERG with PI3-kinase pathway activation in prostate oncogenesis. Nature genetics 41, 524–526, doi: 10.1038/ng.371 (2009). [DOI] [PMC free article] [PubMed] [Google Scholar]
- 19.Blattner M et al. SPOP Mutation Drives Prostate Tumorigenesis In Vivo through Coordinate Regulation of PI3K/mTOR and AR Signaling. Cancer Cell 31, 436–451, doi: 10.1016/j.ccell.2017.02.004 (2017). [DOI] [PMC free article] [PubMed] [Google Scholar]
- 20.Hieronymus H et al. Gene expression signature-based chemical genomic prediction identifies a novel class of HSP90 pathway modulators. Cancer Cell 10, 321–330, doi: 10.1016/j.ccr.2006.09.005 (2006). [DOI] [PubMed] [Google Scholar]
- 21.Wang X et al. DNA-mediated dimerization on a compact sequence signature controls enhancer engagement and regulation by FOXA1. Nucleic acids research 46, 5470–5486, doi: 10.1093/nar/gky259 (2018). [DOI] [PMC free article] [PubMed] [Google Scholar]
Methods References
- 22.Gao J et al. Integrative Analysis of Complex Cancer Genomics and Clinical Profiles Using the cBioPortal. Science Signaling 6, pl1, doi: 10.1126/scisignal.2004088 (2013). [DOI] [PMC free article] [PubMed] [Google Scholar]
- 23.Cerami E et al. The cBio Cancer Genomics Portal: An Open Platform for Exploring Multidimensional Cancer Genomics Data. Cancer Discovery 2, 401, doi: 10.1158/2159-8290.CD-12-0095 (2012). [DOI] [PMC free article] [PubMed] [Google Scholar]
- 24.Watson PA et al. Constitutively active androgen receptor splice variants expressed in castration-resistant prostate cancer require full-length androgen receptor. Proceedings of the National Academy of Sciences 107, 16759 (2010). [DOI] [PMC free article] [PubMed] [Google Scholar]
- 25.Wang T, Wei JJ, Sabatini DM & Lander ES Genetic Screens in Human Cells Using the CRISPR-Cas9 System. Science 343, 80 (2014). [DOI] [PMC free article] [PubMed] [Google Scholar]
- 26.Motallebipour M et al. Differential binding and co-binding pattern of FOXA1 and FOXA3 and their relation to H3K4me3 in HepG2 cells revealed by ChIP-seq. Genome Biology 10, R129, doi: 10.1186/gb-2009-10-11-r129 (2009). [DOI] [PMC free article] [PubMed] [Google Scholar]
- 27.Peng W, Bao Y & Sawicki JA Epithelial cell-targeted transgene expression enables isolation of cyan fluorescent protein (CFP)-expressing prostate stem/progenitor cells. Transgenic Res 20, 1073–1086, doi: 10.1007/s11248-010-9478-2 (2011). [DOI] [PMC free article] [PubMed] [Google Scholar]
- 28.Vaezi A, Bauer C, Vasioukhin V & Fuchs E Actin Cable Dynamics and Rho/Rock Orchestrate a Polarized Cytoskeletal Architecture in the Early Steps of Assembling a Stratified Epithelium. Developmental Cell 3, 367–381, doi: 10.1016/S1534-5807(02)00259-9 (2002). [DOI] [PubMed] [Google Scholar]
- 29.Koo B-K et al. Controlled gene expression in primary Lgr5 organoid cultures. Nature Methods 9, 81, doi: 10.1038/nmeth.1802 https://www.nature.com/articles/nmeth.1802-supplementary-information (2011). [DOI] [PubMed] [Google Scholar]
- 30.Dobin A et al. STAR: ultrafast universal RNA-seq aligner. Bioinformatics 29, 15–21, doi: 10.1093/bioinformatics/bts635 (2013). [DOI] [PMC free article] [PubMed] [Google Scholar]
- 31.Wang L, Wang S & Li W RSeQC: quality control of RNA-seq experiments. Bioinformatics 28, 2184–2185, doi: 10.1093/bioinformatics/bts356 (2012). [DOI] [PubMed] [Google Scholar]
- 32.Smith BA et al. A basal stem cell signature identifies aggressive prostate cancer phenotypes. Proceedings of the National Academy of Sciences 112, E6544 (2015). [DOI] [PMC free article] [PubMed] [Google Scholar]
- 33.Klein EA et al. A Genomic Classifier Improves Prediction of Metastatic Disease Within 5 Years After Surgery in Node-negative High-risk Prostate Cancer Patients Managed by Radical Prostatectomy Without Adjuvant Therapy. European Urology 67, 778–786, doi: 10.1016/j.eururo.2014.10.036 (2015). [DOI] [PubMed] [Google Scholar]
- 34.Boormans Joost L et al. Identification of TDRD1 as a direct target gene of ERG in primary prostate cancer. International Journal of Cancer 133, 335–345, doi: 10.1002/ijc.28025 (2013). [DOI] [PubMed] [Google Scholar]
- 35.Ross AE et al. Tissue-based Genomics Augments Post-prostatectomy Risk Stratification in a Natural History Cohort of Intermediate- and High-Risk Men. European Urology 69, 157–165, doi: 10.1016/j.eururo.2015.05.042 (2016). [DOI] [PubMed] [Google Scholar]
- 36.Taylor BS et al. Integrative genomic profiling of human prostate cancer. Cancer Cell 18, 11–22, doi: 10.1016/j.ccr.2010.05.026 (2010). [DOI] [PMC free article] [PubMed] [Google Scholar]
- 37.Erho N et al. Discovery and Validation of a Prostate Cancer Genomic Classifier that Predicts Early Metastasis Following Radical Prostatectomy. PLOS ONE 8, e66855, doi: 10.1371/journal.pone.0066855 (2013). [DOI] [PMC free article] [PubMed] [Google Scholar]
- 38.Karnes RJ et al. Validation of a Genomic Classifier that Predicts Metastasis Following Radical Prostatectomy in an At Risk Patient Population. The Journal of Urology 190, 2047–2053, doi: 10.1016/j.juro.2013.06.017 (2013). [DOI] [PMC free article] [PubMed] [Google Scholar]
- 39.Den RB et al. Genomic Prostate Cancer Classifier Predicts Biochemical Failure and Metastases in Patients After Postoperative Radiation Therapy. International Journal of Radiation Oncology*Biology*Physics 89, 1038–1046, doi: 10.1016/j.ijrobp.2014.04.052 (2014). [DOI] [PMC free article] [PubMed] [Google Scholar]
- 40.Weirauch Matthew T. et al. Determination and Inference of Eukaryotic Transcription Factor Sequence Specificity. Cell 158, 1431–1443, doi: 10.1016/j.cell.2014.08.009 (2014). [DOI] [PMC free article] [PubMed] [Google Scholar]
- 41.Grant CE, Bailey TL & Noble WS FIMO: scanning for occurrences of a given motif. Bioinformatics 27, 1017–1018, doi: 10.1093/bioinformatics/btr064 (2011). [DOI] [PMC free article] [PubMed] [Google Scholar]
- 42.Bailey TL et al. MEME SUITE: tools for motif discovery and searching. Nucleic acids research 37, W202–W208, doi: 10.1093/nar/gkp335 (2009). [DOI] [PMC free article] [PubMed] [Google Scholar]
- 43.Bolger AM, Lohse M & Usadel B Trimmomatic: a flexible trimmer for Illumina sequence data. Bioinformatics 30, 2114–2120, doi: 10.1093/bioinformatics/btu170 (2014). [DOI] [PMC free article] [PubMed] [Google Scholar]
- 44.Langmead B & Salzberg SL Fast gapped-read alignment with Bowtie 2. Nature Methods 9, 357, doi: 10.1038/nmeth.1923 https://www.nature.com/articles/nmeth.1923-supplementary-information (2012). [DOI] [PMC free article] [PubMed] [Google Scholar]
- 45.Feng J, Liu T, Qin B, Zhang Y & Liu XS Identifying ChIP-seq enrichment using MACS. Nature Protocols 7, 1728, doi: 10.1038/nprot.2012.101 (2012). [DOI] [PMC free article] [PubMed] [Google Scholar]
- 46.Li Q, Brown JB, Huang H & Bickel PJ Measuring reproducibility of high-throughput experiments. Ann. Appl. Stat. 5, 1752–1779, doi: 10.1214/11-AOAS466 (2011). [DOI] [Google Scholar]
Associated Data
This section collects any data citations, data availability statements, or supplementary materials included in this article.


