

Abstract
Background: A swarm of pelagic tunicate (Pyrosoma spinosum) was found in the surface open waters of the Arabian Sea during late southwest monsoon (September 2007). The swarm site was characterized by moderate southwesterly wind (approximately 7 m s−1), relatively low sea-surface temperature (approximately 26°C), shallow mixed layer (approximately 50 m), and substantial macro-nutrient concentrations (surface values: 2.5 μM nitrate, 0.3 μM phosphate, 0.9 μM silicate, and 5.0 μM ammonium). Despite adequate macronutrient availability, the swarm site was characterized by low diversity of phytoplankton (>5 μm) and mesozooplankton in the upper 200 m. Low chlorophyll a concentration (27.3 mg/m2 in the upper 120 m) at the swarm site was dominated (90% to 95% in the upper 40 m) by the Synechococcus (20 × 106 /ml).
Results: Silicate deficiency in surface waters upwelled or entrained from the thermocline may be a key factor for the dominance of smaller autotrophs (flagellates and cyanobacteria) that seems to offer favorable conditions for episodic occurrence of swarms of these filter feeders. Low carbon content (37% of total dry weight) and the lower molar(carbon-to-nitrogen) ratio (5) in P.spinosum suggestgrowth of these organisms is carbon-limited.
Conclusions:Wedescribe various physicochemical and biological conditions at the P.spinosum swarmlocation and at two other nearby sites not affected by it. The biological factors predominantly high densities of Synechococcus and flagellates were best suited conditions for the proliferation of pyrosome biomass in the central Arabian Sea.
Keywords: Pyrosoma spinosum, Arabian Sea, Biogeochemistry, Phytoplankton, Zooplankton
BACKGROUND
Pyrosoma is a genus of warm-water protochordates consisting of a large number of small individual organ- isms (called zooids), which remain together in the formof a drifting colony. These colonies range in size from microscopic to >10 m long (Griffin and Yaldwyn 1970). Interestingly, each zooid of the colony remains inde- pendent of others. Each zooid feeds by passing a current, containing particles and organisms, through a mucus- covered branchial basket that retains particles including bacteria. Picophytoplanktons, which contribute signifi- cantly to the global primary production, are abundantly found in the Arabian Sea even during the southwest mon- soon period (Brown et al. 1999). Analysis of gut contents of Pyrosoma (Hart, as cited by Culkin and Morris 1970) showed that the main food (80%) was phytoplankton be- longing to the classes Haptophyceae, Chrysophyceae, and Bacillariophyceae. The remainder was composed of proto- zoan species such as radiolarians and tintinnids.
Geographically, pyrosome forms are found distributed worldwide, commonly in the warm tropical and temper- ate waters, particularly between 50°N and 50°S (Sewell 1953, Van Soest 1981) but not in polar waters. In the water column, they occur at the surface as well as in the dark region of the deep sea. They have been collected from depths well in excess of 3,000 m (Millar 1971).
The trophodynamic role of other pelagic tunicates such assalps, doliolids, and appendicularians in the pelagic eco- system is known to some extent (see Harbison and Gilmer 1976, Wiebe et al. 1979, Alldredge 1981, Deibel 1982, 1986, 1988, Madin 1982, Madin and Cetta 1984, Naqvi et al. 2002). In comparison, much less is known about pyrosomes even though early work on these tunicates dates back to early nineteenth century (Peron 1804). The pyrosomes as pelagic zooplankton are of special interest in the trophodynamics of planktonic ecosystems as they oc- casionally rival crustaceans as the dominant planktonic herbivores (Thompson 1948, Bary 1960). The presence of these forms considerably increases the standing crop of secondary producers (Angel 1989). That study also points out that pyrosomes undertake extensive vertical migration going down to 500 to 700 m or even deeper during the day and ascending into the mixed layer at night. The vertical movement of these organisms highlights the importance of biological factors influencing the fluxes of material (Roe et al. 1987), similar to myctophids (Morrison et al. 1999) and copepods (Wishner et al. 2008, Takahashi et al. 2009).
The only mention of P. spinosum (apart from P. verticilla- tum, P. aberniosum, and P. atlanticum) comes from the southern part of the Arabian Sea (off the Arabian coast and in the Gulf of Aden) during the John Murray Expedition (1933 to 1934) (Sewell 1953) and from the work of Neumann (1913) from the equatorial zone (8°N to 10°S). During the IIOE (1960 to 1965), pyrosomes were found re- stricted to the south of 10°N (see Indian Ocean Biological Centre 1973). However, occurrence of massive pyrosome colonies is at least not known in the northern Arabian Sea. This article records their occurrence in the region based on observations made in the summer of 2007. The possible reason and significance are examined in the present study.
METHODS
The climate and oceanographic processes of the Arabian Sea, our study area, is very different from the other ocean basins as a result of its uncommon geographical setting. This region experiences seasonally reversing monsoon winds. The winds blow from the northeast in winter (November to February; northeast monsoon) and from the southwest in summer (June to September; southwest monsoon). The southwest monsoon is the most important period for the region because the strong south- westerly wind forces vigorous upwelling off Somalia, Yemen, and Oman in the western Arabian Sea are result- ing in large-scale nutrient enrichment of the euphotic zone that extends about 1,000 km offshore. The present study was carried out to the end of the southwest mon- soon in 2007.
Sampling
During the middle of the day, a pyrosome swarm was observed during a cruise of R/V Roger Revelle cruise at station 20 (lat. 15° 58′N;long. 62° 00′E; Figure 1) on 10 September 2007. The pyrosome colonies appeared to be long, pinkish-red colored, worm-like floating objects due to water motion. Specimens were collected without causing much damage with a large capacity (20 L) wide- mouth plastic bucket. The longest colony was roughly 0.8 m long and 16 cm wide; since it was cut and open on one side, the actual length must have been even lon- ger. A much longer colony (approximately 2 m) was re- covered at night entangled to the CTD rosette (cast to 120 m; see Additional file 1). Tubular colonies were cut open to measure the length and width.
Fig. 1.

Figure 1 Map showing SeaWiFS Chl a image. For August to September 2007 (source:http://gdata1.sci.gsfc.nasa.gov/daac-bin/G3/gui.cgi? instance_id=ocean_month) with superimposed station locations [station 20: pyrosome swarm station; stations 17and 23: stations for comparison].
To explore the ecological and biogeochemical signifi- cance of pyrosome swarm, we collected physicochemical and biological data from the swarm station as wellas from two other nearby stations that were occupied on 9 September 2007 (station 17: lat. 15° 47.77′N, long. 60° 15.02′E) and on 12 September 2007 (station 23: lat. 15° 00′N, long. 63°59′E). All three stations were sampled during the day. Water samples were collected and processed as per JGOFS Protocols (UNESCO 1994). Temperature and salinity profiles were obtained from a conductivity-temperature-depth (CTD) unit (Sea Bird Electronics, Bellevue, WA, USA) mounted on a rosette having 24, 12-liter Go-FLO bottles (General Oceanics, Miami, FL, USA) for water sampling. Water samples were collected from different depths in the upper 120 m for chemical measurements and for esti- mating phytoplankton composition and standing stock (total- and size-based chlorophyll a), enumeration of heterotrophic nanoflagellates and bacteria. Mesozooplank- tonsamples were collected from five strata (based on the physical structure of the water column) using a Multiple Plankton Net (200 μm; HYDRO-BIOS, Kiel-Holtenau, Germany) from the upper 1,000 m. Details of sampling and processing procedures are asfollows.
Chemical measurements
Chemical analyses of water samples for dissolved oxy- gen and nutrients were performed following standard procedures (SCOR 1996). Dissolved oxygen was ana- lyzed following the Winkler titrimetric procedure using an automated system built and supplied by the Scripps Institution of Oceanography/Ocean Data Facility (SIO/ODF) group. Nutrients were measured with a SKA- LAR Analyzer (SKALAR, Breda, the Netherlands). A portion of the colony was frozen at −80°C, and the remainder was then preserved separately in ethanol (70%) and hexamine-buffered formaldehyde (4%). Small portions of the colony (3 × 3 cm, approximately 60 zooids) were thoroughly washed in milli-Q water (Millipore Corporation, Darmstadt, Germany) and dried at 60°C for measurements of C-to-N ratio and stable isotopic (δ13C and δ15N) composition by an isotopic ratio mass spectro- photometer coupled to an elemental analyzer. Isotopic ra- tios were measured relative to Peedee Belemnite for carbon and atmospheric N2 for nitrogen. Precision values of 0.2‰ for δ13C and 0.3‰ for δ15N were obtained by mul- tiple measurements of an external standard. Protein con- tent of the organism extracted using the method of Rausch (1981) was quantified following Bradford (1976). For this purpose, two randomly picked pieces of the Pyrosoma col- ony (3 × 3 cm) were freeze-dried before extraction in 5 ml of buffer (in triplicate). Absorbance was measured at 595 nm.
Biological measurements
Phytoplankton biomass (chlorophyll a)
Duplicate samples (1 L) from each depth (0, 10, 20, 40, 60, 80, 100, and 120 m) were filtered through 47-mm GF/F filters (0.7 μm pore size). Chlorophyll a (Chl a) was extracted in 10 ml of 90% acetone in the dark for 24 h at 4°C. A fluorometer (Turner Designs, Sunnyvale, CA, USA) was used for measuring fluorescence.
Size-fractionated phytoplankton biomass
A known volume of water sample (2 to 5 L) was passed serially through different pore size filters (200, 60, 20, and 10 μm nylon and 0.7 μm GF/F). These filters were then processed following the procedure described above for total Chl a.
Phytoplankton cell counts (>10 μm)
A sub-sample of 250 ml from each of the above men- tioned eight depths was fixed in 2% Lugol′s iodine and preserved by adding 3% formaldehyde. All samples were stored in the dark at room temperature until enumer- ation. A settling and siphoning procedure was followed to concentrate the samples. Two replicates of 1 mL of the concentrated samples were then examined micro- scopically in a Sedgewick-Rafter plankton counting chamber (Structure Probe, Inc., West Chester, PA, USA) at ×200 magnification.
Flow cytometry
Abundances of Synechococcus and picoeukaryotes were determined in glutaraldehyde (1% final concentration) fixed samples. All samples were frozen instantly in liquid nitrogen. Population was identified on FACSCalibur (Becton-Dickinson Biosciences, Franklin Lakes, NJ, USA) flow cytometer according to population fluorescence and light scatter characteristics (Vaulot et al. 1990).
HPLC pigments
Water samples (2 to 3 L) for pigment analyses were fil- tered through GF/F (0.7 μm, 25 mm diameter) and the filters stored at −85°C until analysis in the shore labora- tory a few weeks after the cruise. Phytoplankton pig- ments from the frozen filters were extracted in 3 ml 95% acetone (v/v in deionized water) in 5 min, using an ultra- sonic bath (5 s, 20 kHz) filled with ice water. These extracts were then stored overnight at −20°C for high performance liquid chromatography (HPLC) analysis. Samples were later passed through a Teflon syringe cart- ridge (Millipore) (pore size 0.45 μm, diameter 25 mm) to remove the cellular debris. The clear extract was col- lected in a 2-ml glass vial and placed directly into the temperature-controlled (5°C) auto-sampler tray for HPLC analysis. The entire extraction procedure was carried out in dim light conditions and at low temperature to minimize degradation of pigments. The HPLC analysis was carried out following the method of Van Heuke- lem (2002) as detailed in Roy et al. (2006); however, the buffer used in this case was Tetrabutylammonium Acetate which had a concentration of 0.025 M. In the present study, the sum of 19-hexanoyloxyfucoxanthin (19′HF), 19-butanoyloxyfucoxanthin (19BF), alloxanthin (Allo), and chlorophyll b was used to indicate nanoflagel- late abundance. Zeaxanthin (Zea), fucoxanthin (Fuc), and peridinin (Per) were considered to represent cyanobac- teria, diatoms, and dinoflagellates, respectively. Diagnostic pigment (DP) indices were calculated following the method of Barlow et al. (2007) for assessing the phyto- plankton communities. Four major groups were evaluated. The indices representing the groups were designated as DiatDP (diatoms), DinoDP (dinoflagellates), FlagDP (nano- flagellates), and ProkDP (Prokaryotes).
Bacterial abundance
Sub-samples (20 to 50 ml) from each of the depths men- tioned above and additionally from 150, 200, 300, 500, 600, and 800 m were fixed with 4% of 0.22-μm-filtered formaldehyde and stored at 4°C until DAPI stained direct counts (AODC) were made. Counting was done using an Olympus BH2 epifluorescence microscope (Olympus Corp., Tokyo, Japan).
Heterotrophic nanoflagellates
In order to determine the abundance of heterotrophic nanoflagellates, 100 ml of each water sample was fixed in glutaraldehyde (2% final concentration). A known vol- ume of water was filtered through 0.8 μm blackNuclepore (Nuclepore, NJ, USA) filters (Booth 1993) after staining with DAPI and proflavine at the final concentration of 5 μg/mland allowing staining for 5 min (Hass 1982, Booth 1993). Slides were prepared and held at 5°C in a darkened box until used for epifluorescence microscopy.
Mesozooplankton biomass (ZP)
The biomass of mesozooplankton was estimated as dis- placement volume after blotting it on an absorbent paper and then measuring in a graduated cylinder. This was done before preservation of the sample. In the shore la- boratory, organisms were identified to the genus (species level in some forms) level under a stereo zoom micro- scope (magnification × 160; Nikon Corp., Tokyo, Japan).
RESULTS
Physico-chemical parameters
The P. spinosum swarm was found at station 20. This region (study location) experienced relatively weaker southwesterly winds (3.3 to 9.9 m s−1; average 6.8 ± 1.5). Similarly, variations in air temperature were well within 1°C (25.5 to 26.1; average 25.8 ± 0.15°C). Sea surface temperature (SST) at station 17 (located to the southwest of study location; Figure 1) was 0.5°C cooler than the other two stations (20 and 23) indicating a greater influence of upwelled water advecting offshore from the coastal up- welling sites. At the latter two stations, both temperature and salinity were also low (Figure 2A, B). The mixed layer depth (MLD, inferred from the temperature profiles) was shallower at stations 20 and 17 (approximately 50 m) than at station 23 (approximately 70 m; Figure 2A). However, despite the deeper MLD and more offshore location of station 23, surface nitrate concentration at this station was slightly higher (approximately 4 μM) than at station 20 (approximately 2.5 μM). Station 17 had much higher surface nitrate, approximately 11 μM. A similar trend was observed with phosphate (Figure 3B) and silicate (Figure 3C), but ammonium was significantly higher (two- to sixfold) at station 20 (approximately 5μM) than at other two stations. Dissolved oxygen concen- trations (Figure 4) were <0.5 ml/L between 200 and 1,000 m (except at 250 m) at station 20. Even lower concentrations (close to or below the detection limit between 150 and 500 m) were recorded at station 23.
Fig. 2.

Figure 2 Vertical profiles of (A) temperature (°C) and (B) salinity at the three locations.
Fig. 3.

Figure 3 Vertical profiles of nutrients (A) nitrate, (B) phosphate, and (C) silicate at the three locations.
Fig. 4.
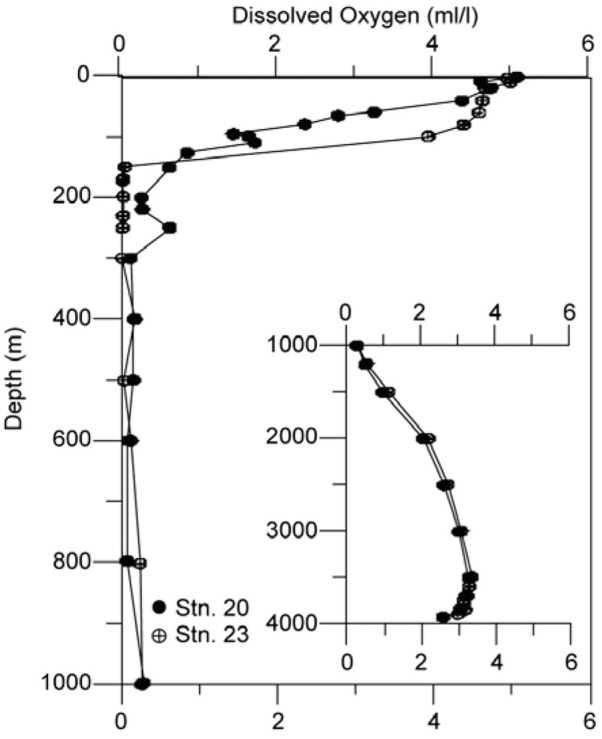
Figure 4 Vertical profiles of dissolve oxygen concentration at two of the locations.
Biological parameters
Chlorophyll a (total and size fractionated; fluorometric analysis)
Contrary to expectations, availability of substantial mac- ronutrients in surface waters at all three stations did not result in commensurately high Chl concentrations. This is consistent with the results of Naqvi et al. (2010) who proposed that phytoplankton productivity in this region is limited by iron toward the end of the southwest mon- soon. However, despite the lowest macronutrient levels in surface waters among the three stations, the phyto- plankton biomass was the highest at station 20, for both the surface Chl a concentration (0.60 mg/m3) and the column inventory (27.3 mg/m2; 0 to 120 m). The total bio- mass (equivalent to station 17) was roughly 11.55 mg/m2 higher than at station 23 (Figure 5A). Further, analysis of phytoplankton biomass in different size fractions, car- ried out by gravity filtration, showed higher biomass in the larger (>20 μm) fractions (approximately 48%, Figure 5B) at stations 17 and 23 than at station 20, where the biomass were largely dominated by the smaller (<20 μm)fractions, (approximately 79%; Figure 5B) indicating the dominance of pico- and nanoautotrophs. Further, the lower phaeopigment-to-chlorophyll ratio in the upper 60 m was significantly lower (0.3 ± 0.18) at station 20 than at the other two stations (0.5 ± 0.3) indicating relatively healthy autotrophic cells prevail- ing at station 20.
Fig. 5.

Figure 5 Vertical profiles of total and percent chlorophyll. (A) Total chlorophyll a and phaeopments; (B) percent chlorophyll a biomass in different fractions (μm) at different locations.
Phytoplankton cell abundance and composition (microscopic analyses of >10 μm cells)
Numerically averaged cell proportion of diatoms in the phytoplankton community excluding Phaeocystis was lower at station 20 (46%) than station 23 (74%) and 17 (94%; Figure 6A) indicating the overall dominance of dia- toms at the two latter stations. It was interesting to find centric diatoms (chain forming in particular) dominating at station 20 (Table 1; Figure 6B, C). Further, dinoflagellate contribution at the swarm region (station 20) was the least (3%; Figure 6D).Overall, phytoplankton diversity was also low at station 20: altogether, 22, 15, and 18 genera were recorded at stations 23, 20, and 17, respectively (Table 1).
Table 1 Taxonomic list of phytoplankton (>5 μm) and their abundance at three different stations.
| Phytoplankton composition | Station17 CellL−1 | Phytoplankton | Station20 CellL−1 | Phytoplankton | Station23 CellL−1 |
| (<100mt) | composition | (<100mt) | composition | (<100mt) | |
| Diatom(centric) | |||||
| Bacteriastrum delicatulum | 25 | Chaetoceros peruvianus | 24 | Chaetocerosspp. | 111 |
| Chaetoceroscoarctatus associatedwith vorticella | 42 | Corethronhystrix | 45 | Coscinodiscusspp. | 140 |
| Chaetoceros messanensis | 85 | Fragilariaspp. | 152 | Fragilariaspp. | 75 |
| Chaetoceros peruvianus | 25 | Rhizosoleniarobusta | 25 | Planktoniellasol | 19 |
| Chaetocerosspp. | 113 | Thalassiosiraspp. | 89 | Pleurosigmaspp. | 19 |
| Coscinodiscus radiatus | 41 | Rhizosoleniaalata | 408 | ||
| Coscinodiscuseccentricus | 2 | Rhizosoleniahebetata | 152 | ||
| Coscinodiscusspp. | 21 | Rhizosoleniaimbricata | 157 | ||
| Guinardia flaccida | 42 | Rhizosoleniarobusta | 60 | ||
| Guinardiastriata | 42 | Rhizosolenia shrubsolei | 105 | ||
| Leptocylindrusminimus | 190 | Rhizosoleniaspp. | 11 | ||
| Rhizosoleniaalata | 404 | Rhizosolenia styliformis | 494 | ||
| Rhizosoleniainassociation with vorticella | 98 | Thalassiosiraspp. | 318 | ||
| Rhizosolenia hebetata | 29 | ||||
| Rhizosoleniaimbricata | 199 | ||||
| Rhizosoleniarobusta | 31 | ||||
| Rhizosolenia setigera | 21 | ||||
| Rhizosolenia shrubsolei | 19 | ||||
| Rhizosolenia stolterfothii | 21 | ||||
| Rhizosolenia styliformis | 521 | ||||
| Rhizosoleniaspp. | 21 | ||||
| Thalassiosiraspp. | 337 | ||||
| Diatom(pennate) | |||||
| Cocconeisspp. | 25 | Naviculaspp. | 43 | Coconeisspp. | 38 |
| Naviculadirecta | 21 | Nitzschia closterium | 136 | Naviculatransitrans f. delicatula | 22 |
| Naviculaspp. | 155 | Nitzschia spp. | 66 | Naviculaspp. | 49 |
| Naviculatransitrans f. delicatula | 10 | Pseudonitzschiaspp. | 165 | Nitzschia closterium | 98 |
| Nitzschia closterium | 21 | Thalassiothrixspp. | 443 | Nitzschia spp. | 198 |
| Nitzschia spp. | 19 | Pseudonitzschiaspp. | 151 | ||
| Pleurosigmadirectum | 10 | Thalassiothrixlongissima | 241 | ||
| Pleurosigmaspp. | 144 | ||||
| Pseudonitszchiaspp. | 19 | ||||
| Thalassiothrixspp. | 85 | ||||
| Dinoflagellates | |||||
| Ceratiumfusus | 21 | Amphidiniumspp. | 21 | Amphidiniumspp. | 19 |
| Ceratium horridum | 42 | Ceratiumfusus | 21 | Amphisoleniabidentata | 46 |
| Ceratiumtripos | 34 | Gymnodiumspp. | 24 | Ceratiumtripos | 22 |
| Goniodomaspp. | 21 | Gyrodiniumspp. | 21 | Dinoflagellatecysts | 19 |
| Gyrodiniumspp. | 46 | Phalacromarotundatum | 21 | Gonyaulaxspp. | 22 |
| Protoperidiniumdepressum | 42 | Prorocentrumdentatum | 21 | Gymnodiumspp. | 46 |
| Protoperidiniumgrande | 21 | Prorocentrumspp. | 21 | Gyrodiniumspp. | 25 |
| Protoperidiniumoceanicum | 10 | Podolampusspp. | 11 | ||
| Protoperidiniumsteinii | 10 | Protoperidiniumspp. | 46 | ||
| Pyrophacushorologium | 42 | ||||
| Silicoflagellate | |||||
| Dictyochafibula | 19 | Dictyochaspp. | 27 | ||
| Chrysophyceae | |||||
| Phaeocystisspp. | 1,691 | Phaeocystisspp. | 6,986,667 | Phaeocystisspp. | 12,285,714 |
| Totalcells L−1 | 3,103 | 1,367 | 3,166 |
Fig. 6.

Figure 6 Vertical profiles of total phytoplankton, centric and pennate diatoms, and dinoflagellates. (A) Total phytoplankton, (B) diatoms (centric), (C) diatoms (pennate), and (D) dinoflagellates at the three locations. Grey filled circles in (A) indicate presence of phaeocystis.
Phaeocystis distribution was patchy both geographic- ally and vertically in the water column. They were found at surface (stations 17 and 23), 10 m (stations 20 and 23) and at 40 m (station 20). Maximum cell counts (86 × 106/L) were found at 10 m of station 23 and the least at station 17 (0.01 × 10⁶/L). At station 20, Phaeocystis were found even at a deeper depth (40 m; 18.4 × 10⁶/L). Their contribution to total phytoplankton abundance was siz- able (see Figure 6A). At a few depths, their contribution to the total phytoplankton abundance was as high as 99.99%. A near-surface maximum of Phaeocystis (52% of the total phytoplankton abundance) was found only at station 17 (Figure 6A).
Picophytoplankton (flow cytometry based)
Flow cytometric data yielded a Synechococcus count at station 20 (approximately 20 × 106/ml at the surface) that was 2.5 and 9.5 times higher than the corresponding counts at stations 17 and 23, respectively (Figure 7A). Conversely, the number of picoeukaryotes were the least at station 20 (0.12 × 10⁶/ml), compared to the counts at the other sites of 0.15 × 10⁶/ml at station 17 and 0.27 × 10⁶/ml at station 23 (Figure 7B).
Fig. 7.

Figure 7 Vertical profiles of Synechococcus and picoeukaryotes. (A) Synechococcus (×106/ml) and (B) picoeukaryotes (×106/ml) abundance at the three locations.
Pigment analyses (HPLC based)
Overall, phytoplankton pigments remained low, resem- bling nearly oligotrophic conditions. The pigment- derived diagnostic index (Figure 8), based on Barlow et al. (2007), revealed systematic differences in phyto- plankton composition between stations (17, 20, and 23). DiatDP proportion ranged from 0.04 to 0.16 at station 20 and from 0.12 to 0.19 at station 23, substantially lower than at station 17 (0.21 to 0.32). DinoDP also showed a similar trend with minor increase below the surface at station 17. The FlagDP proportion representing the nano- flagellates was substantially higher than those of the lar- ger phytoplankton groups, ranging between 0.41 and 0.58. The ProkDP proportion, used to denote zeaxanthin containing cyanobacteria, showed significant increases at Stations 20 (and 23) suggesting the dominance of prokaryotes at these stations unlike station 17 where the ProkDP was low. Based on the diagnostic index, the order of dominance of phytoplankton groups at stations 20 and 23 was FlagDP > ProkDP > DiatDP > DinoDP. At sta- tion 17, the order was FlagDP > DiatDP > DinoDP > ProkDP. Thus, flagellates appear to have been the most important autotrophs at all stations followed by cyanobacteria at stations 20 (and 23), and by diatoms at station 17.
Fig. 8.

Figure 8 Dominant phytoplankton pigments (A) DiatDP, (B) DinoDP, (C) FlagDP, and (D) ProkDP at three locations.
Bacterial abundance
Bacterial abundance at station 20 (swarm site) was much lower as compared to non-swarm region even though in the upper water column their abundance showed a comparable vertical distribution at stations 20 and 23 (Figure 9A), except for an increase in abundance within the suboxic zone of station 23. Peak abundances found just below the surface (20 to 40 m) at station 17 was ap- proximately threefold higher (1.1 × 10⁹ /L) than at sta- tions 20 (and 23).
Fig. 9.

Figure 9 Abundance of (A) bacteria, (B) heterotrophic nanoflagellates at the three locations, and (C) their coupling.
Heterotrophic nanoflagellates
Intriguingly, heterotrophic nanoflagellates (HNF) showed a trend different from that of bacterial abundance. In this case, abundance and depth profiles were similar for sta- tions 17 and 23, but at station 20, a large increase in the HNF population occurred at 20 m depth (0.17 × 10⁷/L) with elevated numbers persisting down to at least 60 m. Similar to the bacterial population, little differences were observed below 80 m depth (Figure 9B). There was a sig- nificant correlation (Figure 9C) between heterotrophic nanoflagellates and bacteria (p < 0.001, n = 40), although the r2 value was only 0.5.
Mesozooplankton
Mesozooplankton (>200 μm in size) abundance in the upper 1,000 m (0 to 200 mt/200 to 1,000 m) did not dif- fer much between stations 17 (2,349/1,579 m−3) and 20 (2,378/1,057 m−3). On the other hand, abundance at sta- tion 23 was nearly twofold higher (4,670/736 m−3), par- ticularly in the upper layer. Biomass also showed asimilar trend with twofold higher values at station 23 (82 ml/100m3; Table 1). Vertically, 88% to 97% of the biomass was in the upper 200 m (Figure 10A) particu- larly within the MLD. Overall, both numbers of organ- isms and their biomass decreased with increasing depth in the upper 1,000 m (Figure 10A).
Fig. 10.

Figure 10 Vertical distribution Mesozooplankton biomass (A) and (B) depth integrated abundance of phytoplankton (>5 mμ), het nanoflagellates, het. Bacteria (Bacteria), picoeukaryotes, Synechococcus, and chlorophyll a concentration (Chl a) in upper 100 mt water column at the three different locations.
Mesozooplankton composition in the region was dom- inated by 15 groups. Overall, diversity of these forms did vary between the stations. Most diverse forms belongedto copepoda family, such as Calanidae, Paracalanidae, Euchaetidae, Scolecitrichidae, Centropagidae, Temoridae, Acartidae, Candaciidae, Pontellidae, Aetideidae, He- terorhabdidae, Lucicutidae, Augaptilidae, Monstrilli- dae, Mormonillidae, and Metridinidae. Most abundant copepods present were Oncea spp., Corycaeus spp., and Paracalanus spp. while few representatives belonging to Cyclopoida, Poicilostomatoida, and Harpacticoida were also found (Table 2).
Table 2 Taxonomic list of mesozooplankton (>200 μm) and their abundance at three different stations.
| Mesozooplankton (copepod) composition | 0 to 200 mt (org/100 m3) | ||
| Station 23 | Station 20 | Station 17 | |
| Calanoida | |||
| Calanidae | |||
| Canthocalanus pauper | * | 1 | * |
| Cosmocalanus darwini | 1 | 4 | - |
| Calanoides carinatus | - | 1 | |
| Undinula vulgaris | 2 | - | 2 |
| Calanus spp. | - | - | 1 |
| Eucalanidae | |||
| Eucalanus attenuatus | 1 | 1 | 1 |
| Eucalanus subcrassus | * | 5 | |
| Eucalanus spp. | 3 | 3 | 3 |
| Rhincalanus cornutus | 2 | * | * |
| Rhincalanus nasutus | 1 | - | 1 |
| Paracalanidae | |||
| Acrocalanus gibber | 5 | 1 | 1 |
| Acrocalanus sp. | 13 | 1 | * |
| Paracalanus spp. | 20 | 27 | 19 |
| Calocalanus pavo | 2 | - | - |
| Calocalanus sp. | - | 1 | * |
| Euchaetidae | |||
| Euchaeta concinna | - | - | * |
| Euchaeta wolfendeni | - | - | 1 |
| Euchaeta marina | * | - | - |
| Euchaeta spp. | 1 | * | 1 |
| Scolecithricidae | |||
| Scolecithricella spp. | 2 | 1 | 1 |
| Scaphocalanus spp. | - | - | 1 |
| Scottocalanus helenae | - | - | 1 |
| Lophothrix frontalis | - | * | - |
| Centropagidae | |||
| Centropage furcatus | 2 | 1 | 1 |
| Temoridae | |||
| Temora stylifera | * | - | 1 |
| Temora discaudata | - | - | 1 |
| Acartiidae | |||
| Acartia spp. | 2 | 1 | 2 |
| Acartia erythraea | 1 | - | 1 |
| Clausocalanidae | |||
| Clausocalanus furcatus | 1 | 1 | 1 |
| Candaciidae | |||
| Candacia pachydactyla | - | - | 1 |
| Candacia curta | 1 | - | - |
| Candacia bradyi | * | 1 | - |
| Pontellidae | |||
| Labidocera acuta | 1 | - | - |
| Labidocera minuta | * | - | - |
| Labidocera sp. | 3 | - | 1 |
| Calanopia sp. | 1 | 1 | - |
| Aetideidae | |||
| Aetideus sp. | - | * | * |
| Euchirella amoena | * | * | - |
| Euchirella maxima | - | * | - |
| Euaetideus giesbrechti | - | - | * |
| Augaptiliidae | |||
| Euaugaptilus hecticus | - | - | * |
| Haloptilus spp. | - | - | * |
| Heterohabdidae | |||
| Heterohabdus sp. | * | 1 | 1 |
| Lucicutiidae | |||
| Lucicutia flavicornis | 2 | * | 1 |
| Lucicutia ovalis | * | * | 1 |
| Mormonillidae | |||
| Mormonilla phasma | * | 1 | |
| Mormonilla minor | - | * | 1 |
| Metridinidae | |||
| Pleuromamma (juveniles) | - | 3 | - |
| Pleuromamma xiphias | - | * | - |
| Pleuromamma indica | 2 | - | - |
| Pleuromamma gracilis | 1 | * | 2 |
| Cyclopoida | |||
| Oithonidae | |||
| Oithona plumifera | 2 | 3 | 1 |
| Oithona sp. | 6 | 4 | 3 |
| Oithona helgolandicus | - | 1 | - |
| Saphirella tropica | - | * | - |
| Poicilostomatoida | |||
| Corycaeidae | |||
| Corycaeus catus | 1 | - | 1 |
| Corycaeus sp. | 21 | 6 | 6 |
| Farranula gracilis | 1 | - | * |
| Faranula spp. | 5 | 1 | - |
| Oncaeidae | |||
| Oncaea sp. | 26 | 29 | 14 |
| Sapphirinidae | |||
| Sapphirina spp. | - | - | * |
| Sapphirina gastrica | - | - | 1 |
| Sapphirina darwini | * | - | - |
| Sapphirina metallina | * | - | - |
| Copilia mirabilis | 4 | - | * |
| Vettoria granulosa | * | - | - |
| Harpacticoida | |||
| Clytemnestridea | |||
| Clytemnestra scutellata | * | 1 | 1 |
| Euterpinidae | |||
| Euterpina acutifrons | 1 | - | 1 |
| Miraciidae | |||
| Macrosetella gracilis | * | - | - |
| Ectinosomatidae | |||
| Microsetella rosea | - | 1 | - |
| Microsetella norvegica | - | - | 1 |
| Copepode nauplii | 3 | 3 | 2 |
| Juvenile copepod | 4 | - | - |
Hyphens indicate that data are absent; *= <100 org/100 m3; 1= 100 to ≤1,000; 2= 1,000 to ≤2,000; 3 = 2,000 to 3,000. Numbers 4, 5, 6,… indicate abundances to<4,000; 4,000 to <5,000; 5,000 to <6,000, etc.
The integrated biomass and abundance data in the upper 120 m are plotted in Figure 10B. Total Chl a bio- mass was relatively higher at stations 20 and 17 (average 27 mg/m2) compared to station 23 (15.6 mg/m2). In contrast, phytoplankton abundance of smaller forms (<10 μm) dominated by Synechococcus was higher at sta- tion 20. The significance of Synechococcus is confirmed by flow cytometric and HPLC data. Possibly, observed high population of heterotrophic nanoflagellates was re- sponsible for sustaining lower bacterial counts through grazing at station 20 (and also at station 23). Further, average biomass and abundance of mesozooplankton at stations 20 (and 17) was twofold lower than that at station 23.
Biochemical composition of pyrosomes
The carbon and nitrogen contents of the pyrosome col- onies, expressed as percent of dry weight, were 37.7 and 8.8, respectively. The molar C-to-N ratio, thus works out to be 5.0. The isotopic values were −19.91‰ for δ13Cand 7.43‰ for δ15N. The total protein concentration was approximately 134 mg/g dry wt.
DISCUSSION
Generally, pyrosomes are strong diurnal migrators. During the day, they prefer the safety of the dark mesopelagic zone, while at night they migrate to the surface layer to feed on plankton (Angel 1989; Andersen et al. 1992). In the present study, the longest colony of ap- proximately 2 m long was recovered at night from shallow depths. P. spinosum nearly of the same dimension was re- covered accidentally with the CTD rosette in the North Atlantic during a cruise of G.O. Sars (see http://www.mar- eco.no/mareco_news/2004/the_pyrosome_story). A much longer (6 × 0.9 m) colony of P.spinosum Herdman was re- ported from the New Zealand waters (Griffin and Yaldwyn 1970). The occurrence of P. spinosum at the surface dur- ing midday is possibly be due to the presence of a very shallow intense oxygen minimum zone (OMZ), which may act as a physical barrier for vertical movement in the entire North Indian Ocean. Similarly, no clear day- night migration pattern was recorded in Pyrosoma (not identified to the species level) in the open waters (along 88°E) of the Bay of Bengal (Madhupratap et al. 2003), although the Pyrosoma colonies there were non tubular, smaller in size (10 × 10 cm), fewer in number, and whitish in color.
As pointed out by Perissinotto et al. (2007), the trophic function, feeding dynamics, as well as ecology and physiology of pyrosomes are not well known. Ana- lysis of gut contents of Pyrosoma (Hart, as cited by Culkin and Morris 1970) showed that the main food was phytoplankton (approximately 80%) belong- ing to the classes Haptophyceae, Chrysophyceae, and Bacillariophyceae, the remainder was composed of protozoan species such as radiolarians and tintinnids. Consistent with this view, Bourguet et al. (2009) found higher values of Chl a (38 ± 14.6 ng Chl a eq./mg dry weight) in the guts of P. atlanticum collected from the NW Mediterranean Sea. The question arises why the P. spinosum swarm occurred only at station 20 and not at the other two stations; where the physicochemi- cal conditions were only slightly different? The map of the sea surface height anomaly overlaid with OSCAR surface current during the study period (Figure 11) de- picts offshore advection of waters but no accumula- tion of water at the swarm site. Thus, one may argue that the swarm of pyrosome was driven by the bio- logical factors. The low abundance of microphyto- plankton (as determined by the microscopic counts) at station 20 are indicators of selective feeding of the swarms on the larger plankton-diatoms or that the re- sultant excretory products (note that the ammonium concentration was higher at the swarm site) might have supported a high population of Synechococcus and Phaeocystis. On the other hand, it is also possible that the higher abundance of cyanobacteria and flagellates at station 20 (low silica region) as seen from HPLC and flow cytometry data contributed to higher phytoplankton biomass (Chl a content). A similar explanation for the oc- currence of salps in the northern Arabian Sea has been in- voked by Naqvi et al. (2002) who argued that a deficiency of silicate relative to nitrate limits diatom productivity in winter, a period of weak convection-driven vertical mixing. The data obtained in the present study confirm the postu- lation of Naqvi et al. (2010) that the high nitrate-to-silicate ratio in upwelled waters, promotes the growth of smaller, non diatomaceous phytoplankton as the upwelled water advects offshore. The dominance of Phaeocystis in the aged offshore advecting upwelled silica deficient waters in the central Arabian Sea (close to the present study site) has been previously reported by Garrison et al. (1998). Typical succession of phytoplankton community from dia- tom to Phaeocystis appears to be a regular phenomenon in the open waters of the Arabian Sea during late southwest monsoon, which may attract the pelagic tunicates that are able to feed on small particles. Such bloom events are gen- erally triggered by silicate depletion (Batje and Michaeles 1986; Verity et al. 1988) in the euphotic zone. Similar ob- servations were also recorded in the upper 80 m water col- umn at 15°N 64°E under the JGOFS (India) programme (1992 to 1997). At this site, undetectable silicate levels in the upper euphotic zone during southwest mon- soon was dominated by Phaeocystis bloom (Madhupratap et al. 2000) unlike northeast monsoon where silicate concentration were relatively higher and largely dominated by diatoms in terms of its diversity (species of Nitzchia, Chaetoceros, and Rhizosolenia were predominant forms) and abundance (Sawant and Madhupratap 1996).
Fig. 11.

Figure 11 Spatial map of sea surface height anomaly (cm) (shading) overlaid with OSCAR surface current (arrows) during 12 September 2007. White circles represent station locations.
Signatures of the relative dominance of non-diatoms groups were also seen in the HPLC data indicating that nanoflagellates were dominant at subsurface waters of stations 20 and 23 with the characteristic pigment (hexa- noyloxyfucoxanthin) found in the concentration range of 1 to 14 ng/L; its concentration was low (1 to 4 ng/L) at station 17. Further, zeaxanthin, which is a marker pig- ment of cyanobacteria, also contributed greatly to the total pigment pool (7 ng/L) at station 20. All tunicates are suspension feeders and have the ability to take-up very small particles, including bacteria (Drits et al. 1992, Jørgensen and Goldberg 1953, Harbison and Gilmer 1976, Harbison and McAlister 1979). According to Drits et al. (1992), the minimum size of particles for the pyro- somes to feed should be of considerably <3 μm.Salps, perhaps the best known of all tunicates, are known to favor low-chlorophyll environments (Harbison etal. 1998) presumable to avoid clogging of their esophagus in high-chlorophyll waters dominated by large phyto- plankton such as diatoms. With moderate chlorophyll levels and abundant small-sized autotrophs, we believe conditions prevailing at station 20 were best suited for the proliferation of tunicates in general. Thus, we favor the hypothesis that the pyrosome biomass was sustained by high densities of Synechococcus and flagellates that are of the right size (1 to 3 μm) to be retailed by tuni- cates and still not large enough to choke their filtration system.
The high clearance (Harbison and Gilmer 1976, Deibel 1988, Madin and Cetta 1984) and consumption rates make tunicates an important consumer of phytoplank- ton crop under swarm condition (Drits et al. 1992), due to which these colonial organisms produce very large quantities of faecal pellets and thus play an important role in the flux of organic carbon in the marine ecosys- tem (Esnal 1999). However, information available on their ingestion and particle clearance rate, particles/prey, and impact rates on planktonic biomass and production is sparse from the Arabian Sea. The tunicate work in the present study region is mostly restricted to the episodic swarms of salps (Lodh et al. 1998, Nair and Iyer 1974, Godeaux 1972, Naqvi et al. 2002, Ramaswamy et al. 2005). Ramaswamy et al. (2005) suggested that 36% of the PP was exported out of the surface layer largely through the sinking faecal pellets of salps. In the Southern Ocean, ingestion by salps has been reported to account for an even larger fraction (up to 100%) of the PP (Dubischar and Bathmann 1997). Thus, we conclude that at the swarm site (station 20) fate of smaller-sized autotroph biomass was mostly recycling, supporting microbial food web.
Here, we attempted to estimate carbon processing by P. spinosum in the Arabian Sea based on the work of Drits et al. (1992) on P. atlanticum from off the Congo River mouth, even though these two tunicates are not very similar morphologically. We used the following values: filtration efficiency = 3 to 7.2 L ind−1 h−1); ingestion = 4% to 53% of the phytoplankton standing stock;rate of fecal pellet production = 1.4 to 2.2 pellets h−1 zooid−1 (this rate is similar to that for salps; Ramas-wamy et al. 2005); dry weight of each pellet = 2 μg; car- bon content = 22% of the dry weight, and sinking rate of pellets = 70 m d−1 (this is 6 to 12 times slower than that of salps; Ramaswamy et al. 2005). For 24 h, we calcu- lated that a tubular colony having a dimension of 50 × 150 cm (with 50,000 zooids) would produce 1.7 × 10⁶ to 2.6 × 10⁶ pellets d−1. The amount of water filtered by such a colony would be 3.6 to 8.6 × 10⁶ L d−1. The con- tribution of such a colony to carbon export from the surface layer would be 0.74 to 1.16 g C d−1. In general, thishighlights key role of tunicates in the marine carbon cycle. Readers should use caution when interpreting these estimates. Further, due to the episodic nature of the swarms the significance of pyrosomes to the total carbon export from the surface layer cannot be quantified. In addition to the flux through faecal pellets, sinking of dead colonies is also known to contribute to carbon export. For example, photographs taken ata depth of 5,540 m at the bottom of the Madeira Abyssal Plain showed the arrival of dead Pyrosoma on the sea bed, where it was consumed by echinoderms, cnidar- ians, and arthropods, reflecting the considerable eco- logical influence of such organisms on the food web in the deep sea (Lampitt et al. 2001).
P. spinosum, similar to P. atlanticum, was also found to have a high carbon content (37% of dry weight). The nitrogen content was estimated to be 17% of dry weight. Both carbon and nitrogen contents are higher than re- ported by Larson (1986) for gelatinous zooplankton including thaliaceans. The molar C-to-N ratio (5) in P. spinosum is higher than the value (4) for P. atlanticum reported by Gabriel et al. (1988). Yet, this value is lower than the Redfield ratio (6.6), presumably because of the more proteinaceous nature of pyrosomes relative to ‘average’ marine organic matter. Nonetheless, the protein content of P. spinosum obtained by us (134 mg/g) is lower than the values reported previously (e.g., 355 mg/g; Raymont et al. 1975). Further, the C and N isotopic values of Pyrosoma tissue (−19.91‰ for δ13C and 7.43‰ for δ15N) are slightly higher than the average marine organic matter. The high carbon and protein contents in their dry weight indicate their potential value as a food source for predators in the ecosystem. Previous work of Harbison (1998), James and Stahl (2000), Childerhouse et al. (2001), and Hedd and Gales (2001) demonstrated that pyrosomes are actually a very important prey item in the diet of many marine mam- mals, fish, turtle and also albatross, and sea lion.
On the other hand, saphiriniid mysterious parasitic co- pepods have often been found to be associated with pyrosome colonies (Harbison 1998, Tregouboff and Rose 1957, Monticelli and Lo Bianco 1901, Lindley et al.2001) including north-western Indian Ocean (Rajaram and Krishnaswamy 1980). In the present study, species of Sappharina (darwinii and metallina) were not found at station 20, but they were present at the other two sta- tions (stations 17 and 23) where the swarm was not found. The absence of these parasitic species at station 20 may be an additional reason for sustaining the preva- lence of P. spinosum swarm.
CONCLUSIONS
During the middle of the day, a pyrosome swarm was observed in the surface waters of the central Arabian Sea. Presence of the perennial oxygen minimum zoneat subsurface depth may have restrain pyrosomes from mi- grating into the deeper layer. Biological factors predom- inantly seem to have sustained pyrosome swarm. At the swarm site, surface water advected from the coastal upwelling region or entrained from the thermocline characterized by low silicate, and high nitrate and am- monia concentrations perhaps promoted the growth of smaller, non-diatomaceous phytoplankton. Since tu- nicates have the ability to take-up very small particles, the high densities of Synechococcus and flagellates that are of the right size (1 to 3 μm) appear to have offered favorable condition for nourishment of these filter feeders P. spinosum. The absence of parasitic species of copepods Sappharina (darwinii and metallina) may be an additional reason for sustaining the prevalence of P. spinosumswarm. Overall, the occurrence and importance of tunicates such as pyrosomes have been largely over- looked in the northern Indian Ocean and warrant further investigations.
Additional file
Photograph showing floating Pyrosoma spinosum swarms in the surface waters of station 20. (A) Floating colony; (B) colony caught CTD; (C) colony on deck; (D) closer view of colony under microscope; (E) zooids under bright field; and (F) zooids under dark field.
Acknowledgments
Acknowledgements
The authors thank the director of CSIR-NIO for his encouragement in carrying out this study. The authors wish to thank the CSIR (India) for financial support. This work was carried out as a part of network programmes ‘CMM0009’ and ‘NWP 0014’. We thank Mrs. Supriya Karapurkar for elemental/isotopic analyses of samples and Dr. Catherine Sumathi for protein estimation. We are grateful to the captain and crew of R.V. RogerRevelle fortheir help in deck operations andto our colleagues for their assistance in sampling and analysis. This is NIO contribution no. 5684.
Footnotes
Authors’ contributions: MG participated in sample collection and analysis of some of biological parameters and drafted and revised manuscript. SM participated in the cruise and carried out analysis of phytoplankton and zooplankton taxonomy. AP participated in the cruise and carried out chemical measurements. RR participated in the cruise and carried out HPLC-based pigment analyses. SWAN led the cruise, carried out chemical analysis, and helped in drafting and editing of the previous versions of manuscript. All authors read and approved the final manuscript.
Competing interests: The authors declare that they have no competing interests.
References
- Alldredge A L. The impact of appendicularian grazing on natural food concentrations in situ. Limnol Oceanogr. 26:247–257. [Google Scholar]
- Andersen V, Sardou J, Nival P. The diel migrations and vertical distributions of zooplankton and micronekton in the Northwestern Mediterranean Sea. 2. Siphonophores, hydromedusae and pyrosomids. J Plankton Res. 14:1155–1169. [Google Scholar]
- Angel M V. Vertical profiles of pelagic communities in the vicinity of the Azores Front and their implications to deep ocean ecology. Prog Oceanogr; 1989. 22 [Google Scholar]
- Barlow R, Stuart V, Lutz V, Sessions H, Sathyendranath S, Platt T, Kyewalyanga M, Clementson L, Fukasawa M, Watanabe S, Devred E. Seasonal pigment patterns of surface phytoplankton in the subtropical southern hemisphere. Deep Sea Res I. 54:1687–1703. [Google Scholar]
- Bary B M. Notes on the ecology, distribution and systematics of pelagic Tunicata from New Zealand. Pac Sci. 14:101–121. [Google Scholar]
- Bätje M, Michaelis H. Phaeocystis pouchetii blooms in the East Frisian coastal waters. German. 93:21–27. [Google Scholar]
- Booth B C, Lewin J, Postel J R. Temporal variation in the structure of autotrophic and heterotrophic communities in the subarctic pacific. Prog Oceanogr. 32:57–99. [Google Scholar]
- Bourguet N, Goutx M, Ghiglione J, Pujo-Pay M, Mével G, Momzikoff A, Mousseau L, Guigue C, Garcia N, Raimbault P, Oriol Pete R, Lefèvre L. Lipid biomarkers and bacterial lipase activities as indicators of organic matter and bacterial dynamics in contrasted regimes at the DYFAMED site. NW Mediterranean. Deep Sea Res II. 56:1454–1469. [Google Scholar]
- Bradford M M. A rapid and sensitive method for the quantitation of microgram quantities of protein utilizing the principle of protein-dye binding. Anal Biochem. 72:248–254. doi: 10.1016/0003-2697(76)90527-3. [DOI] [PubMed] [Google Scholar]
- Brown S L, Landry M R, Barber R T, Campbell L, Garrison D L, Gowing M M. Picophytoplankton dynamics and production in the Arabian Sea during the 1995 Southwest Monsoon. Deep Sea Res II. 46:1745–1768. [Google Scholar]
- Childerhouse S, Dix B, Gales N. Diet of New Zealand sea lions (Phocarctos hookeri) at the Auckland Islands. Wildl Res. 28:291–298. [Google Scholar]
- Culkin F, Morris R J. The fatty acids of some cephalopods. Deep Sea Res. 17:171–174. [Google Scholar]
- Deibel D. Laboratory-measured grazing and ingestion rates of the salp, Thalia democratica Forskal, and the doliolid, Dolioletta gegenbauri Uljanin (Tunicata, Thaliacea) J Plankton Res. 4:189–201. [Google Scholar]
- Deibel D. Feeding mechanism and house of the appendicularian Oikopleura vanhoeffeni. Mar Biol. 93:429–437. [Google Scholar]
- Deibel D. Filter feeding by Oikopleura vanhoeffeni, grazing impact on suspended particles in cold ocean waters. Mar Biol. 99:177–187. [Google Scholar]
- Drits A V, Arashkevich E G, Semenova T N. Pyrosoma atlanticum (Tunicata, Thaliacea): grazing impact on phytoplankton standing stock and role in organic carbon flux. J Plankton Res. 14:799–809. [Google Scholar]
- Dubischar C D, Bathmann U V. Grazing impact of copepods and salps on phytoplankton in the Atlantic sector of the Southern Ocean. Deep Sea Res II. 44:415–433. [Google Scholar]
- Esnal G. Backhuys Publishers. pp. 1423–1444.
- Gabriel G, Dallot S, Sardou J, Fenaux R, Claude C, Isabelle P. C and N composition of some northwestern Mediterranean zooplankton and micronekton species. J Exp Mar Biol Ecol. 124:133–144. [Google Scholar]
- Garrison D L, Gowing M M, Hughes M P. Nano-and microplankton assemblages in the northern Arabian Sea during the Southwestern Monsoon. US JGOFS study. Deep-Sea Res II. 45:2269–2299. [Google Scholar]
- Godeaux J. Pelagic tunicates of the Indian Ocean. J Mar Biol Ass India. 14:263–292. [Google Scholar]
- Griffin Djg, Yaldwyn J C. Giant colonies of pelagic tunicates (Pyrosoma spinosum) from SE Australia and New Zealand. Nature; 1970. 226. [DOI] [PubMed] [Google Scholar]
- Haas L W. Improved epifluorescence microscopy for observing planktonic organisms. Ann Inst Oceanogr Paris. 58:261–266. [Google Scholar]
- Harbison G R. The parasites and predators of Thaliacea. In: Bone Q (ed) The biology of pelagic tunicates. Oxford University Press. pp. 187–214.
- Harbison G R, Gilmer R W. The feeding rates of the pelagic tunicate, Pegea confoederata, and two other salps. Limnol Oceanogr. 21:517–528. [Google Scholar]
- Harbison G R, Mcalister V L. The filter feeding rates and particle retention efficiencies of three species of Cyclosalpa (Tunicata, Thaliacea) Limnol Oceanogr. 24:875–892. [Google Scholar]
- Hedd A, Gales R. The diet of shy albatrosses (Thalassarche cauta) at Albatross Island. Tasmania J Zool London. 253:69–90. [Google Scholar]
- Indian Ocean Biological Centre (1973) International Indian Ocean Expedition Plankton Atlas. In: Panikkar NK (ed). UNESCO/NIO, 4(2)
- James J D, Stahl J C. Diet of southern Buller's albatross (Diomedea bulleri bulleri) and the importance of fishery discards during chick rearing. N Z J Mar Freshw Res. 34:435–454. [Google Scholar]
- Jørgensen C B, Goldberg E D. Particle filtration in some ascidians and lamellibranchs. Biol Bull. 105:477–489. [Google Scholar]
- Lampitt R S, Bett B J, Kiriakoulakis K, Popova E E, Ragueneau O, Vangriesheim A, Wolff G A. Material supply to the abyssal seafloor in the northeast Atlantic. Prog Oceanogr. 50:27–63. [Google Scholar]
- Larson R J. Water content, organic content, and carbon and nitrogen composition of medusae from the northeast Pacific. J Exp Mar Biol Ecol. 99:107–120. [Google Scholar]
- Lindley J A, Hernández F, Scatllar J, Docoito J. Funchalia sp. (Crustacea: Penaeidae) associated with Pyrosoma atlanticum (Thaliacea: Pyrosomidae) off the Canary Islands. J Mar Biol Assoc UK. 81:173–174. [Google Scholar]
- Lodh N M, Gajbhiye S N, Nair V. Unusual congregation of salps off Verval and Bombay. West Coast of India Indian. J Mar Sci. 17:128–130. [Google Scholar]
- Madhupratap M, Sawant S, Gauns M. First report on a bloom of the marine prymnesiophycean, Phaeocystis globosa from the Arabian Sea. Oceanol Acta. 23:83–90. [Google Scholar]
- Madhupratap M, Gauns M, Ramaiah N, Kumar Prasanna, Muraleedharan S, Sousa De. Biogeochemistry of the Bay of Bengal: physical, chemical and primary productivity characteristics of the central and western Bay of Bengal during summer monsoon. Deep-Sea Res II. 50:881–896. [Google Scholar]
- Madin L P. The production, composition and sedimentation of salp fecal pellets in oceanic waters. Mar Biol. 67:39–45. [Google Scholar]
- Madin L P, Cetta C M. The use of gut fluorescence to estimate grazing by oceanic salps. J Plankton Res. 6:475–482. [Google Scholar]
- Millar R H. The biology of ascidians. Adv Mar Biol. 9:1–100. [Google Scholar]
- Monticelli F S, Bianco Lo. Sullo sviluppo dei peneididel Golfo di Napoli (note riassuntive) Monit Zool Ital. 11:23–31. [Google Scholar]
- Morrison J M, Codispoti L A, Smith S L, Wishner K, Flagg C, Gardner W D, Gaurin S, Naqvi Swa, Manghnani V, Prosperie L, Gundersen J S. The oxygen minimum zone in the Arabian Sea during 1995. Deep-Sea Res II. 46:1903–1931. [Google Scholar]
- Nair V R, Iyer H K. Quantitative distribution of copelates, salps and doliolids (Pelagic tunicates) in Indian Ocean. Indian J Mar Sci. 3:150–154. [Google Scholar]
- Naqvi Swa, Sarma Vvss, Jayakumar D A. Carbon cycling in the northern Arabian Sea during the northeast monsoon: significance of salps. Mar Ecol Prog Ser. 226:35–44. [Google Scholar]
- Naqvi Swa, Moffett J W, Gauns M U, Narvekar P V, Pratihary A K, Naik H, Shenoy D M, Jayakumar D A, Goepfert T J, Patra P K, Al-Azri A, Ahmed S I. The Arabian Sea as a high-nutrient, low-chlorophyll region during the late-Southwest Monsoon. Biogeosciences Discuss. 7:25–53. [Google Scholar]
- Neumann Y. Die pyrosomen und dolioliden der deutschen südpolar-expedition 1901-1903. In: Ergebn. Deutsche Südpol. Exped Zool. 6:1–34. [Google Scholar]
- Perissinotto R, Mayzaud P, Nichols P D, Labat J P. Grazing by Pyrosoma atlanticum (Tunicata, Thaliacea) in the south Indian Ocean. Mar Ecol Prog Ser. 330:1–11. [Google Scholar]
- Péron F. Mémoire sur le nouveau genre Pyrosoma. Ann Mus Hist Nat Paris. 1804;4:437–446. [Google Scholar]
- Rajaram L K, Krishnaswamy S. A note on the similarity in the distribution of Sapphirina (Copepoda, Crustacea) and Salpa (Thaliacea, Tunicata) in the north-western Indian ocean. Mahasagar -Bull Natl Inst Oceanogr. 13:71–77. [Google Scholar]
- Ramaswamy V, Sarin M M, Rengarajan R. Enhanced export of carbon by salps during the northeast monsoon period in the northern Arabian Sea. Deep-Sea Res II. 52:1922–1929. [Google Scholar]
- Rausch T. The estimation of micro-algal protein content and its meaning to the evaluation of algal biomass. I Comparison of methods for extracting protein. Hydrobiologia. 78:237–251. [Google Scholar]
- Raymont Jeg, Morris R J, Ferguson C F, Raymont Jkb. Variation in the amino-acid composition of lipid-free residues of marine animals from the northeast Atlantic. J Exp Mar Biol Ecol. 17:261–267. [Google Scholar]
- Roe Hsj, Badcock J, Billett Dsm, Chidgey K C, Domanski P A, Ellis C J, Fasham Mjr, Gooday A J, Hargreaves Pmd, Huggett Q J, James P T, Kirkpatrick P A, Lampitt R S, Merrett N R, Muirhead A, Pugh P R, Rice A L, Russell R A, Thurston M H, Tyle P A. Great meteor east: a biological characterisation. Wormley, UK): 1987. [Google Scholar]
- Roy R, Pratihary A, Gauns M, Naqvi Swa. Spatial variation of phytoplankton pigments along the southwest coast of India. Estuar Coast Shelf Sci. 69:189–195. [Google Scholar]
- Sawant S, Madhupratap M. Seasonality and composition of phytoplankton in the Arabian Sea. Curr Sci. 71:869–873. [Google Scholar]
- SCOR (1996) JGOFS report no. 19. Protocols for the Joint Global Ocean Flux Study (JGOFS) core measurements. Scientific Committee on Oceanic Research, International Council of Scientific Unions, Bergan, p 170. Bergan; 1996. [Google Scholar]
- Sewell Rbs. The pelagic tunicata. Nat. Hist.) John Murray Exped. 1933-34. Sci Repts. 10:1–90. [Google Scholar]
- Takahashi K, Kuwata A, Sugisaki H, Uchikawa K, Saito H. Downward carbon transport by diel vertical migration of the copepods Metridia pacifica and Metridia okhotensis in the Oyashio region of the western subarctic Pacific Ocean. Deep-Sea Res I. 56:1777–1791. [Google Scholar]
- Thompson H. Pelagic tunicates in Australia. Commonwealth Council for Scientific and Industrial Research; 1948. [Google Scholar]
- Tregouboff G, Rose M. Manuel de planctonologie Mediterranéenne, vol II. Centre National de la Recherche Scientifique, Paris.
- UNESCO (1994) Protocols for the Joint Global Ocean Flux Study (JGOFS) core measurements. Man Guides 29. pp. 1–170.
- Van Heukelem. HPLC phytoplankton pigments: sampling, laboratory methods, and quality assurance procedures. Goddard Space Flight Center. 3:258–268. [Google Scholar]
- Van Soest Rwm. A monograph of the order Pyrosomatida (Tunicata, Thaliacea) J Plankton Res. 3:603–631. [Google Scholar]
- Vaulot D, Partensky F, Neveux J, Mantoura Rfc, Llewellyn C. Winter presence of prochlorophytes in surface waters of the northwestern Mediterranean Sea. Limnol Oceanogr. 35:1156–164. [Google Scholar]
- Verity P G, Villareal T A, Smayda T J. Ecological investigations of blooms of colonial Phaeocystis pouchetii. I. Abundance, biochemical composition, and metabolic rates. J Plankton Res. 10:219–248. [Google Scholar]
- Wiebe P H, Madin L P, Haury L R, Harbison G R, Philbin L M. Diel vertical migration by Salpa aspera and its potential for large-scale particulate organic matter transport to the deep sea. Mar Biol. 53:249–255. [Google Scholar]
- Wishner K F, Gelfman C, Gowing M M, Dawn M O, Rebecca Mary R. Vertical zonation and distributions of calanoid copepods through the lower oxycline of the Arabian Sea oxygen minimum zone. Prog Oceanogr. 78:163–191. [Google Scholar]
Associated Data
This section collects any data citations, data availability statements, or supplementary materials included in this article.
Supplementary Materials
Photograph showing floating Pyrosoma spinosum swarms in the surface waters of station 20. (A) Floating colony; (B) colony caught CTD; (C) colony on deck; (D) closer view of colony under microscope; (E) zooids under bright field; and (F) zooids under dark field.