Abstract
Pediatric renal osteodystrophy is characterized by skeletal mineralization defects but the role of osteoblast and osteocyte maturation in the pathogenesis of these defects is unknown. We evaluated markers of osteocyte maturation (early osteocytes: e11/gp38; mature osteocytes: MEPE) and programmed cell death (TUNEL) in iliac crest of healthy controls and dialysis patients. We evaluated the relationship between numbers of FGF23-expressing osteocytes and histomorphometric parameters of skeletal mineralization. We confirmed that CKD causes intrinsic changes in bone cell maturation using an in vitro model of primary CKD osteoblasts. FGF23 co-localized with e11/gp38, suggesting that FGF23 is a marker of early osteocytes. Increased numbers of early osteocytes and decreased osteocyte apoptosis characterized CKD bone. Numbers of FGF23-expressing osteocytes were highest in patients with preserved skeletal mineralization indices and packets of matrix surrounding FGF23-expressing osteocytes appeared to have entered secondary mineralization. Primary CKD osteoblasts retained impaired maturation and mineralization characteristics in vitro. FGF23 did not affect primary osteoblast mineralization. Thus, CKD is associated with intrinsic changes in osteoblast and osteocyte maturation and FGF23 appears to mark a relatively early stage in osteocyte maturation. Improved control of renal osteodystrophy and of FGF23 excess will require further investigations into the pathogenesis of CKD-mediated osteoblast and osteocyte maturation failure.
Keywords: osteocyte, mineralization, renal osteodystrophy, FGF23, apoptosis
Introduction
Bone deformities, fractures, and poor growth are features of childhood CKD that contribute to significant lifetime morbidity.1,2 The majority of patients who develop kidney disease in childhood have bone disease which persists into adulthood.1 Even children with mild kidney dysfunction—children with normal circulating calcium, phosphorus, and PTH concentrations—have increased fracture rates.3 Defective skeletal mineralization is highly prevalent in these children4 and likely contributes to their skeletal fragility. However, the etiology of these defects remains poorly understood.
Genetically inherited diseases of bone under-mineralization highlight the tight link between bone matrix mineralization and bone cell maturation. Defects in dentin matrix protein 1 (DMP1), an important regulator of osteoblast and osteocyte maturation5, and also of phosphate metabolism6, are associated with concomitant defects in osteocyte maturation and skeletal mineralization.7 The in vitro addition of exogenous phosphate restores normal maturation to calvarial cells from DMP1 null animals8 while augmentation of osteocyte maturation similarly improves bone mineralization in these mice in vivo.7 In contrast to most genetic forms of rickets, the skeletal mineralization defects common to pediatric CKD patients occur in the context of normal to elevated circulating phosphate concentrations.4 Whether impaired osteocyte maturation contributes to skeletal mineralization defects in the CKD population remains unknown.
We and others previously demonstrated that CKD bone is characterized by increased numbers of osteocytes which express the phosphaturic hormone fibroblast growth factor 23 (FGF23).9,10 These FGF23-expressing osteocytes are the primary source of the elevated circulating FGF23 levels10 which contribute to excess cardiovascular and infectious mortality in the CKD population.11–13 Bone at the tissue level appears as a mosaic of individual bone packets, each with specific mineral contents. Youngest bone packets are found only on the periphery of trabecular bone and have generally lower mineral content than older bone packets.14,15 FGF23 expression is uniquely restricted to osteocytes at the trabecular periphery9,10, suggesting that FGF23 expression may be a feature of newly-embedded osteocytes in newly formed bone. Increased numbers of early, FGF23-expressing, osteocytes might result either from an overall increase in osteocyte numbers or from a generalized change in osteocyte maturation characteristics which favors the presence of a relatively young cell phenotype in CKD bone. To investigate whether changes in osteocyte maturation could contribute to excess FGF23 expression and to skeletal mineralization defects, we evaluated numbers of live osteocytes, FGF23 expression, and markers of osteocyte maturation in CKD bone. We further assessed the local mineral content in specific bone packets with or without FGF23 expressing osteocytes. To gather insights into whether increased numbers of early osteocytes are associated with an increase or a decrease in osteocyte turnover, we also evaluated osteocyte apoptosis in these same CKD samples. We then used primary human osteoblasts from pediatric dialysis patients which maintain intrinsic impairments in mineralization when removed from the uremic milieu16 to evaluate whether CKD-mediated skeletal mineralization defects are associated with impaired osteoblast maturation in vitro.
Results
FGF23 is a marker of early osteocytes
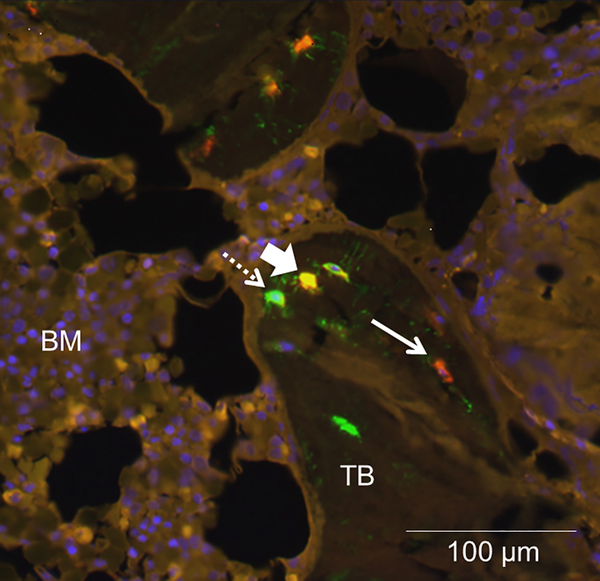
Previous studies have demonstrated that FGF23 is expressed in discrete clusters of osteocytes at the periphery of trabecular bone.9,10 The pattern of FGF23 expression is similar in healthy individuals and in CKD patients; however, increased numbers of FGF23-expressing cells are observed in each cluster in patients with kidney disease.9,10 To evaluate whether this unique expression pattern results from localized expression of FGF23 regulators or whether FGF23 is merely expressed by osteocytes in an early stage of maturation, we performed immunofluorescence on iliac crest samples from adolescent dialysis patients who were not receiving vitamin D sterol therapy. We first evaluated the proximity of FGF23 expression to that of its known negative regulator, dentin matrix protein 1 (DMP1).17 As shown in Figure 1, DMP1 was expressed in osteocytes throughout trabecular bone. Some, but not all, FGF23-expressing osteocytes also expressed DMP1. Not all DMP1-expressing osteocytes co-expressed FGF23.
Figure 1: DMP1 co-localizes with some, but not all, FGF23-expressing osteocytes.
Representative bone section showing immunofluorescence for A) FGF23 (red); DMP1 (green); and their co-expression (yellow). Live nuclei stain blue (DAPI). Solid arrows indicate FGF23 immunoreactivity and dashed arrows signify DMP1 immunoreactivity; arrowheads identify osteocytes with co-expression. TB: trabecular bone; BM: bone marrow. The diffuse, low-intensity marrow auto-fluorescence in each section contrasts with the bright, distinct staining of individual osteocytes in trabecular bone.
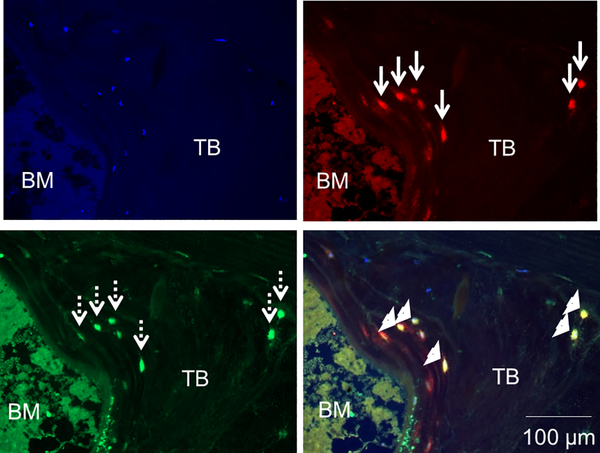
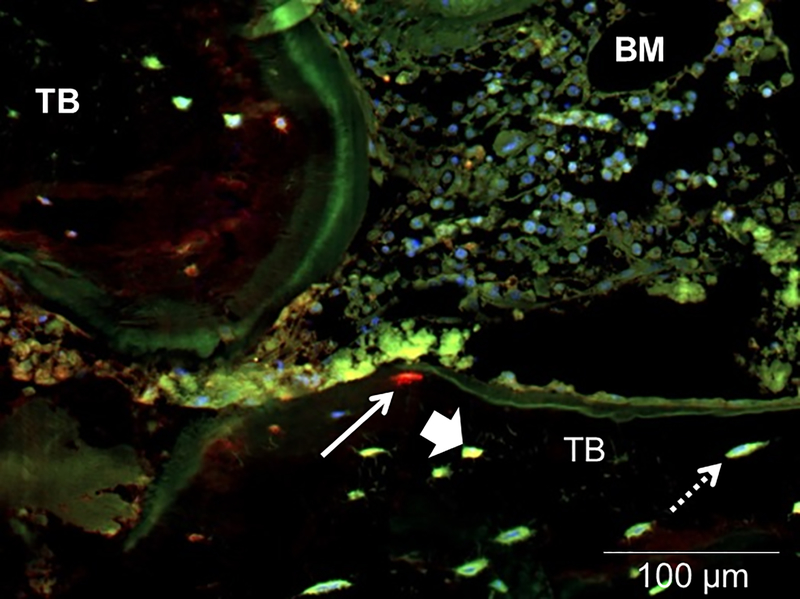
E11/gp38 is the earliest identifiable osteocyte-selective protein in intact bone.18–20 While bone extracts contain high concentrations of e11/gp38, its presence can be detected by immunostaining only in early osteocytes.18 Sclerostin is a marker of the most mature osteocytes in bone. Previous data have demonstrated that sclerostin does not co-localize with FGF23 in adult CKD bone.9,21 However, matrix extracellular phosphoglycoprotein (MEPE), which is a marker of both mineralizing and mature osteocytes18, is expressed throughout trabecular bone.10 Thus, in order to determine whether FGF23 is a marker of an early phase in osteocyte maturation, we evaluated the co-expression of FGF23 with e11/gp38 and MEPE. As shown in Figure 2, e11/gp38 expression mirrored FGF23 expression and the two proteins co-localized. By contrast, MEPE was detected only in the deepest FGF23-expressing osteocytes. The most peripheral FGF23-expressing osteocytes did not co-express MEPE and deeply-embedded MEPE-expressing osteocytes did not co-express FGF23 (Figure 3). These findings suggest that FGF23 is a marker of early osteocytes.
Figure 2: FGF23 is a marker of early, e11/gp38-expressing, osteocytes.
FGF23 (red); the early osteocyte marker e11/gp38 (green); and their co-expression (yellow) in cancellous bone of a pediatric dialysis patient. Live nuclei stain blue (DAPI). Solid arrows indicate FGF23 immunoreactivity and dashed arrows signify e11/gp38 immunoreactivity; arrowheads identify osteocytes with co-expression. TB: trabecular bone; BM: bone marrow. The diffuse, low-intensity marrow auto-fluorescence in each section contrasts with the bright, distinct staining of individual osteocytes in trabecular bone.
Figure 3: FGF23 is not expressed in mature (MEPE-expressing) osteocytes.
FGF23 (red); MEPE (green); and their co-expression (yellow) in cancellous bone of a pediatric dialysis patient. Live nuclei stain blue (DAPI). Solid arrows indicate FGF23 immunoreactivity and dashed arrows signify MEPE immunoreactivity; arrowheads identify osteocytes with co-expression. TB: trabecular bone; BM: bone marrow. The diffuse, low-intensity marrow auto-fluorescence in each section contrasts with the bright, distinct staining of individual osteocytes in trabecular bone.
Osteocyte apoptosis is decreased, but osteocyte numbers are stable, in CKD bone
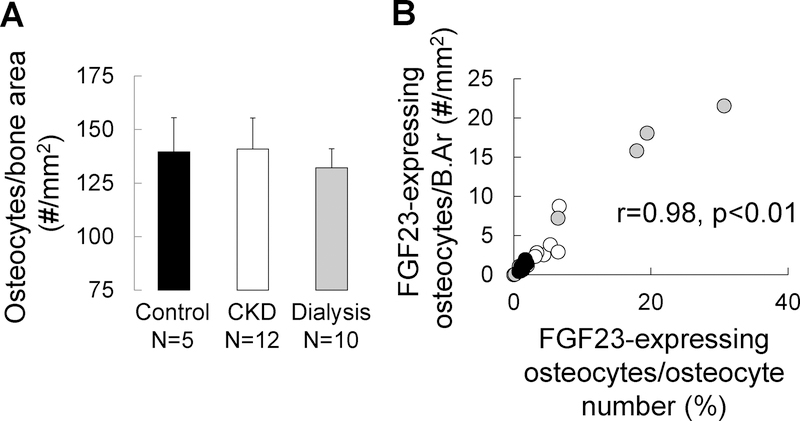
Increased numbers of early osteocytes, in the face of stable overall osteocyte numbers, could reflect either an increase in osteocyte birth rate or a block in osteocyte maturation that prevents early osteocytes from assuming a more mature phenotype. An increase in the creation of early osteocytes, independent of any change in osteocyte maturation or death rate, would increase osteocyte numbers. We thus quantified osteocytes numbers in 5 healthy controls, 12 pre-dialysis CKD patients, and 10 pediatric dialysis patients using DAPI staining. The demographic, biochemical, and bone histomorpometric parameters from these patients are shown in the Supplemental Table. As shown in Figure 4a, osteocyte numbers did not differ between control, pre-dialysis CKD, and dialysis patients; moreover, the proportion of FGF23-expressing osteocytes per bone area correlated with the proportion of FGF23-expressing osteocytes per total osteocyte number (r=0.98, p<0.001) (Figure 4b). Thus, increased numbers of FGF23-expressing osteocytes reflects an increased proportion of early osteocytes in CKD bone.
Figure 4: Osteocyte numbers are stable in CKD bone; increased numbers of FGF23-expressing osteocytes reflect an increased proportion of early osteocytes.
(A) The total number of osteocytes in bone, as determined by the number of osteocytes staining for DAPI normalized by bone area, in trabecular bone of 5 pediatric healthy controls, 12 pediatric pre-dialysis CKD patients, and 10 pediatric dialysis patients not receiving active vitamin D sterol therapy. (B) The relationship between numbers of FGF23-expressing osteocytes expressed as a percentage of total, DAPI-positive, osteocytes (X axis) (FGF23-expressing osteocytes/osteocyte number) and the number of FGF23-expressing osteocytes per trabecular bone area (Y axis) (FGF23-expressing osteocytes/B.Ar). Closed (black) circles show represent healthy controls; open circles represent pre-dialysis CKD patients; closed grey circles represent dialysis patients.
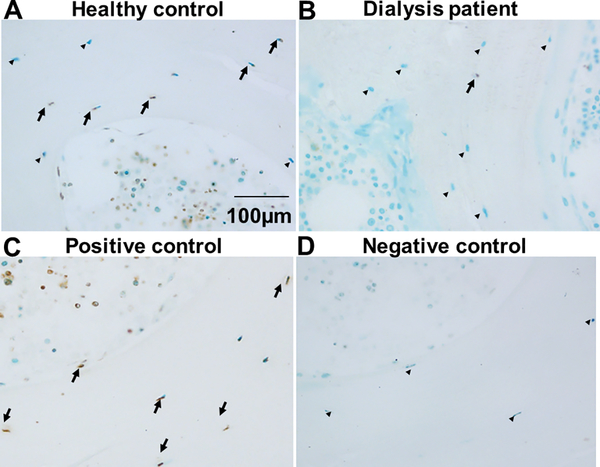
To determine whether the increased proportion of early osteocytes reflects an increase in osteocyte turnover, we next evaluated osteocyte apoptosis using terminal deoxynucleotidyl transferase dUTP nick end labeling (TUNEL) in trabecular bone. As shown in Figure 5, apoptosis was detected in both osteocytes and bone marrow cells of healthy control subjects. However, osteocyte and bone marrow apoptosis were decreased in dialysis patient bone. Since CKD does not accelerate osteocyte loss, increased numbers of FGF23-expressing osteocytes in CKD bone appears to reflect stalled osteocyte maturation.
Figure 5: Osteocyte apoptosis is decreased in CKD bone.
TUNEL staining of iliac crest trabecular bone from (A) a healthy pediatric control subject and (B) a pediatric dialysis patient. A positive control (trabecular bone treated with DNase1) is shown in (C). A negative control, obtained by omitting Klenow from the reaction, is shown in (D). Brown stain indicates positive TUNEL staining (arrows); green stain indicates viable cells. Viable osteocytes are denoted by arrowheads.
Increased numbers of FGF23-expressing osteocytes mark packets of bone in early stages of secondary mineralization
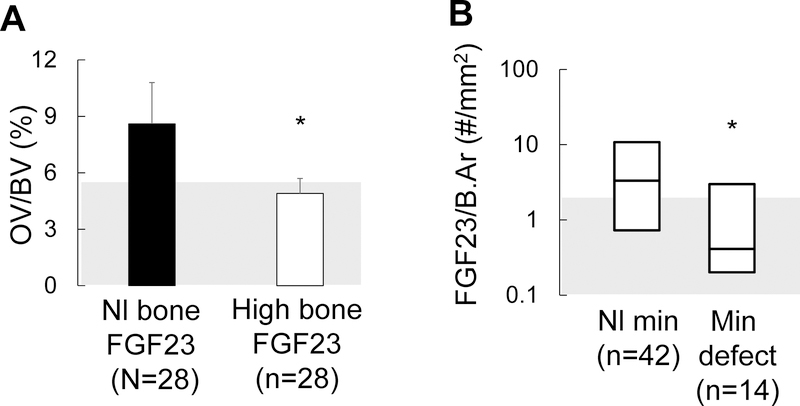
We and others have previously reported a correlation between circulating FGF23 levels23,24, numbers of FGF23-expressing osteocytes10, and skeletal mineralization indices in CKD bone. In order to evaluate the hypothesis that a high proportion of early-stage, FGF23-expressing, osteocytes is an indication of well-mineralized bone, we evaluated the relationship between numbers of FGF23-expressing osteocytes and the presence of a mineralization defect in a cohort of 58 pediatric dialysis patients not receiving vitamin D sterol therapy. The biochemical and histomorphometric parameters of these patients are shown in Table 1. As shown in Figure 6a, osteoid volume was markedly increased (p<0.05 from the normal range) in patients with normal numbers of FGF23-expressing osteocytes but was normal in patients with increased numbers FGF23-expressing osteocytes (NS from normal range; p<0.05 from patients with normal numbers of FGF23-expressing osteocytes). We subsequently divided patients based on the presence or absence of a true mineralization defect, defined by an increase in osteoid volume combined with a prolonged osteoid maturation time. As shown in Figure 6b, numbers of FGF23-expressing osteocytes were higher in CKD patients with normal skeletal mineralization indices (n=42) as compared to those with defective skeletal mineralization (n=14). Serum calcium, phosphorus, and PTH levels did not differ in patients with normal versus those with increased numbers of FGF23-expressing, osteocytes. Calcium, phosphorus, and PTH did predict numbers of FGF23-expressing osteocytes in multivariable analysis.
Table 1:
Biochemical values and trabecular bone histomorphometric indices of turnover, mineralization, and volume in a cross-section of 56 dialysis patients, not receiving active vitamin D sterol therapy, whose bone biopsy samples were evaluated for FGF23 staining.
| Normal numbers of FGF23-expressing osteocytes (n=28) | Increased numbers of FGF23-expressing osteocytes (n=28) | Normal Range* | |
|---|---|---|---|
| Demographic Data | |||
| Age (years) | 15.8 ± 0.8 | 15.8 ± 1.0 | NA |
| Gender (M/F) | 22/6 | 20/8 | NA |
| Cause of kidney disease (n) (CAKUT/glomerular disease/unknown) | 7/13/8 | 10/11/7 | NA |
| Biochemical Values | |||
| Calcium (mg/dl) | 9.0 ± 0.2 | 8.9 ± 0.3 | 8.4 – 10.2 |
| Phosphorus (mg/dl) | 5.7 ± 0.3 | 6.1 ± 0.3 | (age specific) |
| PTH¥ (pg/ml) | 457 (238, 873) | 407 (123, 741) | 10 – 65 |
| FGF23¥¥ (RU/ml) | 1147 (705, 1989) | 1989 (476, 9351)** | <100 |
| Trabecular Bone Turnover | |||
| Bone formation rate (BFR/BS) (μm3/mm2/yr) | 47.7 (30.0, 67.7) | 42.0 (10.4, 75.2) | 8.0 – 73.4 |
| Trabecular Bone Mineralization | |||
| Osteoid surface (OS/BS) (%) | 40.0 ± 2.6 | 33.6 ± 3.0 | 4.3 – 31.7 |
| Osteoid volume (OV/BV) (%) | 8.8 ± 2.3 | 5.2 ± 0.7 | 0.2 – 5.8 |
| Osteoid thickness (O.Th) (μm) | 12.2 ± 0.7 | 9.1 ± 0.6** | 2.0 – 13.2 |
| Osteoid maturation time (OMT) (d) | 13.7 (11.5, 19.9) | 9.1 (7.7, 16.5) | 1.2 – 11.5 |
| Mineralization lag time (MLT) (d) | 28.5 (20.9, 104.7) | 28.6 (16.3, 54.9) | 2.3 – 63.8 |
| Trabecular Bone Volume | |||
| Bone volume (BV/TV) (%) | 35.1 ± 2.1 | 30.4 ± 1.3 | 8.9 – 34.4 |
normal range for bone histomorphometric variables from n=31 healthy controls as previously reported (Bakkaloglu SA 2010 Clin J Am Soc Nephrol 5:1860–1866)
NA: not applicable
p<0.05 between groups
PTH: 1st generation immunometric assay (Quidel Corporation, San Diego, California), which detects full-length PTH as well as large C-terminal fragments (normal range: 10–65 pg/ml)
C-terminal FGF23: 2nd generation C-terminal FGF23 assay (Quidel), which detects both the full-length and C-terminal portions of the molecule in circulation
Figure 6: High numbers of early osteocytes are associated with preserved mineralization in CKD bone.
(A) Osteoid volume (displayed as mean ± standard error) in 28 pediatric dialysis patients with normal numbers of early (FGF23-expressing) osteocytes (“Nl bone FGF23”) as compared to values in 28 pediatric dialysis patients with numbers of FGF23-expressing osteocytes above the upper range of normal (“High bone FGF23”). (B) Number of FGF23-expressing osteocytes (FGF/B.Ar) in 42 pediatric dialysis patients with normal mineralization parameters on bone histomorphometry (Nl min) as compared to numbers of FGF23-expressing osteocytes in 14 pediatric dialysis patients with a mineralization defect (min defect). The asterisk indicates a significant (p<0.05) difference between groups. Grey shading in each panel represents the normal range.
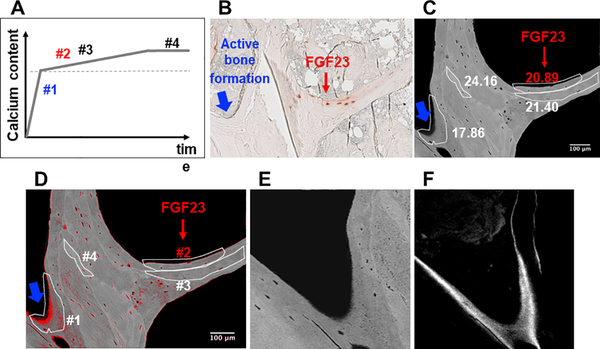
To verify that the presence of FGF23-expressing osteocytes associates with improved quality of matrix mineralization in CKD bone, we evaluated calcium content by quantitative backscatter electron imaging (qBEI) in 4 biopsy samples (Figure 7). Specific bone packets with or without FGF23-expressing osteocytes, mapped by comparison with images obtained by immunohistochemistry, were identified on the backscattered electron image (Figure 7b). As shown in Figure 7c, bone packets at the trabecular periphery with the lowest mineral content (weight % calcium (Ca) below 18) did not contain FGF23-expressing osteocytes (bone packet #1 in Figures 7b, 7c, and 7d). These areas demonstrated evidence of ongoing bone formation (Figures 7e and 7f). Bone packets which contained FGF23-expressing osteocytes demonstrated distinctly higher mineral content (weight % calcium 20.89); no ongoing bone formation was observed in these areas. These findings suggested that FGF23-expressing osteocytes are confined to packets of bone that have completed primary mineralization.
Figure 7: FGF23 expression is a feature of osteocytes in bone packets of early secondary mineralization.
(A) Schematic depiction of phases of mineral accumulation in newly formed bone packets. The dotted line marks the transition between primary and secondary mineralization. (B) Trabecular bone section demonstrating immunohistochemical staining for FGF23. The red arrow points to area of bone with a cluster of FGF23 expressing osteocytes; the blue arrow points to an area of peripheral bone with active bone formation. (C) Backscattered electron image of bone core adjacent to the FGF23-stained section shown in (B). Heterogeneously mineralized bone matrix is observed with dark gray areas corresponding to low and bright gray to high mineral contents. Bone packets are circled in white; calcium content of each (weight % Ca) is written adjacent to each circumscribed packet. Red font is used to indicate weight % Ca of the FGF23-containing packet. (D) Image (C) with red pixels depicting areas of bone with mineral content below 16 weight % calcium and with bone packets numbered to correspond to mineral accumulation phases depicted in (A). (E) An enlarged image of bone packet #1 (i.e. an area of active bone formation). (F) Confocal laser scanning microscopic fluorescence image from the area of bone packet #1 demonstrating tetracycline incorporation at the mineralization front.
A model of primary CKD osteoblasts confirms that CKD results in intrinsic defects in maturation of cells of the osteoblast/osteocyte lineage
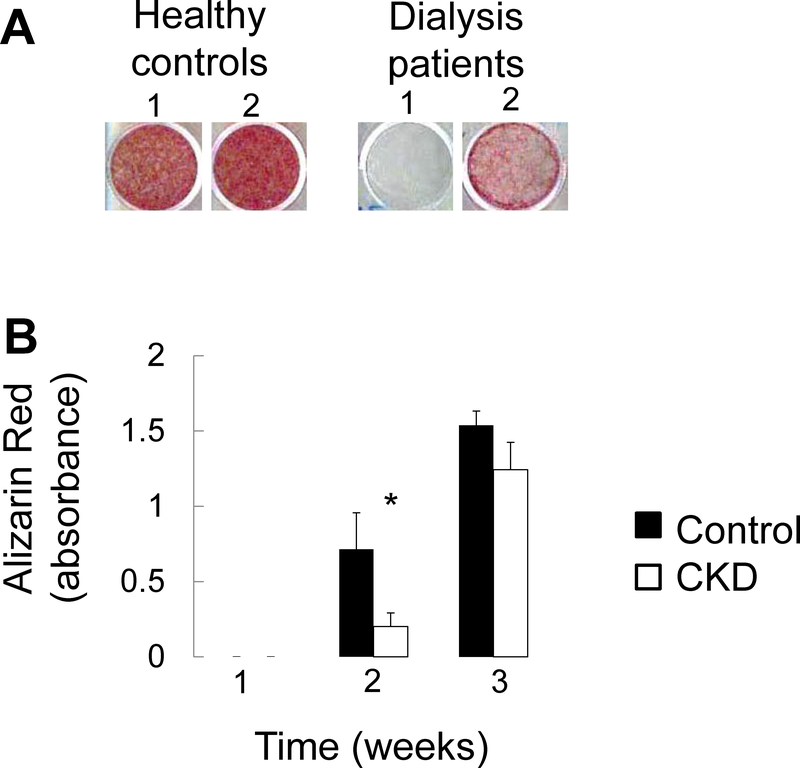
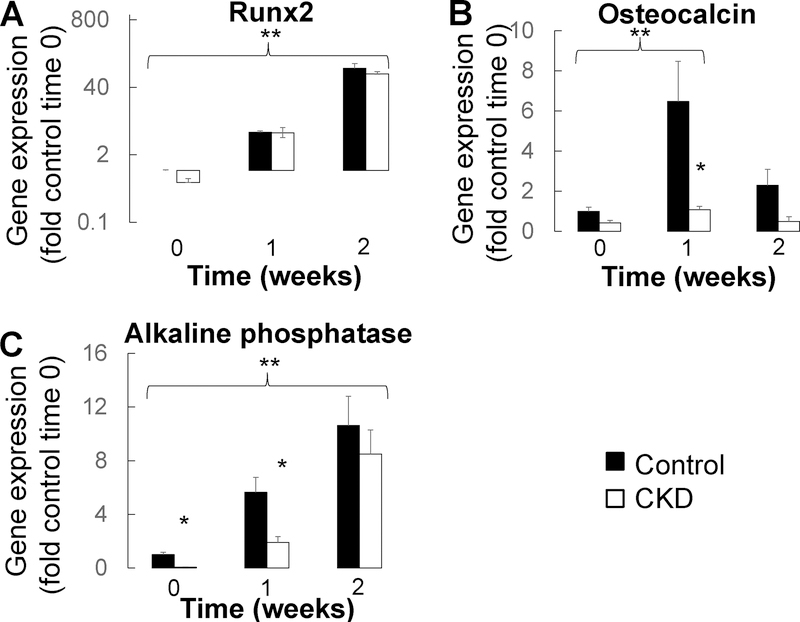
We have previously shown that primary CKD osteoblasts removed from the uremic milieu are highly proliferative, mineralize slowly, and have increased expression of the early osteoblast markers.15 To evaluate whether these previously reported features represent an intrinsic, CKD-mediated, delay in osteoblast maturation, we evaluated expression of osteoblast maturation markers throughout the course of mineralization in primary osteoblasts from 6 pediatric dialysis patients and 3 healthy controls. As previously reported16, CKD osteoblasts mineralized at a slower rate than did their healthy control counterparts (Figure 8a and 8b). Expression of the osteoprogenitor marker Runx2 (RUNX) increased with time (Figure 9a) (p<0.05 in both control and CKD osteoblasts at both 1 and 2 weeks from baseline). By contrast, expression of both osteocalcin (BGLAP) and alkaline phosphatase (ALPL) were lower in CKD than in control osteoblasts at baseline (p<0.05 between CKD and control osteoblasts at baseline). Osteocalcin and alkaline phosphatase expression remained lower in CKD osteoblasts after 1 week under pro-mineralizing conditions (p<0.05 between CKD and control osteoblasts for both genes at 1 week) (Figure 9b and 9c). The lower expression of these more mature osteoblast markers suggest impaired mineralization is associated with impaired maturation of CKD osteoblasts.
Figure 8: Mineralization of primary CKD osteoblasts is impaired in vitro.
(A) Alizarin red S staining of primary osteoblasts from 2 separate representative healthy controls and 2 separate representative dialysis patients grown to confluence and then cultured under standard pro-mineralizing conditions for 2 weeks. (B) Quantification of extracted Alizarin Red S dye from healthy control and pediatric dialysis patient primary osteoblasts grown to confluence and cultured under standard pro-mineralizing conditions for 3 weeks. Values represent the mean ± standard error values for the 3 controls and 6 patients. The asterisk indicates a between-group difference in mineral accumulation at 2 weeks in culture.
Figure 9: Impaired osteoblast maturation co-occurs with mineralization failure of primary CKD osteoblasts in vitro.
Changes in (A) Runx2, (B) osteocalcin, and (C) alkaline phosphatase gene expression in confluent osteoblasts cultured under standard pro-mineralizing conditions. Values represent fold of control cell expression at baseline. The asterisk indicates a difference (p<0.05) between control and dialysis patient osteoblasts; the double asterisk indicates an increased in gene expression (p<0.05) for both control and dialysis patients osteoblasts over time.
Exogenous FGF23 does not alter primary osteoblast maturation but does prevent phosphate-induced osteocyte apoptosis in vitro
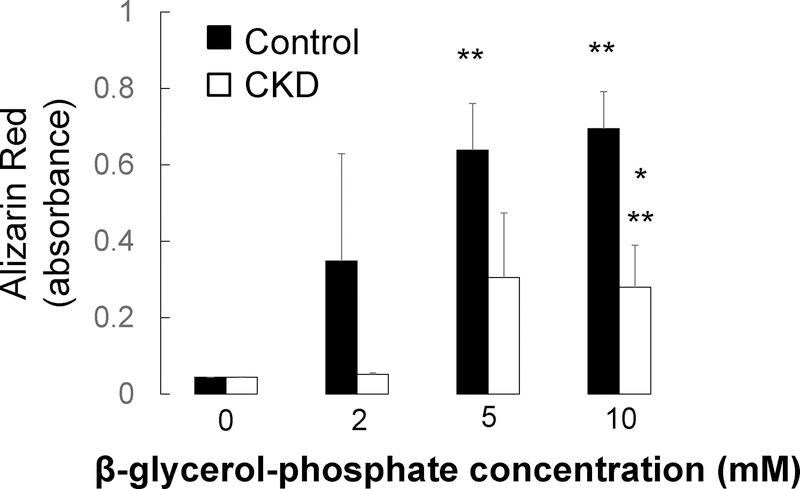
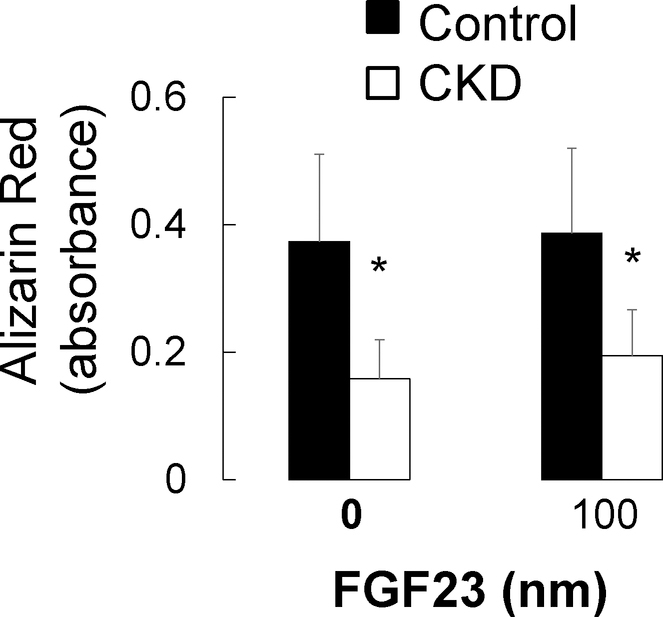
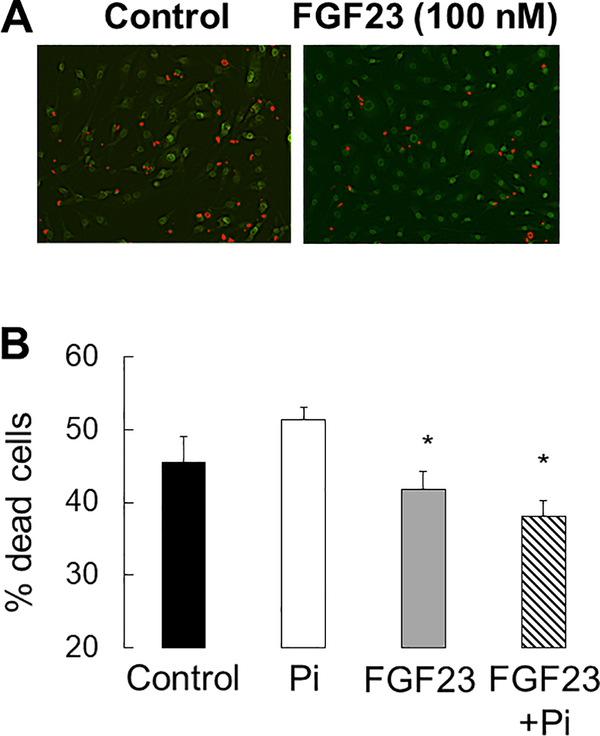
Osteoblast and osteocyte differentiation, as well as extracellular matrix mineralization, are phosphate-dependent processes8 and high concentrations of phosphate have been associated with increased osteocyte apoptosis in vivo.24 To evaluate the local effect of FGF23 on osteoblast maturation and osteocyte apoptosis, we cultured primary CKD and control osteoblasts and immortalized murine long bone osteocyte (MLO-Y4) cells with varying concentrations of phosphate and FGF23. As shown in Figure 10, phosphate stimulated mineralization of cultured osteoblasts. FGF23 had no effect on osteoblast maturation (Figure 11) but decreased the number of dead and apoptotic MLO-Y4 cells cultured for 48 hours in culture in high phosphate conditions (Figure 12a and 12b). Thus, FGF23 does not appear to affect their maturation and/or mineralization but may play a role in counteracting phosphate-induced apoptosis in mature osteocytes.
Figure 10: Phosphate increases primary osteoblast mineralization in vitro.
Quantification of extracted Alizarin Red S dye from healthy control (closed bars) and pediatric dialysis patient (open bars) primary osteoblasts grown to confluence and cultured under standard pro-mineralizing conditions in varying concentrations of β-glycerol-phosphate for 2 weeks. Values represent the mean ± standard error values for the 3 controls and 6 patients. The asterisk indicates a between-group difference in mineral accumulation; the double asterisk indicates a difference from the no added β-glycerol-phosphate condition.
Figure 11: Exogenous FGF23 does not alter primary osteoblast mineralization in vitro.
Quantification of extracted Alizarin Red S dye from healthy control (closed bars) and pediatric dialysis patient (open bars) primary osteoblasts grown to confluence and cultured under standard pro-mineralizing conditions in the presence or absence of exogenous human FGF23 for 2 weeks. Values represent the mean ± standard error values for the 3 controls and 6 patients. The asterisk indicates a between-group difference in mineral accumulation.
Figure 12: FGF23 decreases osteocyte apoptosis in vitro.
A) Ethidium bromide (Et.Br)/acridine orange (Ac.O) staining of serum deprived MLO-Y4 cells after 48 hours in 100 nM FGF23. B) The percentage of dead cells, as defined by the percentage of cells staining with Et.Br (orange) relative to the total number of live cells staining with Ac.O (green), after 48 hours in culture under control (3mM phosphate) and high phosphate (10mM phosphate) conditions with varying (0 and 100 ng/mL) FGF23 concentrations. Values represent the average ± standard error for n=8 replicates. The asterisk indicates a difference (p<0.01) from cells treated with 10 mM Pi.
Discussion
Increased numbers of FGF23-expressing osteocytes are present in trabecular bone9,10, contributing to increased circulating FGF23 levels in CKD patients.10 Here we show that FGF23 is a marker of an early phase in osteocyte maturation. Increased numbers of early, FGF23-expressing osteocytes combined with a visible decrease in osteocyte apoptosis, suggest that stagnant osteocyte maturation may contribute to skeletal pathology and circulating FGF23 excess in this population.
Clinical bone disease—including increased fracture rates—is present in patients with all CKD stages3 and skeletal mineralization defects can be identified in as many as 40% of children and adults4 with even mild kidney dysfunction. In contrast to most forms of rickets in which low serum calcium and/or phosphate concentrations contribute to impaired osteoblast and osteocyte maturation7,8, the skeletal mineralization defects associated with CKD occur in the face of adequate amounts of circulating calcium and phosphorus. In the current study, we show that CKD is associated with a decrease in osteocyte apoptosis. Despite this decrease, numbers of osteocytes in trabecular bone are stable, suggesting that osteocyte maturation is impaired. As we have previously shown, primary osteoblasts from CKD patients have a hyper-proliferative phenotype with impaired mineralization characteristics ex vivo and here we demonstrate that this phenotype is associated with a sluggish increase in alkaline phosphatase and osteocalcin expression under pro-mineralizing conditions. It thus appears that maturation impairments afflict cells throughout the osteoblast/osteocyte lineage and likely contribute to bone mineralization impairments in CKD. The etiology of this CKD-mediated delay in maturation remains unknown; however, its presence is consistent across CKD etiologies from CAKUT to inflammatory disease, is independent of underlying bone histology, and is independent of underlying bone FGF23 expression. Thus, the presence of CKD itself, and not underlying CKD etiology or bone histology, appears to cause changes to the maturation characteristics of cells of the osteoblast lineage.
Elevated circulating FGF23 levels, coming from osteocytes in bone10, contribute to cardiovascular and infectious morbidity and mortality in the CKD population11,12 but the local implications of increased bone FGF23 expression in CKD remain poorly defined. Our current findings suggest that FGF23 does not affect maturation and mineralization of primary human osteoblasts but may protect osteocytes from phosphate-induced apoptosis. Since adjacent bone marrow cells also appear to be protected from apoptosis in CKD bone, increased bone FGF23 expression may represent a local, paracrine, response that protects CKD bone from the pro-apoptotic effects of hyperphosphatemia.24
Since excess circulating levels of FGF23 contribute to osteomalacia in patients with normal kidney function25, it is tempting to ascribe the pathogenesis of defective skeletal mineralization in CKD directly to increased bone FGF23 expression. However, FGF23 excess is associated with hypophosphatemia in patients with normal kidney function25 but not in CKD patients with kidney disease and there are few data supporting a direct link between bone FGF23 expression and skeletal mineralization defects in the CKD population. The current data demonstrate that bone mineralization is preserved in patients with robust numbers (i.e. above the range found in healthy controls) of FGF23-expressing, osteocytes. This finding appears to reflect the time course of FGF23 expression relative to matrix mineralization. Indeed, the mineral content of newly-formed osteoid increases within a few days to about 18 weight % calcium. After this phase of primary mineralization, mineral accumulation slows and a fully mineralized matrix is achieved over months to years (secondary mineralization).14,15 In the current study, signs of ongoing bone formation were observed in peripheral bone matrix containing the lowest mineral content. This presumably earliest, and least mineralized, bone matrix contained no FGF23-expressing osteocytes. The co-localization of FGF23 with the early osteocyte marker e11/gp38, the higher mineral content of bone packets containing FGF23-expressing osteocytes, and the lack of FGF23 expression in deep bone matrix, together suggest that FGF23 expression is confined to osteocytes in a relatively early maturation stage—osteocytes in matrix which has completed primary mineralization and has just entered secondary mineralization.
Increased bone FGF23 expression contributes to elevated circulating FGF23 concentrations in CKD patients;10 how much of the increase in bone FGF23 expression is due to increased per-osteocyte expression and how much is due to increased numbers of early osteocytes constitutively expressing the hormone remains an open question. Many stimuli for FGF23 expression, including hyperphosphatemia26, vitamin D sterol use27, inflammation28 and iron deficiency29 are present in patients treated with maintenance dialysis. However, it is interesting to note that numbers of FGF23-expressing osteocytes have been shown to correlate closely with circulating FGF23 levels in dialysis patients,10 suggesting that much of the variation in circulating FGF23 levels in dialysis patients results from differences in numbers of early osteocytes between patients, rather than from hyper-stimulation of individual osteocytes.
The current study was performed on tissue and cells obtained from young patients. Increased numbers of FGF23-expressing osteocytes have similarly been observed in adult pre-dialysis CKD and dialysis patients9,10 and some data suggest that mineralization defects are also prevalent in adult CKD patients.9 However, other data suggest that mineralization defects are rare in adults;30 thus, the interactions between CKD-mediated osteocyte maturation impairment, numbers of early osteocytes, and bone mineralization outside the pediatric age range warrant further investigation. Moreover, the maturation and mineralization characteristics of primary osteoblasts from a limited number of patients were evaluated in the current study. While these samples were chosen to represent the spectrum of renal osteodystrophy, evaluation of a larger number of samples will be useful in future to confirm the generalizability of these findings.
In conclusion, stagnant osteoblast and osteocyte maturation are features of CKD bone which likely contribute to skeletal morbidity in this population. Increased numbers of FGF23-expressing osteocytes reflect an increased proportion of early osteocytes in CKD bone. The ability to maintain increased numbers of early, FGF23-expressing osteocytes may herald a protective response to the uremic milieu, preserving bone mineralization and protecting osteocytes from the toxic effects of phosphate excess. Increased circulating FGF23 levels, coming from bone, trigger the development of secondary hyperparathyroidism31, contribute to cardiovascular disease12, impair immunity11 and are associated with early mortality.32 Improved management of CKD-associated bone disease and CKD-related mortality may thus require therapies targeted at improving osteoblast and osteocyte maturation in patients with all CKD stages.
Materials and Methods
Patients
Bone biopsy specimens from 68 CKD patients, ages 2–25 years, and from 5 controls were included in this study. Twelve of the patients had stable CKD stages 2–4 and 56 had stable (>6 months) CKD stage 5 and were treated with maintenance dialysis (“dialysis patients”). All underwent bone biopsy as part of clinical studies characterizing the spectrum of bone disease across CKD stages.4,27
Characterization of bone histomorphometry, immunohistochemistry, apoptosis, and matrix mineralization
Histomorphometric analysis was performed in un-decalcified bone from all pediatric CKD patients and healthy controls using the OsteometricsR system as previously described.33 Standard measures of bone turnover, mineralization, and volume were measured and calculated.34 Mineralization defects were defined by concomitant increases in osteoid accumulation (osteoid volume/bone volume>5.8%) and prolongations in mineralization rate (osteoid maturation time>11.5 days).
Immunohistochemistry was performed to assess bone FGF23 expression in un-decalcified sections of iliac crest from 56 pediatric patients with end-stage kidney disease treated with maintenance dialysis, 12 pre-dialysis CKD patients, and 5 healthy controls. Immunofluorescence was performed on samples from 4 of these dialysis patients. The technique for immunohistochemical detection and quantification of protein expression was previously reported.10 In brief, 5 μm sections of bone were de-plasticized, rehydrated, and partially decalcified. Sections were incubated with affinity purified polyclonal goat anti-human FGF23(225–244) (Qidel, San Diego, CA) monoclonal primary antibody overnight at 4°C in a humidified chamber. Samples were then incubated with biotinylated horse anti-goat secondary antibody (Vector, Burlingame, CA) followed by ABComplex/HRP complex (Vector), and developed using AEC kit (Vector) and counterstained with Mayer hematoxylin (Sigma-Aldrich, St Louis, MO). Numbers of FGF23-expressing osteocytes were counted and normalized to total tissue area.10 Anti-human FGF23, anti-human MEPE (LFMb33)(42–525) (kindly provided by Dr. Larry Fisher, National Institutes of Health, DC), monoclonal mouse anti-human DMP1 (LFMb31)(62–513) (Dr. Larry Fisher) and monoclonal mouse anti-human e11/gp38 (sc-59347, Santa Cruz Biotechnology, Dallas, TX) primary antibodies were used for immune-co-localization with Alexa Fluor conjugated anti-mouse, anti-rabbit, and anti-goat (Invitrogen, Carlsbad, CA) secondary antibodies. DAPI staining was used to assess numbers of live osteocytes in trabecular bone.
Apoptosis in non-decalcified bone sections was assessed via in situ TUNEL reaction in iliac crest samples from 5 healthy controls and 10 pediatric dialysis patients using Klenow terminal deoxynucleotidyl transferase per manufacturer’s instructions (Oncogene Research Products, La Jolla, CA). Positive staining was detected by peroxidase streptavidin conjugated and 3,3’diaminobenzidine. Sections were counter-stained with methyl green. Sections incubated with vehicle alone served as negative controls and a positive control was generated by treating one of the samples with DNAse I.
Matrix mineralization was assessed by qBEI in a subset of 4 bone biopsy samples from adolescent dialysis patients. The procedure for qBEI has been previously described.35 In brief, the surface of the residual sample block was prepared polishing to obtain a smooth surface as close as possible to the section previously removed for FGF23 immunohistochemical staining. Subsequently, the sample was coated with a thin carbon layer by vacuum evaporation. qBEI was performed on a digital scanning electron microscope equipped with a four-quadrant semiconductor BE detector (Zeiss Supra 40, Oberkochen Germany). The entire cross-sectioned bone sample area was scanned and a mapped for calcium (Ca) content with a spatial resolution of 1.8 μm/pixel. Within the resulting image, bone packets were selected according to the site of trabecular tissue (periphery, adjacent deeper packets, and deep interstitial bone) and the presence or lack of FGF23-expressing osteocytes in the adjacent histological section. The mean calcium content (weight % Ca) was calculated per bone packet.
Primary osteoblast maturation and mineralization potential and gene analysis
Primary osteoblasts were obtained at the time of bone biopsy as previously described.16 Osteoblasts from 6 adolescent CKD patients and from 3 healthy adolescent controls were used for these experiments. All CKD patients were treated with maintenance dialysis and end stage kidney disease was due to congenital anomalies of the kidneys and urinary tract (n=3) and glomerulonephritis (n=3). Bone FGF23 expression was within the range observed in healthy controls in 2 patients, above the normal range in 2 patients, and markedly increased from control values in 2 patients. Bone turnover (as defined by bone histomorphometry) was high in 3 patients and low in the other 3. Bone and cells from healthy adolescent controls were obtained at the time of surgery for idiopathic scoliosis or for maxillofacial surgery requiring grafting. Mineralization potential was assessed in primary osteoblasts plated in 12 well plates at equal density (1 × 10⁴ cells per well). Primary osteoblasts were grown to confluence in the presence of DMEM, 10% fetal bovine serum, and 100 μg/ml ascorbic acid and then stimulated to mineralize by adding 10 mM β-glycero-phosphate and 10−8 M dexamethasone and varying (0 mM, 2 mM, 5mM, and 10 mM) concentrations of β-glycero-phosphate or recombinant human FGF23 (0 and 100 ng/mL) (R&D Systems, Minneapolis, MN). Mineralization was quantified by staining cultures at weekly intervals with 1% (w/v) solution of Alizarin red S (pH 6.4) (Sigma-Aldrich, St. Louis MO). Dye was extracted from the cell layer and the supernatant was analyzed at 490 nm. The coefficient of variation between technical replicates was less than 6%.
RNA was isolated from parallel cultures and quantitative real-time PCR amplification was performed using QuaniTect ® Probe PCR kit (Qiagen, Hilden, Germany). Taqman assays were used to quantify the expression of osteocalcin (BGLAP), Runx2 (RUNX), and alkaline phosphatase (ALPL), along with the housekeeping gene GAPDH. Relative quantification studies of threshold cycle were performed with Sequence Detector software (Applied Biosystems, Foster City, CA). Samples from each individual patient were assayed in triplicate at each time point; the coefficient of variation between these technical replicates was less than 4% for each gene at each time point.
In vitro evaluation of osteocyte apoptosis
The effects of phosphate and FGF23 on osteocyte apoptosis were evaluated in immortalized murine osteocytes (MLO-Y4) which were cultured to 80% confluence. After overnight serum deprivation, cells were cultured in either normal (3 mM phosphate) or phosphate enriched (10 mM phosphate) media in the presence or absence of FGF23 (100 ng/ml). Apoptosis was assessed visually under fluorescent microscopy (510/540 nm excitation filters) by acridine orange/ethidium bromide with trypan blue exclusion staining at 24 hours. Using this technique, live cells appear uniformly green; early apoptotic cells stain green and contain bright green nuclear dots (indicating chromatin condensation and nuclear fragmentation); and late apoptotic cells stain orange and also display bright green nuclear dots.
Statistical analysis
Measurements are reported as mean ± standard error or median (interquartile range), or percentage ± standard error of normal values. The Student’s T-test and the Wilcoxon Signed Rank test were used to assess between-group differences. The Pearson correlation coefficient was used to assess the relationship between FGF23 measurements normalized to bone area and those normalized to osteocyte number. Multiple linear regression was performed to assess the contribution of biochemical and bone histomorphemetric variables to numbers of FGF23-expressing osteocytes. All statistical analyses were performed using SAS software (SAS Institute Inc.) and all tests were two-sided. A probability of type I error less than 5% was considered statistically significant and ordinary p values are reported.
Supplementary Material
Acknowledgements
The authors would like to thank Preethi Vijayaraj, PhD for help with image acquisition, Kathleen Noche for help in preparing solutions and samples, and Sonja Lueger, Petra Keplinger and Phaedra Messmer for sample preparation for qBEI measurements.
Sources of support: This study was supported by USPHS grants (DK-35423, DK-67563, MO1-RR00865, DK080984 and DK098627), the American Society of Nephrology, the Children’s Discovery and Innovation Institute at the David Geffen School of Medicine, and the Casey Lee Ball foundation, by the AUVA (research funds of the Austrian workers compensation board) and the WGKK (Viennese sickness insurance funds).
Footnotes
Disclosure
None of the authors has a relationship with any company that might have financial interest in the information contained in this manuscript.
References
- 1.Groothoff J, Offringa M, Van Eck-Smit B, Gruppen M, Van De Kar N, Wolff E, Lilien M, Davin J, Heymans H, and Dekker F (2003) Severe bone disease and low bone mineral density after juvenile renal failure. Kidney Int 63, 266–275 [DOI] [PubMed] [Google Scholar]
- 2.(2008) North American Pediatric Renal Transplant Cooperative Study (NAPRTCS) 2008 Annual Report.
- 3.Denburg M, Kumar J, Jemielita T, Brooks E, Skversky A, Portale A, Salusky I, Warady B, Furth S, and Leonard M (2016) Fracture Burden and Risk Factors in Childhood CKD: Results from the CKiD Cohort Study. J Am Soc Nephrol 27, 543–550 [DOI] [PMC free article] [PubMed] [Google Scholar]
- 4.Wesseling-Perry K, Pereira R, Tseng C, Elashoff R, Zaritsky J, Yadin O, Sahney S, Gales B, Jüppner H, and Salusky I (2012) Early skeletal and biochemical alterations in pediatric chronic kidney disease. Clin J Am Soc Nephrol 7, 146–152 [DOI] [PMC free article] [PubMed] [Google Scholar]
- 5.Lu Y, Yuan B, Qin C, Cao Z, Xie Y, Dallas S, McKee M, Drezner M, Bonewald L, and Feng J (2011) The biological function of DMP-1 in osteocyte maturation is mediated by its 57-kDa C-terminal fragment. J Bone Miner Res 26, 331–340 [DOI] [PMC free article] [PubMed] [Google Scholar]
- 6.Feng J, Ward L, Liu S, Lu Y, Xie Y, Yuan B, Yu X, Rauch F, Davis S, Zhang S, Rios H, Drezner M, Quarles L, Bonewald L, and White K (2006) Loss of DMP1 causes rickets and osteomalacia and identifies a role for osteocytes in mineral metabolism. Nat Genet 38, 1310–1315 [DOI] [PMC free article] [PubMed] [Google Scholar]
- 7.Ren Y, Han X, Jing Y, Yuan B, Ke H, Liu M, and Feng J (2016) Sclerostin antibody (Scl-Ab) improves osteomalacia phenotype in dentin matrix protein 1(Dmp1) knockout mice with little impact on serum levels of phosphorus and FGF23. Matrix Biol 52–54, 151–161 [DOI] [PMC free article] [PubMed] [Google Scholar]
- 8.Zhang R, Lu Y, Ye L, Yuan B, Yu S, Qin C, Xie Y, Gao T, Drezner M, Bonewald L, and Feng J (2011) Unique roles of phosphorus in endochondral bone formation and osteocyte maturation. J Bone Miner Res 26, 1047–1056 [DOI] [PMC free article] [PubMed] [Google Scholar]
- 9.Graciolli F, Neves K, Barreto F, Barreto D, Dos Reis L, Canziani M, Sabbagh Y, Carvalho A, Jorgetti V, Elias R, Schiavi S, and Moyses R (2017) The complexity of chronic kidney disease-mineral and bone disorder across stages of chronic kidney disease. Kidney Int 91, 1436–1446 [DOI] [PubMed] [Google Scholar]
- 10.Pereira R, Jűppner H, Azucena-Serrano C, Yadin O, Salusky I, and Wesseling-Perry K (2009) Patterns of FGF-23, DMP1, and MEPE expression in patients with chronic kidney disease. Bone 45, 1161–1168 [DOI] [PMC free article] [PubMed] [Google Scholar]
- 11.Rossaint J, Oehmichen J, Van Aken H, Reuter S, Pavenstadt H, Meersch M, Unruh M, and Zarbock A (2016) FGF23 signaling impairs neutrophil recruitment and host defense during CKD. J Clin Invest 126, 962–974 [DOI] [PMC free article] [PubMed] [Google Scholar]
- 12.Faul C, Amaral A, Oskouei B, Hu M, Sloan A, Isakova T, Gutierrez O, Aguillon-Prada R, Lincoln J, Hare J, Mundel P, Morales A, Scialla J, Fischer M, Soliman E, Chen J, Go A, Rosas S, Nessel L, Townsend R, Feldman H, St John Sutton M, Ojo A, Gadegbeku C, Di Marco G, Reuter S, Kentrup D, Tiemann K, Brand M, Hill J, Moe O, Kuro O, Kusek J, Keane M, and Wolf M (2011) FGF23 induces left ventricular hypertrophy. J Clin Invest 121, 4393–4408 [DOI] [PMC free article] [PubMed] [Google Scholar]
- 13.Gutierrez O, Mannstadt M, Isakova T, Rauh-Hain J, Tamez H, Shah A, Smith K, Lee H, Thadhani R, Jűppner H, and Wolf M (2008) Fibroblast growth factor 23 and mortality among patients undergoing hemodialysis. N Eng J Med 359, 584–592 [DOI] [PMC free article] [PubMed] [Google Scholar]
- 14.Ruffoni D, Fratzl P, Roschger P, Klaushofer K, and Weinkamer R (2007) The bone mineralization density distribution as a fingerprint of the mineralization process. Bone 40:1308–1319 [DOI] [PubMed] [Google Scholar]
- 15.Roschger P, Paschalis EP, Fratzl P, Klaushofer K (2007) Bone mineralization density distribution in health and disease. Bone 42: 456–66 [DOI] [PubMed] [Google Scholar]
- 16.Pereira R, Delany A, Khouzam N, Bowen R, Freymiller E, Salusky I, and Wesseling-Perry K (2015) Primary osteoblast-like cells from patients with end-stage kidney disease reflect gene expression, proliferation, and mineralization characteristics ex vivo. Kidney Int 87, 593–601 [DOI] [PMC free article] [PubMed] [Google Scholar]
- 17.Martin A, Liu S, David V, Li H, Karydis A, Feng J, and Quarles L (2011) Bone proteins PHEX and DMP1 regulate fibroblastic growth factor Fgf23 expression in osteocytes through a common pathway involving FGF receptor (FGFR) signaling. FASEBJ 25, 2551–2562 [DOI] [PMC free article] [PubMed] [Google Scholar]
- 18.Zhang K, Barragan-Adjemian C, Ye L, Kotha S, Dallas M, Lu Y, Zhao S, Harris M, Harris S, Feng J, and Bonewald L (2006) E11/gp38 selective expression in osteocytes: regulation by mechanical strain and role in dendrite elongation. Mol Cell Biol 26, 4539–4552 [DOI] [PMC free article] [PubMed] [Google Scholar]
- 19.Dallas S, Prideaux M, and Bonewald L (2013) The osteocyte: an endocrine cell ... and more. Endocr Rev 34, 658–690 [DOI] [PMC free article] [PubMed] [Google Scholar]
- 20.Ikpegbu E, Basta L, Clements D, Fleming R, Vincent T, Buttle D, Pitsillides A, Staines K, and Farquharson C (2017) FGF-2 promotes osteocyte differentiation through increased E11/podoplanin expression. J Cell Physiol ePub ahead of print [DOI] [PMC free article] [PubMed] [Google Scholar]
- 21.Pereira R, Jűppner H, Gales B, Salusky I, and Wesseling-Perry K (2015) Osteocytic protein expression response to doxercalciferol therapy in pediatric dialysis patients. PLoS One 10, e0120856. [DOI] [PMC free article] [PubMed] [Google Scholar]
- 22.Wesseling-Perry K, Pereira R, Wang H, Elashoff R, Sahney S, Gales B, Jűppner H, and Salusky I (2009) Relationship between plasma fibroblast growth factor-23 concentration and bone mineralization in children with renal failure on peritoneal dialysis. J Clin Endocrinol Metab 94, 511–517 [DOI] [PMC free article] [PubMed] [Google Scholar]
- 23.Lima F, El-Husseini A, Monier-Faugere M, David V, Mawad H, Quarles D, and Malluche H (2014) FGF-23 serum levels and bone histomorphometric results in adult patients with chronic kidney disease on dialysis. Clin Nephrol 82, 287–295 [DOI] [PMC free article] [PubMed] [Google Scholar]
- 24.Rojas E, Carlini R, Clesca P, Arminio A, Suniaga O, De Elguezabal K, Weisinger J, Hruska K, and Bellorin-Font E (2003) The pathogenesis of osteodystrophy after renal transplantation as detected by early alterations in bone remodeling. Kidney Int. 63, 1915–1923 [DOI] [PubMed] [Google Scholar]
- 25.Consortium ADHR (2000) Autosomal dominant hypophosphataemic rickets is associated with mutations in FGF23. Nat Genet 26, 345–348 [DOI] [PubMed] [Google Scholar]
- 26.Antoniucci DM, Yamashita T, and Portale AA (2006) Dietary phosphorus regulates serum fibroblast growth factor-23 concentrations in healthy men. J Clin Endocrinol Metab 91, 3144–3149 [DOI] [PubMed] [Google Scholar]
- 27.Wesseling-Perry K, Pereira R, Sahney S, Gales B, Wang H, Elashoff R, Jűppner H, and Salusky I (2011) Calcitriol and doxercalciferol are equivalent in controlling bone turnover, suppressing parathyroid hormone, and increasing fibroblast growth factor-23 in secondary hyperparathyroidism. Kidney Int 79, 112–119 [DOI] [PubMed] [Google Scholar]
- 28.Mendoza JM, Isakova T, Ricardo AC, Xie H, Navaneethan SD, Anderson AH, Bazzano LA, Xie D, Kretzler M, Nessel L, Hamm LL, Negrea L, Leonard MB, Raj D, and Wolf M (2012) Fibroblast Growth Factor 23 and Inflammation in CKD. Clin J Am Soc Nephrol 7, 1155–1162 [DOI] [PMC free article] [PubMed] [Google Scholar]
- 29.Farrow EG, Yu X, Summers LJ, Davis SI, Fleet JC, Allen MR, Robling AG, Stayrook KR, Jideonwo V, Magers MJ, Garringer HJ, Vidal R, Chan RJ, Goodwin CB, Hui SL, Peacock M, and White KE (2011) Iron deficiency drives an autosomal dominant hypophosphatemic rickets (ADHR) phenotype in fibroblast growth factor-23 (Fgf23) knock-in mice. Proc Natl Acad Sci U S A 108, E1146–1155 [DOI] [PMC free article] [PubMed] [Google Scholar]
- 30.Ferreira A, Frazao JM, Monier-Faugere MC, Gil C, Galvao J, Oliveira C, Baldaia J, Rodrigues I, Santos C, Ribeiro S, Hoenger RM, Duggal A, and Malluche HH (2008) Effects of sevelamer hydrochloride and calcium carbonate on renal osteodystrophy in hemodialysis patients. J Am Soc Nephrol 19, 405–412 [DOI] [PMC free article] [PubMed] [Google Scholar]
- 31.Isakova T, Wahl P, Vargas G, Gutierrez O, Scialla J, Xie H, Appleby D, Nessel L, Bellovich K, Chen J, Hamm L, Gadegbeku C, Horwitz E, Townsend R, Anderson C, Lash J, Hsu C, Leonard M, and Wolf M (2011) Fibroblast growth factor 23 is elevated before parathyroid hormone and phosphate in chronic kidney disease. Kidney Int 79, 1370–1378 [DOI] [PMC free article] [PubMed] [Google Scholar]
- 32.Gutierrez OM, Mannstadt M, Isakova T, Rauh-Hain JA, Tamez H, Shah A, Smith K, Lee H, Thadhani R, Jüppner H, and Wolf M (2008) Fibroblast growth factor 23 and mortality among patients undergoing hemodialysis. N Engl J Med 359, 584–592 [DOI] [PMC free article] [PubMed] [Google Scholar]
- 33.Bakkaloglu S, Wesseling-Perry K, Pereira R, Gales B, Wang H, Elashoff R, and Salusky I (2010) Value of the new bone classification system in pediatric renal osteodystrophy. Clin J Am Soc Nephrol 5, 1860–1866 [DOI] [PMC free article] [PubMed] [Google Scholar]
- 34.Dempster D, Compston J, Drezner M, Glorieux F, Kanis J, Malluche H, Meunier P, Ott S, Recker R, and Parfitt A (2013) Standardized nomenclature, symbols, and units for bone histomorphometry: a 2012 update of the report of the ASBMR Histomorphometry Nomenclature Committee. J Bone Miner Res 28, 2–17 [DOI] [PMC free article] [PubMed] [Google Scholar]
- 35.Roschger P, Fratzl P, Eschberger J, and Klaushofer K (1998) Validation of quantitative backscattered electron imaging for the measurement of mineral density distribution in human bone biopsies. Bone 23, 319–326 [DOI] [PubMed] [Google Scholar]
Associated Data
This section collects any data citations, data availability statements, or supplementary materials included in this article.


