

Abstract
Background
This study analyzed the effects on long‐term outcome of residual mitral regurgitation (MR) and mean mitral valve pressure gradient (MVPG) after percutaneous edge‐to‐edge mitral valve repair using the MitraClip system.
Methods and Results
Two hundred fifty‐five patients who underwent percutaneous edge‐to‐edge mitral valve repair were analyzed. Kaplan–Meier and Cox regression analyses were performed to evaluate the impact of residual MR and MVPG on clinical outcome. A combined clinical end point (all‐cause mortality, MV surgery, redo procedure, implantation of a left ventricular assist device) was used. After percutaneous edge‐to‐edge mitral valve repair, mean MVPG increased from 1.6±1.0 to 3.1±1.5 mm Hg (P<0.001). Reduction of MR severity to ≤2+ postintervention was achieved in 98.4% of all patients. In the overall patient cohort, residual MR was predictive of the combined end point while elevated MVPG >4.4 mm Hg was not according to Kaplan–Meier and Cox regression analyses. We then analyzed the cohort with degenerative and that with functional MR separately to account for these different entities. In the cohort with degenerative MR, elevated MVPG was associated with increased occurrence of the primary end point, whereas this was not observed in the cohort with functional MR.
Conclusions
MVPG >4.4 mm Hg after MitraClip implantation was predictive of clinical outcome in the patient cohort with degenerative MR. In the patient cohort with functional MR, MVPG >4.4 mm Hg was not associated with increased clinical events.
Keywords: mitral stenosis, mitral valve, mitral valve regurgitation, percutaneous mitral valve repair, percutaneous treatment
Subject Categories: Valvular Heart Disease, Catheter-Based Coronary and Valvular Interventions, Complications, Hemodynamics
Clinical Perspective
What Is New?
The clinical implication of elevated mitral valve pressure gradients after MitraClip implantation is not clear and has not been examined/stratified by the cause of the mitral regurgitation (primary versus secondary).
What Are the Clinical Implications?
While an elevated mean mitral valve pressure gradient >4.4 mm Hg after MitraClip implantation was predictive of adverse clinical outcome in patients with primary mitral regurgitation, this was not observed in patients with secondary mitral regurgitation.
Special attention to avoid provoking increased mitral valve pressure gradients must be given to patients with primary mitral regurgitation undergoing MitraClip implantation.
Introduction
Since the introduction of percutaneous edge‐to‐edge mitral valve repair (PMVR) and the publication of favorable long‐term outcome data for patients with primary mitral regurgitation (MR),1, 2, 3 increasing numbers of patients not eligible for conventional surgical mitral valve (MV) repair are treated with this interventional technique.4 Recently, favorable clinical outcome for patients with secondary MR was reported in a randomized multicenter trial with 614 patients,5 while a smaller trial reported no effect of PMVR on the primary end point.6 From patient cohorts undergoing surgical repair of MR, it is well described that recurrent MR is associated with an increased frequency of heart‐failure‐related adverse events and cardiovascular admissions.7 Like other interventional therapies for structural cardiac diseases, PMVR is associated with substantial changes in cardiovascular hemodynamics, which might impact the clinical outcome in these patients. For instance, acute changes in left atrial pressure are associated with improvement in 6‐minute walk test (6 MWT) after PVMR8 and left ventricular (LV) volumes at end‐diastole and left atrial volumes are reduced by PMVR, which can be explained by the correction of volume overload caused by MR.9 Moreover, improvements in cardiac output can be measured immediately after successful PMVR10, 11 and positive cardiac remodeling can be observed at later stages after PMVR therapy, particularly with regard to functional MR.9 However, PMVR may also cause potentially negative hemodynamic effects. After implantation of the MitraClip (Abbott Vascular, Wetzlar, Germany), a double orifice is generated in most cases, which is often associated with an increase in the transmitral valve pressure gradient (MVPG).12, 13 In cohorts of patients undergoing surgical annuloplasty for functional MR, development of functional mitral stenosis (MS) after mitral valve (MV) annuloplasty was associated with reduced patient functional capacity as assessed by the 6 MWT.14 Another group, however, found that a postrepair MVPG >5 versus <5 mm Hg at 9 months postoperatively did not result in differences in long‐term outcomes such as freedom from hospitalization, freedom from congestive heart failure, and 23‐month survival.15 No distinction was made between primary and secondary MR in this trial. A recent study in 218 PMVR patients suggested that in the case of an echocardiographically measured MVPG in excess of 4.4 mm Hg, a significantly poorer long‐term outcome for the combined end point (all‐cause mortality, left ventricular assist device implantation, MV surgery, unsuccessful clip implantation, and redo procedure) and for all‐cause mortality can be expected.16
The present study was conducted to further scrutinize the impact of residual MR and an increase in MVPG on clinical outcome after PMVR taking the genesis of MR into consideration.
Methods
Study Population
The data that support the findings of this study are available from the corresponding author upon reasonable request.
We reviewed the data sets of 289 consecutive patients with severe MR who underwent PMVR using the MitraClip NT system at the Department of Cardiology and Cardiovascular Medicine of the University Hospital of the University of Tübingen between May 2014 and February 2017. Complete echocardiographic data sets were available for 269 of those patients. For 14 patients, no follow‐up data were available. The remaining 255 patients were included in the final analysis (Figure S1). The study complies with the Declaration of Helsinki, was approved by the local ethics committee (260/2015R), and the patients gave their informed consent. All patients were evaluated by an interdisciplinary heart team, which made the decision regarding treatment by PMVR based on either the EuroSCORE17 or on the presence of specific surgical risk factors not covered in the EuroSCORE. Exclusion criteria for PMVR were as previously described.18 Heart failure patients had to be on optimal medical treatment according to current guidelines for at least 3 months before PMVR.19 Clinical assessment and a 6 MWT of the patients were carried out on the day before the procedure for documentation of New York Heart Association (NYHA) functional class and walking distance. Transesophageal echocardiography (TEE) and transthoracic echocardiography (TTE) were carried out in the catheter lab directly before PMVR with the patient already in general anesthesia or deep sedation, respectively. These measurements were used to document MR severity, mean MVPG, mitral valve pressure half time, mitral valve morphology, and NYHA functional class. Immediately after MitraClip‐implantation, TEE und TTE were repeated for documentation of the postinterventional change of these measurements. Patients were seen in our outpatient department for a clinical follow‐up visit including TTE and TEE after a mean time of 7.8±4.8 months. At that time a history of heart failure symptoms was taken and a 6 MWT was performed. After 19.6±8.1 months, patients or their treating physician were contacted for a structured interview to determine the occurrence of any major adverse cardiac event. Major adverse cardiac events included mitral valve surgery, implantation of a left ventricular assist device, redo procedure, and all‐cause mortality.16
Echocardiographic Assessment
At the beginning and end of the procedure, TTE and TEE were performed to acquire hemodynamic and geometric data using a Philips CX50 iE 33 machine (Philips HealthCare, Hamburg, Germany). MR and reduction of MR were also assessed using TEE. We determined MR severity at baseline and the cause of the mechanism of MR according to the current European Association of Echocardiography guidelines.20 The technique described by Foster et al was used to assess the severity of MR postintervention.21 To calculate transmitral gradient and mitral valve pressure half time (PHT), 3 heartbeats were analyzed, and the mean of the measurements was calculated and reported as the final value. The mitral valve area (MVA) was determined according to the mean PHT with the formula MVA=220/PHT.
PMVR Procedure
We performed the procedure with patients either under general anesthesia or with deep sedation.22 The TEE probe was introduced into the esophagus after the induction of general anesthesia or deep sedation, and vascular access to the femoral vein was established. Under fluoroscopic and transesophageal 2‐ and 3‐dimensional echocardiographic guidance, the MitraClip device was advanced via the transseptal route across the mitral annulus into the left ventricle. With the 2 arms of the clip extended, the device was retracted to capture the MV leaflets and subsequently closed to coapt the MV leaflets, thereby emulating the surgical double‐orifice technique introduced by Alfieri et al.23 After clip deployment, final TEE and TTE measurements were obtained.
Statistical Analysis
Statistical analysis was carried out with SPSS (version 24, IBM Deutschland GmbH, Ehningen, Germany). Categorical variables are shown as absolute numbers or percentages. The level of significance for these variables was tested using the χ2 test. Ordinally scaled and continuous data are shown as the mean±SD. Normal distribution of variables was checked using the Shapiro–Wilk test. For normally distributed data, the paired t test was used to compare means. For non‐normally distributed data, the Wilcoxon test was applied to compare means. The 2‐tailed P values were calculated, and a value of P≤0.05 was considered statistically significant. Bivariate correlational analysis using Pearson's r or Spearman's r S (for nonparametric statistics) was performed to screen for any correlation of echocardiographic data with clinical outcome data. A primary combined end point (all‐cause mortality, MV surgery, redo procedure, and left ventricular assist device implantation)16 was used for Kaplan–Meier analysis of survival data. We used the recently published cutoff value of 4.4 mm Hg for MVPG16 to dichotomize groups. Factors were tested for prediction of the combined end point using univariate and multivariate Cox regression analyses. For multivariate analysis, an optimized model was calculated according to the results of the univariate analysis. Hazard ratios and 95% CIs were calculated from the Cox regression analysis.
Results
We evaluated the echocardiographic data sets and follow‐up data of 255 patients undergoing PMVR. Baseline characteristics of the study cohort are shown in Table 1.
Table 1.
Baseline Patient Characteristics N=255
| Overall Cohort (n=255) | Primary/Degenerative MR (n=104) | Secondary/Functional MR (n=151) | P Value | |
|---|---|---|---|---|
| Age (y) | 76.8±8.9 (255) | 79.4±6.9 (104) | 75.0±9.7 (151) | <0.001 |
| Male sex | 59.6% (152/255) | 48.1% (50/104) | 67.5% (102/151) | 0.002 |
| Coronary heart disease | 75.7% (193/255) | 71.2% (74/104) | 78.8% (119/151) | 0.16 |
| Atrial fibrillation | 67.1% (171/255) | 69.2% (72/104) | 65.6% (99/151) | 0.54 |
| Hypertension | 70.2% (179/255) | 76.9% (80/104) | 65.6% (99/151) | 0.05 |
| Smoker | 19.2% (49/255) | 16.3% (17/104) | 21.2% (32/151) | 0.33 |
| Hyperlipoproteinemia | 47.1% (120/255) | 51.0% (53/104) | 44.4% (67/151) | 0.3 |
| Diabetes mellitus | 31.0% (79/255) | 26.9% (28/104) | 33.8% (51/151) | 0.25 |
| NYHA‐class | 3.2±0.6 | 3.1±0.6 (104) | 3.2±0.6 (151) | 0.44 |
| Renal insufficiencya | 48.2% (123/255) | 45.2% (47/104) | 50.3% (76/151) | 0.42 |
| Pulmonary hypertensiona | 67.6% (171/253) | 69.9% (72/103) | 66.0% (99/150) | 0.52 |
| EuroScore II | 11.9±10.8 (255) | 11.4±12.7 (104) | 12.3±9.4 (151) | 0.01 |
| LVEDD | 54.0±10.0 mm (225) | 50.6±9.2 mm (86) | 56.1±9.9 mm (139) | <0.001 |
| LV function | ||||
| ≤35% | 52.2% (133/255) | 24.0% (25/104) | 71.5% (108/151) | <0.001 |
| 36%–50% | 23.5% (60/255) | 31.7% (33/104) | 17.9% (27/151) | 0.01 |
| >50% | 24.3% (62/255) | 44.2% (46/104) | 10.6% (16/151) | <0.001 |
| MR preintervention | 3.5±0.6 (255) | 3.4±0.6 (104) | 3.5±0.5 (151) | 0.11 |
| MR postintervention | 1.0±0.6 (255) | 1.1±0.7 (104) | 1.0±0.6 (151) | 0.85 |
| β‐Blockers | 86.6% (214/247) | 86.0% (86/100) | 87.1% (128/147) | 0.81 |
| Aldosterone antagonist | 55.1% (135/245) | 37.4% (37/99) | 67.1% (98/146) | <0.001 |
| ACE inhibitors/sartans | 87.3% (214/245) | 84.8% (84/99) | 89.0% (130/146) | 0.33 |
| Diuretics | 89.8% (221/246) | 86.9% (86/99) | 91.8% (135/147) | 0.21 |
| Digitalis | 10.2% (25/245) | 13.1% (13/99) | 8.2% (12/146) | 0.21 |
| Calcium antagonists | 18.0% (44/244) | 23.2% (23/99) | 14.5% (21/145) | 0.09 |
| Anticoagulation | 66.0% (163/247) | 65.0% (65/100) | 66.7% (98/147) | 0.79 |
| General anesthesia | 24.7% (63/255) | 22.1% (23/104) | 26.5% (40/151) | 0.43 |
| Deep sedation | 75.3% (192/255) | 77.9% (81/104) | 73.5% (111/151) | 0.43 |
| No. of implanted clips | ||||
| 1 | 49.0% (125/255) | 48.1% (50/104) | 49.7% (75/151) | 0.80 |
| 2 | 41.2% (105/255) | 38.5% (40/104) | 43.0% (65/151) | 0.47 |
| 3 | 9.4% (24/255) | 13.5% (14/104) | 6.6% (10/151) | 0.07 |
| 4 | 0.4% (1/255) | 0.0% (0/104) | 0.7% (1/151) | 0.41 |
ACE indicates angiotensin converting enzyme; LV, left ventricular; LVEDD, left ventricular end diastolic diameter; MR, mitral regurgitation; NYHA, New York Heart Association.
Definitions as used for EuroScore II.
Functional NYHA class III–IV was present in the majority of patients, and there was a high percentage (52.2%) of patients with severely reduced LV function (≤35% ejection fraction). Furthermore, we observed a high percentage of patients with functional MR (FMR, 59.2%). Coronary artery disease was previously diagnosed in 75.7% of the patients, while 67.1% had atrial fibrillation and 48.2% had renal insufficiency. Overall, 49 patients had a mean gradient >4.4 mm Hg (mean MVPG in this group, 5.5±1.0 mm Hg) postintervention. Reduction of MR severity to ≤2+ was achieved in 98.4% of all patients, whereas 4 patients had residual MR of 3+ (Figure 1A). There were no significant differences between the degenerative MR (DMR) and FMR cohorts with respect to grades of baseline MR (P=0.17), MR postintervention (P=0.75) or MR at follow‐up (FU) (P=0.34; Figure 1B).
Figure 1.
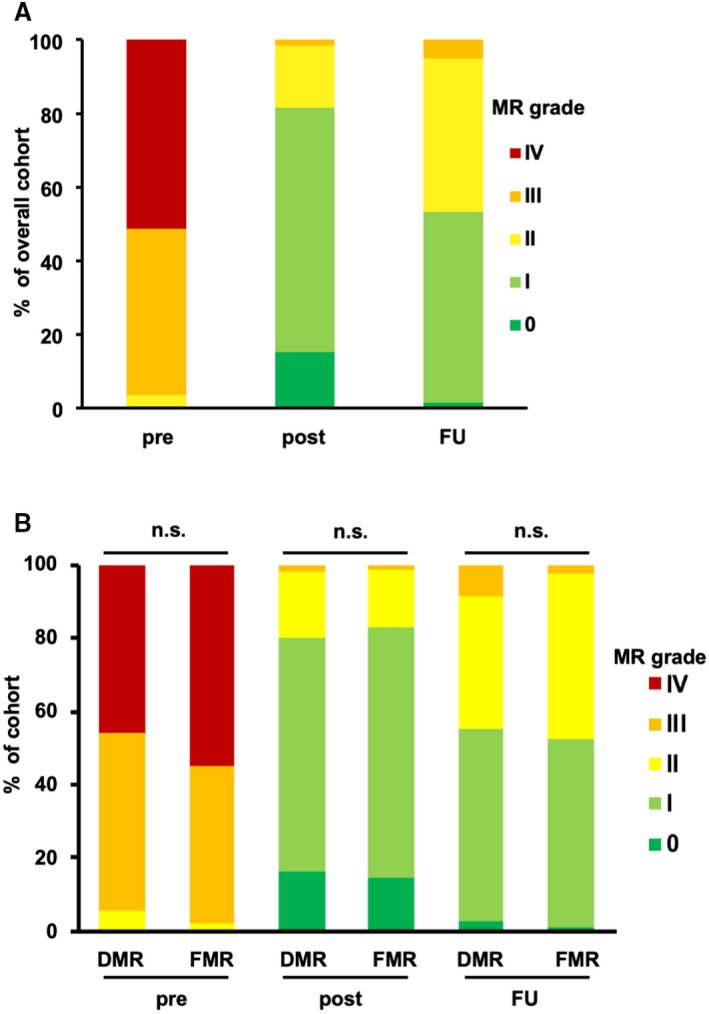
MR in the patient cohort. A, Columns indicate the fraction of different MR grades pre‐ and postintervention and at the follow‐up visit after 7.8±4.8 months. B, Columns indicate the fraction of different MR grades in the cohort of patients with DMR and FMR. There were no significant differences between the DMR and FMR cohorts with respect to grades of baseline MR (P=0.17), MR postintervention (P=0.75), or MR at follow‐up (P=0.34). DMR indicates degenerative mitral regurgitation; FMR, functional mitral regurgitation; FU, follow‐up; MR, mitral regurgitation; n.s., not significant; post, postintervention; pre, preintervention.
In parallel to the reduction of MR, mean MVPG (as determined by TEE) significantly increased from 1.6±1.0 mm Hg preintervention to 3.1±1.5 postintervention (P<0.001) and to 3.8±2.1 mm Hg at FU (P<0.001; Figure 2A). To take into account the genesis of MR, we additionally carried out further analyses of MVPG. We observed a significant increase of MVPG in both cohorts of DMR and FMR. In the cohort with DMR, MVPG increased from 1.8±1.2 mm Hg preintervention to 3.6±1.6 mm Hg postintervention (P<0.001) and to 4.3±2.1 mm Hg at FU (P<0.001; Figure 2B). In the cohort with FMR, MVPG increased from 1.4±0.7 mm Hg preintervention to 2.8±1.4 mm Hg postintervention (P<0.001) and to 3.5±2.1 mm Hg at FU (P<0.001; Figure 2C). Analyzing the MVA after PMVR, we found a significant decrease from 3.8±1.4 cm2 preintervention to 2.6±1.0 cm2 postintervention (P<0.001) and to 2.6±0.9 cm2 at FU (P<0.001; Figure S2A). In the cohort with DMR, MVA decreased from 3.8±1.4 cm2 preintervention to 2.3±0.8 cm2 postintervention (P<0.001) and to 2.4±0.8 cm2 (P<0.001; Figure S2B). In the cohort with FMR, MVA decreased from 3.8±1.4 cm2 preintervention to 2.9±1.0 cm2 postintervention (P<0.001) and to 2.7±0.9 cm2 at FU (P<0.001; Figure S2C). This corroborated the findings of increased pressure gradients after PMVR.
Figure 2.
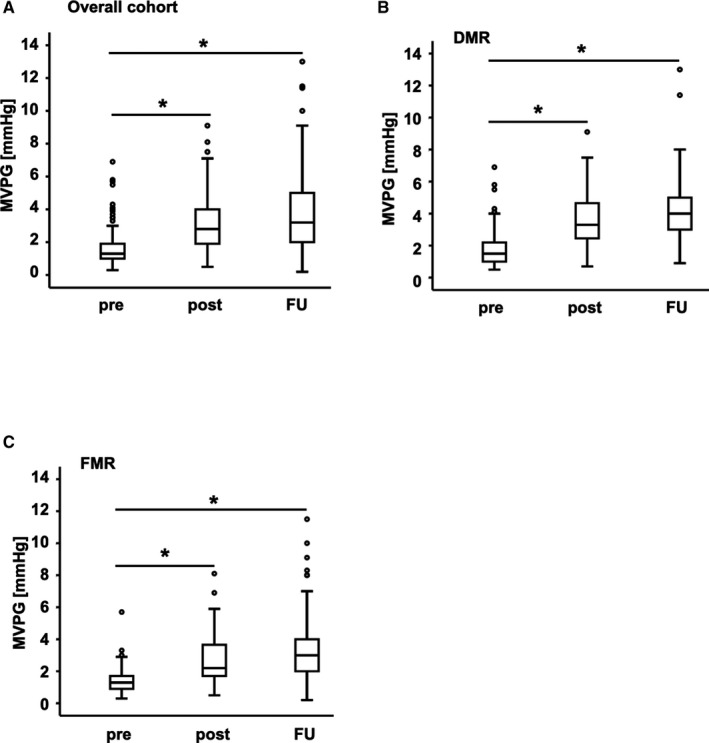
Changes in MVPG. MVPG pre‐ and postintervention and at FU. The boxes represent the 25% to 75% interquartile values for all measurements. The cross‐line marks the median of the measurements (50% quartile). The whiskers mark the smallest and largest measurements. The circles represent outliers. A, Overall cohort: MVPG increased significantly (from 1.6±1.0 mm Hg preintervention to 3.1±1.5 postintervention and to 3.8±2.1 mm Hg at FU; P<0.001). B, DMR cohort: MVPG increased from 1.8±1.2 mm Hg pre to 3.6±1.6 mm Hg post (P<0.001) and to 4.3±2.1 mm Hg at FU (P<0.001). C, FMR cohort: MVPG increased from 1.4±0.7 mm Hg pre to 2.8±1.4 mm Hg post (P<0.001) and to 3.5±2.1 mm Hg at FU (P<0.001). DMR indicates degenerative mitral regurgitation; FMR, functional mitral regurgitation; FU, follow‐up; MVPG, mitral valve pressure gradient; post, postintervention; pre, preintervention. *P<0.001.
To evaluate the impact of an elevated MVPG after PMVR on the clinical outcome, we carried out a bivariate correlational analysis. We observed no significant correlation between MVPG and NYHA functional class at the clinical FU visit (r S=0.10; P=0.15; Figure 3A). Also, in the cohort with DMR, there was no significant correlation (r S=0.02; P=0.89; Figure 3B). In the cohort with FMR, the correlation was significant (r S=0.19; P=0.04; Figure 3C). Furthermore, there was no significant correlation of MVPG with functional capacity as determined by the 6 MWT (r=−0.08; P=0.32; Figure 3D). For the cohorts with DMR and FMR there also was no significant correlation (DMR: r=−0.10; P=0.43 Figure 3E; FMR: r=−0.12; P=0.28; Figure 3F). Additionally, we tested the correlation of the MVA postintervention with NYHA functional class and 6 MWT. Consistently, there was no significant correlation either with the NYHA class (overall cohort: r S=0.13; P=0.07; Figure S3A). In the cohorts with DMR (r S=0.21; P=0.06; Figure S3B) and FMR (r S=0.03; P=0.77; Figure S3C) there was no significant correlation, either. Similarly, there was no significant correlation in all cohorts with the 6 MWT (overall cohort: r=−0.04; P=0.65; Figure S3D; DMR cohort: r=0.15; P=0.26; Figure S3E; FMR cohort: r=−0.17; P=0.13; Figure S3F).
Figure 3.
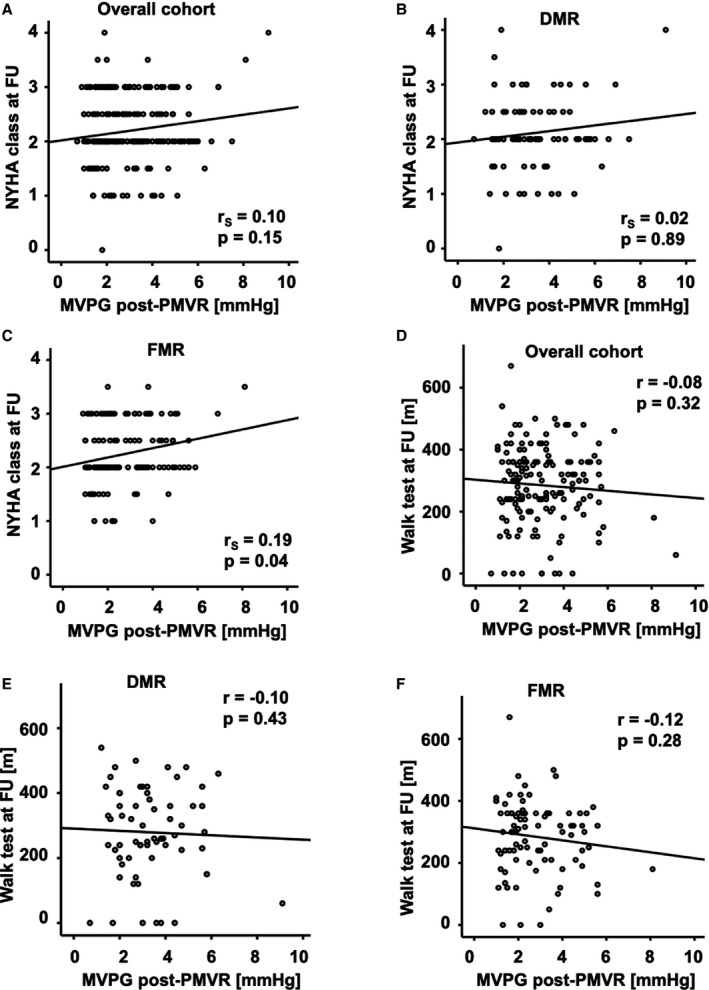
Scatter plots for correlational analysis of the association of MVPG post‐PMVR with clinical follow‐up data. A, Overall cohort: No significant correlation was observed between the MVPG postintervention and the NYHA functional class at FU (r S=0.10; P=0.15). B, DMR cohort: No significant correlation was observed between the MVPG postintervention and the NYHA functional class at FU (r S=0.02; P=0.89). C, FMR cohort: A significant correlation was observed between the MVPG postintervention and the NYHA functional class at FU (r S=0.19; P=0.04). D, Overall cohort: No significant correlation was observed between the MVPG postintervention and the walking distance in the 6 MWT at FU (r=−0.08; P=0.32). E, DMR cohort: No significant correlation was observed between the MVPG postintervention and the walking distance in the 6 MWT at FU (r=−0.10; P=0.43). F, FMR cohort: No significant correlation was observed between the MVPG postintervention and the walking distance in the 6 MWT at FU (r=−0.12; P=0.28). DMR indicates degenerative mitral regurgitation; FMR, functional mitral regurgitation; FU, follow‐up; MVPG, mitral valve pressure gradient; 6 MWT, 6‐minute walk test; NYHA, New York Heart Association; PMVR, percutaneous mitral valve repair.
The combined end point was mainly driven by all‐cause mortality, which was 26.7% in the overall cohort (21.2% in the DMR cohort, 30.5% in the FMR cohort) at the time point of FU interview after 19.6±8.1 months. All event rates for the composites of the combined end point are listed in Table S1. The Kaplan–Meier analyses for the combined end point with respect to residual MR after PMVR are given in Figure 4. Residual MR after PMVR showed a strong impact on long‐term clinical outcome as reflected by the combined end point. The more severe the residual MR, the more frequently we observed an occurrence of the combined end point (P<0.001, Figure 4A). When we analyzed the MR subgroups, the cohort with DMR showed the same pattern as the cohort with FMR (Figure 4B and 4C).
Figure 4.
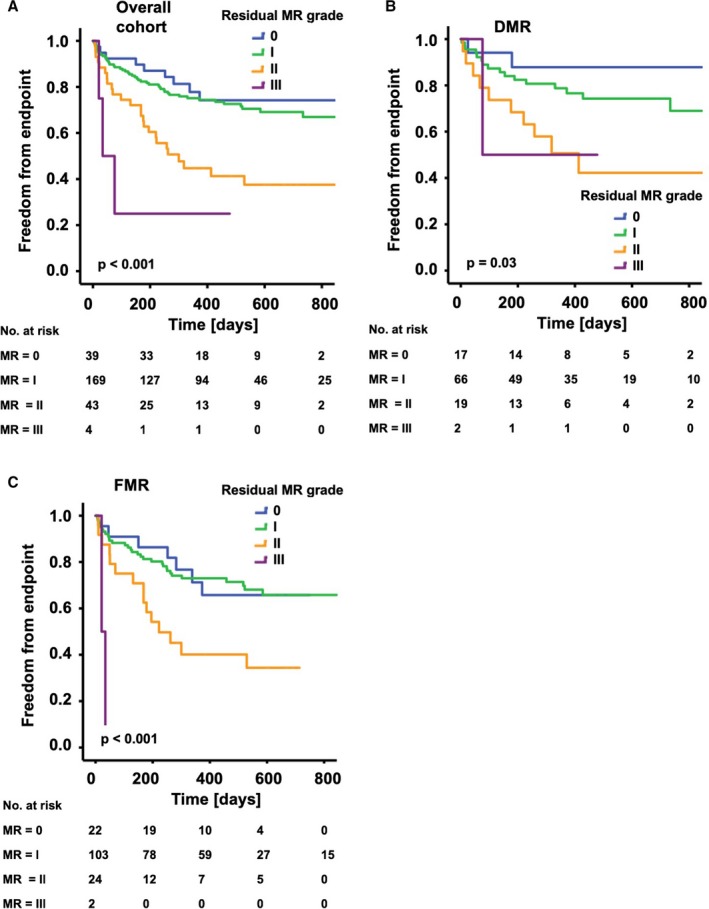
Kaplan–Meier analysis of the long‐term outcomes after PMVR according to residual MR. The graphs show freedom from the combined end point (all‐cause mortality, MV surgery, redo procedure, implantation of a LVAD) over time for patients with different grades of residual MR. A, Overall cohort: With increases in the grade of residual MR, freedom from the combined end point was significantly reduced (P<0.001). B, DMR cohort: With increases in the grade of residual MR, freedom from the combined end point was significantly reduced (P=0.03). C, FMR cohort: With increases in the grade of residual MR, freedom from the combined end point was significantly reduced (P<0.001). DMR indicates degenerative mitral regurgitation; FMR, functional mitral regurgitation; LVAD, left ventricular assist device; MR, mitral regurgitation; MV, mitral valve; PMVR, percutaneous mitral valve repair.
The Kaplan–Meier analyses for the combined end point with respect to MVPG postintervention are presented in Figure 5. In the overall cohort, 49 patients had a postprocedural MVPG higher than 4.4 mm Hg16 (mean MVPG in this group, 5.5±1.0 mm Hg). Those did not show elevated occurrence of the combined end point compared with those patients with a MVPG of ≤4.4 mm Hg (mean MVPG in this group, 2.5±1.0 mm Hg) in the Kaplan–Meier analysis (Figure 5A; P=0.94). Interestingly, a subgroup analysis of patients with DMR and those with FMR showed an opposite impact of the elevated MVPG on the primary end point. Twenty‐nine patients with DMR had an MVPG >4.4 mm Hg after PMVR. This was predictive of occurrence of the combined end point (P=0.03, Figure 5B). By contrast, in patients with FMR, elevated MVPG >4.4 mm Hg (20 patients) was not predictive of clinical outcome (P=0.07; Figure 5C). There was no significant difference in the distribution of grades of residual MR in the cohort with an MVPG >4.4 mm Hg and that with an MVPG ≤4.4 mm Hg (Figure S4A and S4B). Similarly, using a different MVPG cutoff value of 5 mm Hg, Kaplan–Meier curves did not differ significantly in all cohorts (Figure S5A through S5C). Additionally, we examined the MVA as a different marker for potential MS after PMVR. There was no significant difference in the Kaplan–Meier curves for patients with MVA >1.5 cm2 and those with MVA ≤1.5 cm2 post PMVR. This observation was made in the overall cohort (P=0.23; Figure S6A) as well as the DMR cohort (P=0.06; Figure S6B) and the FMR cohort (P=0.96; Figure S6C).
Figure 5.
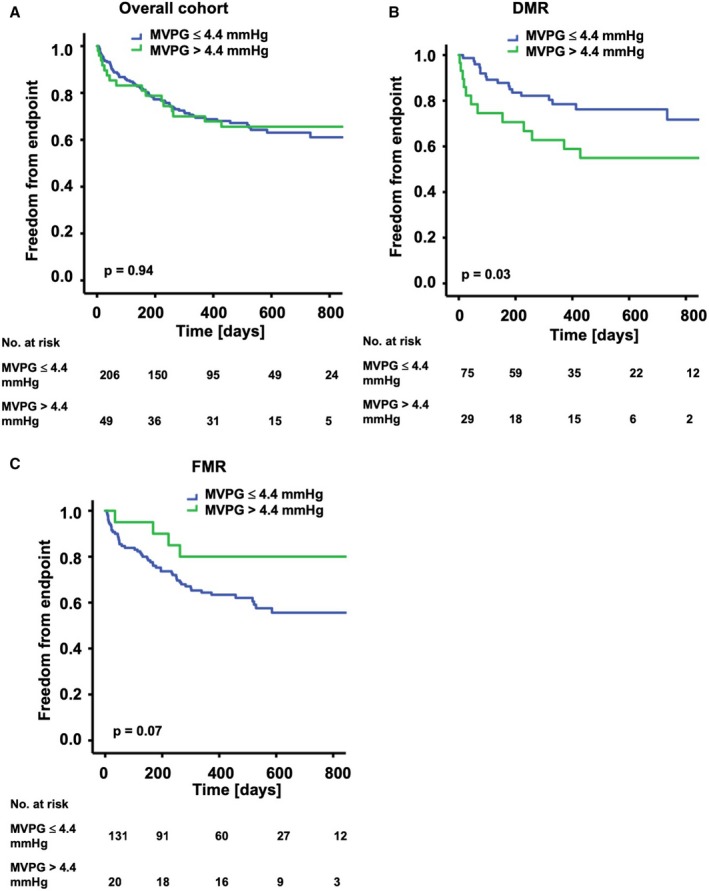
Kaplan–Meier analysis of the long‐term outcomes after PMVR according to the MVPG postintervention. The graphs show freedom from the combined end point (all‐cause mortality, MV surgery, redo procedure, implantation of a LVAD) over time for patients with MVPG >4.4 and ≤4.4 mm Hg postintervention. A, Overall cohort: No significant difference was detected between the groups (P=0.94).B, DMR cohort: A significant difference was detected between the groups (P=0.03). C, FMR cohort: No significant difference was detected between the groups (P=0.07). DMR indicates degenerative mitral regurgitation; FMR, functional mitral regurgitation; LVAD, left ventricular assist device; MV, mitral valve; MVPG, mitral valve pressure gradient; PMVR, percutaneous mitral valve repair.
Previous analysis from a PMVR cohort suggested that a combination of residual MR I° with a MVPG >4.4 mm Hg is associated with a worse clinical outcome than a residual MR II° in combination with a MVPG ≤4.4 mm Hg.16 Thus, we tested the influence of different combinations of residual MR and MVPG after PMVR on the combined clinical end point. Kaplan–Meier analysis demonstrated increased event rates associated with higher residual MR, whereas no influence of an increase in MVPG on the clinical parameters assessed in this study could be verified in our overall patient cohort. After PMVR, we found a less favorable clinical outcome for the combination of residual MR II° with a MVPG ≤4.4 mm Hg than for MR 0‐I° and a MVPG >4.4 mm Hg (Figure S7). Finally, the proportional hazards in a Cox regression model were calculated for the combined end point in the overall cohort. In the univariate analysis, the impact of factors on the combined end point was tested (Table 2). Age >74 years and residual MR were significant predictors for the combined end point, while MVPG was not. In the multivariate analysis, an age >74 years (hazard ratio 2.13; CI 1.38–3.28; P=0.001) and residual MR (hazard ratio 1.86; CI 1.31–2.66; P=0.001) were significant predictors of clinical events, while MVPG was not (hazard ratio 0.98; CI 0.85–1.13; P=0.77; Table 3). However, in a subgroup analysis MVPG was shown to be a positive predictor of clinical events in the DMR cohort (Table 4), while it was of negative predictive value in the FMR cohort (Table 5).
Table 2.
Cox Regression Univariate Analysis for the Combined End Point (n=255)
| HR (95% CI) | P Value | |
|---|---|---|
| Age >74 y | 2.11 (1.38–3.26) | 0.001 |
| Residual MR | 1.88 (1.32–2.67) | <0.001 |
| MVPG | 0.99 (0.86–1.14) | 0.86 |
Residual MR and MVPG were measured directly at the end of the procedure with the patient still under anesthesia. HR indicates hazard ratio; MR, mitral regurgitation; MVPG, mitral valve pressure gradient.
Table 3.
Cox Regression Multivariate Analysis for the Combined End Point (n=255)
| HR (95% CI) | P Value | |
|---|---|---|
| Age >74 y | 2.13 (1.38–3.28) | 0.001 |
| Residual MR | 1.86 (1.31–2.66) | 0.001 |
| MVPG | 0.98 (0.85–1.13) | 0.77 |
Residual MR and MVPG were measured directly at the end of the procedure with the patient still under anesthesia. HR indicates hazard ratio; MR, mitral regurgitation; MVPG, mitral valve pressure gradient.
Table 4.
Cox Regression Multivariate Analysis for the Combined End Point in the Cohort of Patients With DMR (n=104)
| HR (95% CI) | P Value | |
|---|---|---|
| Age >74 y | 2.17 (0.89–5.29) | 0.09 |
| Residual MR | 2.30 (1.36–3.88) | 0.002 |
| MVPG | 1.28 (1.05–1.56) | 0.02 |
DMR indicates degenerate mitral regurgitation; HR, hazard ratio; MR, mitral regurgitation; MVPG, mitral valve pressure gradient.
Table 5.
Cox Regression Multivariate Analysis for the Combined End Point in the Cohort of Patients With FMR (n=151)
| HR (95% CI) | P Value | |
|---|---|---|
| Age >74 y | 2.27 (1.32–3.89) | 0.003 |
| Residual MR | 1.73 (1.07–2.77) | 0.02 |
| MVPG | 0.80 (0.65–0.99) | 0.04 |
FMR indicates functional mitral regurgitation; HR, hazard ratio; MR, mitral regurgitation; MVPG, mitral valve pressure gradient.
Discussion
Since the introduction of PMVR, many inoperable patients with severe MR have been treated with this therapeutic approach, predominantly using the MitraClip system.24, 25, 26 With the increase in PMVR procedures, potential pitfalls and complications become increasingly apparent. If more than 1 clip is implanted, a relevant increase in the MVPG may result. Recently, increased MVPG after PMVR was suggested to predict mortality, and a mean MVPG exceeding 4.4 mm Hg as determined by echocardiography was associated with a worse clinical outcome than in patients with mean MVPGs below this threshold.16 Peak and mean MVPG as determined by echocardiography may be used to characterize mitral valve stenosis. However, peak MVPG is derived from peak mitral velocity, which is influenced by left atrial compliance and LV diastolic function.27 Thus, we used the mean MVPG, which is calculated by averaging the instantaneous gradients over the ejection period and hence is less dependent on the MV peak inflow velocity. Mean MVPG is a well‐established echocardiographic parameter that is generally accepted as a surrogate parameter for mitral valve stenosis.28
In this study, we evaluated the impact of an increased mean MVPG after PMVR in 255 patients. Interestingly, we found that (1) successful PMVR resulting in substantially reduced MR is associated with a significant increase in mean MVPG, (2) residual MR after MitraClip implantation is predictive of clinical outcome in patients with DMR and patients with FMR, and (3) an elevated MVPG >4.4 mm Hg after MitraClip implantation seems to be predictive of clinical outcome in patients with DMR. By contrast, in patients with FMR a MVPG >4.4 mm Hg seems not to be predictive of clinical outcome.
In the United States, PMVR with MitraClip is currently approved for use in DMR only. By contrast, many patients treated with MitraClip in Germany have FMR.29 In the light of the Coapt trial,5 in which PMVR with MitraClip has proved to be beneficial also in patients with FMR, MitraClip therapy will experience an extension of indications. Our study adds important information to the question of how to perform the procedure in this large group of patients with FMR. In our cohort, >70% of patients with FMR had an ejection fraction <35% on entry versus <25% in the DMR group. It is very hard to overcome the power of ejection fraction in determining outcomes.
Our PMVR approach may not be entirely comparable to the previously published patient cohort,16 because we tried to avoid mean MVPG values ≥6 mm Hg, and the frequency of such larger increases in transmitral gradients is not described in the study by Neuss et al.16 Furthermore, baseline characteristics differed regarding the fraction of patients with DMR and FMR. In our cohort, the fraction of DMR in the group with MVPG >4.4 mm Hg was significantly increased (59.2%) compared with that in the group with MVPG ≤4.4 mm Hg (36.4%, P=0.004). By contrast, there was no significant difference (30% versus 35%, P=0.42) in the cohorts with elevated and normal MVPG in the study by Neuss et al.16 MV peak inflow velocity and, thus, MVPG is variable and depends on factors such as the RR‐interval. To account for that, the mean MVPG was measured in 3 consecutive heartbeats for each patient. The mean of those 3 beats was calculated and reported as final value (Figure 2). It is known that a high mitral regurgitant volume may lead to an overestimation of the echocardiographic MVPG. Furthermore, net stroke volume, filling pressures, and pre‐/afterload may have influenced our data to some extent.
An increased transmitral gradient after surgical mitral valve repair is associated with reduced functional capacity as assessed, for example, by the SF‐36 questionnaire or a reduced 6 MWT.30 In contrast, our study points toward a less prominent role of this parameter—presumably if an exuberant transmitral pressure increase is avoided—after PMVR, since there was no significant correlation between the 6 MWT and MVPG, although the mean MVPG significantly increased after the procedure. Furthermore, there was no increased occurrence of the combined end point in the group with a MVPG >4.4 mm Hg in the overall cohort, which comprised patients with DMR and FMR. Importantly, subgroup analysis for patients with DMR and those with FMR showed that the impact of a MVPG >4.4 mm Hg on the combined end point reveals opposing effects. For instance, in the group with DMR, a MVPG >4.4 mm Hg led to a significantly higher occurrence of the combined end point (P=0.03), whereas patients with FMR exhibited a trend toward greater freedom from the combined end point (P=0.07). Mortality at FU after 19.6±8.1 months was 26.7% in the overall cohort, 21.2% in the DMR cohort, and 30.5% in the FMR cohort (P=0.10; Figure S8). However, our model was calculated for the combined end point, which encompassed all‐cause mortality, MV surgery, redo procedure, and implantation of a left ventricular assist device. Event rates for the combined end point were 31.9% in the overall cohort (27.9% for DMR and 36.4% for FMR) and, thus, well above 20%. Nevertheless, we have to appreciate the possibility that the model was overfitted. Future studies with larger numbers of patients will have to further scrutinize our findings.
Indeed, our observations are different from published data indicating a less beneficial outcome in patients with a MVPG >4.4 mm Hg.16 In that particular study, 70% of patients had FMR, and no subgroup analysis was performed for FMR and DMR. However, our data are in line with those of another study,31 which found no differences in survival and occurrence of MV surgery after PMVR when comparing the group with less‐than‐moderate residual MR and a MVPG >5 mm Hg to the group with moderate residual MR. Freedom from heart failure hospitalization at 1 year was significantly increased in the group with less‐than‐moderate residual MR, despite a MVPG >5 mm Hg, compared with that in the group with moderate residual MR.31 Accordingly, we found that residual MR was the main predictor for the combined primary end point assessed in our patient cohort. This observation underscores previous reports in surgical cohorts, which showed that recurrent MR leads to a higher frequency of heart‐failure‐related adverse events and cardiovascular admissions.7 Suri et al32 found recurrent moderate or greater MR following degenerative mitral valve repair to be associated with adverse LV remodeling and late death.
Limitations
While our study adds to the understanding of the relevance of anatomical and functional changes after PMVR resulting in altered hemodynamics, we must acknowledge several limitations. The sample size is a limitation of our study and with the restricted number of variables that could be adjusted for, we have a considerable risk of confounding. For instance, the majority of patients had FMR with severely reduced LV function while other studies predominantly analyzed patients with DMR.1, 33 In a recent study associating an elevated MVPG with less beneficial clinical outcomes after PMVR,16 transmitral gradients were assessed with echocardiography and invasive measurements, whereas we used echocardiography only to determine the increase in the pressure gradient. However, it has been shown that the correlation between the echocardiographically and invasively determined MVPG is only moderate and in order to have comparable parameters, we used the same cutoff value of 4.4 mm Hg determined by echocardiography.16 MVPG was measured directly after PMVR with the patients still in general anesthesia or deep sedation. While blood pressure was kept within normal ranges, no gradient provocation was performed although MVPG might increase with exercise. Because we had very few patients with a MVPG >6 mm Hg in our patient cohort, we cannot exclude the possibility that increases in the transmitral pressure gradient beyond this cutoff value become clinically relevant; thus, we recommend avoiding such increases at present.
Finally, we must acknowledge the limited sample size and single‐center design. Given the conflicting results between different patient cohorts, the relevance of MS after PMVR will require further confirmation with larger cohorts and randomization strategies. However, regarding the novelty of the percutaneous MVR technique and its complexity, the sample size and the duration of follow‐up seem reasonable and are comparable to those in other studies.16
Conclusion
We found an increase in mean MVPG after PMVR to be predictive of clinical outcome in patients with DMR only. In patients with FMR, there seems to be no negative influence of increased MVPG on clinical outcome.
Sources of Funding
This study was supported by grants from the German Research Foundation (KFO 274), the Volkswagen Foundation (Lichtenberg Program), and the German Heart Foundation.
Disclosures
Dr Langer, Dr Seizer, and Dr Schreieck were reimbursed for PMVR training courses by Abbott Vascular. The remaining authors have no disclosures to report.
Supporting information
Table S1. Event Rates of the Composites of the Primary End Point
Figure S1. Flow chart showing patient selection for the final analysis.
Figure S2. Changes in MVA.
Figure S3. Scatter plots for correlational analysis of the association of MVA post intervention with clinical follow‐up data.
Figure S4. Residual MR postintervention stratified according to resulting MVPG.
Figure S5. Kaplan–Meier analysis of the long‐term outcomes after PMVR according to the MVPG postintervention.
Figure S6. Kaplan–Meier analysis of the long‐term outcomes after PMVR according to the MVA postintervention.
Figure S7. Kaplan–Meier analysis of the long‐term outcomes after PMVR according to the MVPG and the residual MR postintervention.
Figure S8. Mortality at FU after 19.6±8.1 months is shown for cohorts with DMR and FMR.
Acknowledgments
We thank Chaolan Lin and Sarah Gekeler for excellent assistance in data collection.
(J Am Heart Assoc. 2019;8:e011366 DOI: 10.1161/JAHA.118.011366.)
Dr Patzelt and Dr Zhang are co‐first authors.
Contributor Information
Johannes Patzelt, Email: Johannes.Patzelt@uksh.de.
Harald F. Langer, Email: harald.langer@uksh.de.
References
- 1. Feldman T, Kar S, Elmariah S, Smart SC, Trento A, Siegel RJ, Apruzzese P, Fail P, Rinaldi MJ, Smalling RW, Hermiller JB, Heimansohn D, Gray WA, Grayburn PA, Mack MJ, Lim DS, Ailawadi G, Herrmann HC, Acker MA, Silvestry FE, Foster E, Wang A, Glower DD, Mauri L; EVEREST II Investigators . Randomized comparison of percutaneous repair and surgery for mitral regurgitation: 5‐year results of EVEREST II. J Am Coll Cardiol. 2015;66:2844–2854. [DOI] [PubMed] [Google Scholar]
- 2. Nickenig G, Estevez‐Loureiro R, Franzen O, Tamburino C, Vanderheyden M, Luscher TF, Moat N, Price S, Dall'Ara G, Winter R, Corti R, Grasso C, Snow TM, Jeger R, Blankenberg S, Settergren M, Tiroch K, Balzer J, Petronio AS, Buttner HJ, Ettori F, Sievert H, Fiorino MG, Claeys M, Ussia GP, Baumgartner H, Scandura S, Alamgir F, Keshavarzi F, Colombo A, Maisano F, Ebelt H, Aruta P, Lubos E, Plicht B, Schueler R, Pighi M, Di Mario C; Transcatheter Valve Treatment Sentinel Registry Investigators of the EURObservational Research Programme of the European Society of Cardiology . Percutaneous mitral valve edge‐to‐edge repair: in‐hospital results and 1‐year follow‐up of 628 patients of the 2011–2012 Pilot European Sentinel Registry. J Am Coll Cardiol. 2014;64:875–884. [DOI] [PubMed] [Google Scholar]
- 3. Nishimura RA, Vahanian A, Eleid MF, Mack MJ. Mitral valve disease—current management and future challenges. Lancet. 2016;387:1324–1334. [DOI] [PubMed] [Google Scholar]
- 4. Rudolph V, Huntgeburth M, von Bardeleben RS, Boekstegers P, Lubos E, Schillinger W, Ouarrak T, Eggebrecht H, Butter C, Plicht B, May A, Franzen O, Schofer J, Senges J, Baldus S. Clinical outcome of critically ill, not fully recompensated, patients undergoing MitraClip therapy. Eur J Heart Fail. 2014;16:1223–1229. [DOI] [PubMed] [Google Scholar]
- 5. Stone GW, Lindenfeld J, Abraham WT, Kar S, Lim DS, Mishell JM, Whisenant B, Grayburn PA, Rinaldi M, Kapadia SR, Rajagopal V, Sarembock IJ, Brieke A, Marx SO, Cohen DJ, Weissman NJ, Mack MJ; Investigators C . Transcatheter mitral‐valve repair in patients with heart failure. N Engl J Med. 2018;379:2307–2318. [DOI] [PubMed] [Google Scholar]
- 6. Obadia JF, Messika‐Zeitoun D, Leurent G, Iung B, Bonnet G, Piriou N, Lefevre T, Piot C, Rouleau F, Carrie D, Nejjari M, Ohlmann P, Leclercq F, Saint Etienne C, Teiger E, Leroux L, Karam N, Michel N, Gilard M, Donal E, Trochu JN, Cormier B, Armoiry X, Boutitie F, Maucort‐Boulch D, Barnel C, Samson G, Guerin P, Vahanian A, Mewton N; MITRA‐FR Investigators . Percutaneous repair or medical treatment for secondary mitral regurgitation. N Engl J Med. 2018;379:2297–2306. [DOI] [PubMed] [Google Scholar]
- 7. Goldstein D, Moskowitz AJ, Gelijns AC, Ailawadi G, Parides MK, Perrault LP, Hung JW, Voisine P, Dagenais F, Gillinov AM, Thourani V, Argenziano M, Gammie JS, Mack M, Demers P, Atluri P, Rose EA, O'Sullivan K, Williams DL, Bagiella E, Michler RE, Weisel RD, Miller MA, Geller NL, Taddei‐Peters WC, Smith PK, Moquete E, Overbey JR, Kron IL, O'Gara PT, Acker MA; CTSN . Two‐year outcomes of surgical treatment of severe ischemic mitral regurgitation. N Engl J Med. 2016;374:344–353. [DOI] [PMC free article] [PubMed] [Google Scholar]
- 8. Maor E, Raphael CE, Panaich SS, Reeder GS, Nishimura RA, Nkomo VT, Rihal CS, Eleid MF. Acute changes in left atrial pressure after MitraClip are associated with improvement in 6‐minute walk distance. Circ Cardiovasc Interv. 2017;10:e004856. [DOI] [PubMed] [Google Scholar]
- 9. Grayburn PA, Foster E, Sangli C, Weissman NJ, Massaro J, Glower DG, Feldman T, Mauri L. Relationship between the magnitude of reduction in mitral regurgitation severity and left ventricular and left atrial reverse remodeling after MitraClip therapy. Circulation. 2013;128:1667–1674. [DOI] [PubMed] [Google Scholar]
- 10. Patzelt J, Zhang Y, Magunia H, Jorbenadze R, Droppa M, Ulrich M, Cai S, Lausberg H, Walker T, Wengenmayer T, Rosenberger P, Schreieck J, Seizer P, Gawaz M, Langer HF. Immediate increase of cardiac output after percutaneous mitral valve repair (PMVR) determined by echocardiographic and invasive parameters: Patzelt: increase of cardiac output after PMVR. Int J Cardiol. 2017;236:356–362. [DOI] [PubMed] [Google Scholar]
- 11. Gaemperli O, Biaggi P, Gugelmann R, Osranek M, Schreuder JJ, Buhler I, Surder D, Luscher TF, Felix C, Bettex D, Grunenfelder J, Corti R. Real‐time left ventricular pressure‐volume loops during percutaneous mitral valve repair with the MitraClip system. Circulation. 2013;127:1018–1027. [DOI] [PubMed] [Google Scholar]
- 12. Herrmann HC, Rohatgi S, Wasserman HS, Block P, Gray W, Hamilton A, Zunamon A, Homma S, Di Tullio MR, Kraybill K, Merlino J, Martin R, Rodriguez L, Stewart WJ, Whitlow P, Wiegers SE, Silvestry FE, Foster E, Feldman T. Mitral valve hemodynamic effects of percutaneous edge‐to‐edge repair with the MitraClip device for mitral regurgitation. Catheter Cardiovasc Interv. 2006;68:821–828. [DOI] [PubMed] [Google Scholar]
- 13. Boerlage‐van Dijk K, van Riel AC, de Bruin‐Bon RH, Wiegerinck EM, Koch KT, Vis MM, Meregalli PG, Bindraban NR, Mulder BJ, Piek JJ, Bouma BJ, Baan J Jr. Mitral inflow patterns after MitraClip implantation at rest and during exercise. J Am Soc Echocardiogr. 2014;27:24–31.e1. [DOI] [PubMed] [Google Scholar]
- 14. Magne J, Senechal M, Mathieu P, Dumesnil JG, Dagenais F, Pibarot P. Restrictive annuloplasty for ischemic mitral regurgitation may induce functional mitral stenosis. J Am Coll Cardiol. 2008;51:1692–1701. [DOI] [PubMed] [Google Scholar]
- 15. Rubino AS, Onorati F, Santarpia G, Achille F, Lorusso R, Santini F, Renzulli A. Impact of increased transmitral gradients after undersized annuloplasty for chronic ischemic mitral regurgitation. Int J Cardiol. 2012;158:71–77. [DOI] [PubMed] [Google Scholar]
- 16. Neuss M, Schau T, Isotani A, Pilz M, Schopp M, Butter C. Elevated mitral valve pressure gradient after MitraClip implantation deteriorates long‐term outcome in patients with severe mitral regurgitation and severe heart failure. JACC Cardiovasc Interv. 2017;10:931–939. [DOI] [PubMed] [Google Scholar]
- 17. Nashef SA, Roques F, Michel P, Gauducheau E, Lemeshow S, Salamon R. European system for cardiac operative risk evaluation (EuroSCORE). Eur J Cardiothorac Surg. 1999;16:9–13. [DOI] [PubMed] [Google Scholar]
- 18. Patzelt J, Zhang Y, Seizer P, Magunia H, Henning A, Riemlova V, Patzelt TA, Hansen M, Haap M, Riessen R, Lausberg H, Walker T, Reutershan J, Schlensak C, Grasshoff C, Simon DI, Rosenberger P, Schreieck J, Gawaz M, Langer HF. Effects of mechanical ventilation on heart geometry and mitral valve leaflet coaptation during percutaneous edge‐to‐edge mitral valve repair. JACC Cardiovasc Interv. 2016;9:151–159. [DOI] [PubMed] [Google Scholar]
- 19. Ponikowski P, Voors AA, Anker SD, Bueno H, Cleland JG, Coats AJ, Falk V, Gonzalez‐Juanatey JR, Harjola VP, Jankowska EA, Jessup M, Linde C, Nihoyannopoulos P, Parissis JT, Pieske B, Riley JP, Rosano GM, Ruilope LM, Ruschitzka F, Rutten FH, van der Meer P; Authors/Task Force M . 2016 ESC guidelines for the diagnosis and treatment of acute and chronic heart failure: the Task Force for the diagnosis and treatment of acute and chronic heart failure of the European Society of Cardiology (ESC). Developed with the special contribution of the Heart Failure Association (HFA) of the ESC. Eur Heart J. 2016;37:2129–2200. [DOI] [PubMed] [Google Scholar]
- 20. Lancellotti P, Moura L, Pierard LA, Agricola E, Popescu BA, Tribouilloy C, Hagendorff A, Monin JL, Badano L, Zamorano JL; European Association of Echocardiography . European Association of Echocardiography recommendations for the assessment of valvular regurgitation. Part 2: mitral and tricuspid regurgitation (native valve disease). Eur J Echocardiogr. 2010;11:307–332. [DOI] [PubMed] [Google Scholar]
- 21. Foster E, Wasserman HS, Gray W, Homma S, Di Tullio MR, Rodriguez L, Stewart WJ, Whitlow P, Block P, Martin R, Merlino J, Herrmann HC, Wiegers SE, Silvestry FE, Hamilton A, Zunamon A, Kraybill K, Gerber IL, Weeks SG, Zhang Y, Feldman T. Quantitative assessment of severity of mitral regurgitation by serial echocardiography in a multicenter clinical trial of percutaneous mitral valve repair. Am J Cardiol. 2007;100:1577–1583. [DOI] [PubMed] [Google Scholar]
- 22. Patzelt J, Ulrich M, Magunia H, Sauter R, Droppa M, Jorbenadze R, Becker AS, Walker T, von Bardeleben RS, Grasshoff C, Rosenberger P, Gawaz M, Seizer P, Langer HF. Comparison of deep sedation with general anesthesia in patients undergoing percutaneous mitral valve repair. J Am Heart Assoc. 2017;6:e007485 DOI: 10.1161/JAHA.117.007485. [DOI] [PMC free article] [PubMed] [Google Scholar]
- 23. Alfieri O, Maisano F, De Bonis M, Stefano PL, Torracca L, Oppizzi M, La Canna G. The double‐orifice technique in mitral valve repair: a simple solution for complex problems. J Thorac Cardiovasc Surg. 2001;122:674–681. [DOI] [PubMed] [Google Scholar]
- 24. Puls M, Lubos E, Boekstegers P, von Bardeleben RS, Ouarrak T, Butter C, Zuern CS, Bekeredjian R, Sievert H, Nickenig G, Eggebrecht H, Senges J, Schillinger W. One‐year outcomes and predictors of mortality after MitraClip therapy in contemporary clinical practice: results from the German transcatheter mitral valve interventions registry. Eur Heart J. 2016;37:703–712. [DOI] [PMC free article] [PubMed] [Google Scholar]
- 25. Maisano F, Franzen O, Baldus S, Schafer U, Hausleiter J, Butter C, Ussia GP, Sievert H, Richardt G, Widder JD, Moccetti T, Schillinger W. Percutaneous mitral valve interventions in the real world: early and 1‐year results from the ACCESS‐EU, a prospective, multicenter, nonrandomized post‐approval study of the MitraClip therapy in Europe. J Am Coll Cardiol. 2013;62:1052–1061. [DOI] [PubMed] [Google Scholar]
- 26. Feldman T, Foster E, Glower DD, Kar S, Rinaldi MJ, Fail PS, Smalling RW, Siegel R, Rose GA, Engeron E, Loghin C, Trento A, Skipper ER, Fudge T, Letsou GV, Massaro JM, Mauri L; EVEREST II Investigators . Percutaneous repair or surgery for mitral regurgitation. N Engl J Med. 2011;364:1395–1406. [DOI] [PubMed] [Google Scholar]
- 27. Thomas JD, Newell JB, Choong CY, Weyman AE. Physical and physiological determinants of transmitral velocity: numerical analysis. Am J Physiol. 1991;260:H1718–H1731. [DOI] [PubMed] [Google Scholar]
- 28. Nishimura RA, Rihal CS, Tajik AJ, Holmes DR Jr. Accurate measurement of the transmitral gradient in patients with mitral stenosis: a simultaneous catheterization and Doppler echocardiographic study. J Am Coll Cardiol. 1994;24:152–158. [DOI] [PubMed] [Google Scholar]
- 29. Geis NA, Puls M, Lubos E, Zuern CS, Franke J, Schueler R, von Bardeleben RS, Boekstegers P, Ouarrak T, Zahn R, Ince H, Senges J, Katus HA, Bekeredjian R. Safety and efficacy of MitraClip therapy in patients with severely impaired left ventricular ejection fraction: results from the German transcatheter mitral valve interventions (TRAMI) registry. Eur J Heart Fail. 2018;20:598–608. [DOI] [PubMed] [Google Scholar]
- 30. Chan KL, Chen SY, Chan V, Hay K, Mesana T, Lam BK. Functional significance of elevated mitral gradients after repair for degenerative mitral regurgitation. Circ Cardiovasc Imaging. 2013;6:1041–1047. [DOI] [PubMed] [Google Scholar]
- 31. Cheng R, Dawkins S, Tat E, Makar M, Hussaini A, Makkar RR, Trento A, Siegel RJ, Kar S. Relation of residual mitral regurgitation despite elevated mitral gradients to risk of heart failure hospitalization after MitraClip repair. Am J Cardiol. 2017;120:1595–1600. [DOI] [PubMed] [Google Scholar]
- 32. Suri RM, Clavel MA, Schaff HV, Michelena HI, Huebner M, Nishimura RA, Enriquez‐Sarano M. Effect of recurrent mitral regurgitation following degenerative mitral valve repair: long‐term analysis of competing outcomes. J Am Coll Cardiol. 2016;67:488–498. [DOI] [PubMed] [Google Scholar]
- 33. Siegel RJ, Biner S, Rafique AM, Rinaldi M, Lim S, Fail P, Hermiller J, Smalling R, Whitlow PL, Herrmann HC, Foster E, Feldman T, Glower D, Kar S; EVEREST Investigators . The acute hemodynamic effects of MitraClip therapy. J Am Coll Cardiol. 2011;57:1658–1665. [DOI] [PubMed] [Google Scholar]
Associated Data
This section collects any data citations, data availability statements, or supplementary materials included in this article.
Supplementary Materials
Table S1. Event Rates of the Composites of the Primary End Point
Figure S1. Flow chart showing patient selection for the final analysis.
Figure S2. Changes in MVA.
Figure S3. Scatter plots for correlational analysis of the association of MVA post intervention with clinical follow‐up data.
Figure S4. Residual MR postintervention stratified according to resulting MVPG.
Figure S5. Kaplan–Meier analysis of the long‐term outcomes after PMVR according to the MVPG postintervention.
Figure S6. Kaplan–Meier analysis of the long‐term outcomes after PMVR according to the MVA postintervention.
Figure S7. Kaplan–Meier analysis of the long‐term outcomes after PMVR according to the MVPG and the residual MR postintervention.
Figure S8. Mortality at FU after 19.6±8.1 months is shown for cohorts with DMR and FMR.