Abstract
Background
MicroRNA (miR)‐33 targets cholesterol transporter ATP‐binding cassette protein A1 and other antiatherogenic targets and contributes to atherogenic progression. Its inhibition or deletion is known to result in the amelioration of atherosclerosis in mice. However, mice lack the other member of the miR‐33 family, miR‐33b, which exists in humans and other large mammals. Thus, precise evaluation and comparison of the responsibilities of these 2 miRs during the progression of atherosclerosis has not been reported, although they are essential.
Methods and Results
In this study, we performed a comprehensive analysis of the difference between the function of miR‐33a and miR‐33b using genetically modified mice. We generated 4 strains with or without miR‐33a and miR‐33b. Comparison between mice with only miR‐33a (wild‐type mice) and mice with only miR‐33b (miR‐33a−/−/miR‐33b+/+) revealed the dominant expression of miR‐33b in the liver. To evaluate the whole body atherogenic potency of miR‐33a and miR‐33b, we developed apolipoprotein E–deficient/miR‐33a+/+/miR‐33b−/− mice and apolipoprotein E–deficient/miR‐33a−/−/miR‐33b+/+ mice. With a high‐fat and high‐cholesterol diet, the apolipoprotein E–deficient/miR‐33a−/−/miR‐33b+/+ mice developed increased atherosclerotic plaque versus apolipoprotein E–deficient/miR‐33a+/+/miR‐33b−/− mice, in line with the predominant expression of miR‐33b in the liver and worsened serum cholesterol profile. By contrast, a bone marrow transplantation study showed no significant difference, which was consistent with the relevant expression levels of miR‐33a and miR‐33b in bone marrow cells.
Conclusions
The miR‐33 family exhibits differences in distribution and regulation and particularly in the progression of atherosclerosis; miR‐33b would be more potent than miR‐33a.
Keywords: atherosclerosis, humanized mouse model, lipid metabolism, microRNA
Subject Categories: Translational Studies, Vascular Biology, Lipids and Cholesterol
Clinical Perspective
What Is New?
This is the first report of the assessment of the atherogenicity of microRNAs (miR‐33a and miR‐33b) separately in vitro and in vivo using genetically modified mice. We found that miR‐33b showed increased atherogenic potential.
Both miR‐33a and miR‐33b showed differential expression in various organs and were antagonistically regulated by whole‐body cholesterol burden.
The miR‐33b showed dominant expression in the liver, and its expression was enhanced in response to cholesterol overload. This resulted in the increased atherogenicity under the high‐fat and high‐cholesterol diet in the apolipoprotein E–deficient/miR‐33a−/−/miR‐33b+/+ mice.
What Are the Clinical Implications?
The inhibition of miR‐33 is considered as a promising antiatherogenic therapy. Because complete deletion of miR‐33 causes obesity and fatty liver in mice, miR‐33b–specific inhibition may serve as an alternative approach for therapeutic miR‐33 inhibition.
Statins reduced the hepatic total miR‐33 copy number in mice. It might be one of potential causes of pleiotropy of statins.
Introduction
Atherosclerotic disease is one of the leading causes of death worldwide. Although many biological pathways are involved in the pathogenesis of atherosclerosis, cholesterol homeostasis plays an important role in disease progression. Cholesterol‐lowering therapy, especially using statins, is the most common therapy to reduce the risk and progression of atherosclerosis.1 However, numerous clinical studies indicate the existence of “residual risks,” mainly consisting of decreased high‐density lipoprotein (HDL)‐cholesterol2, 3 and increased triglyceride levels.4, 5 HDL or HDL‐cholesterol is the most important component of cholesterol reverse transport, which is the sole pathway in the human body for excreting cholesterol from the body. The results of recent research highlight the importance of not only the quantity but also the quality of HDL/HDL‐cholesterol in atherosclerosis progression.6 Because HDL/HDL‐cholesterol–modulating therapy is a promising therapeutic approach for atherosclerotic disease, rigorous research is required.
MicroRNAs (miRs) are a class of short, noncoding RNAs that affect many biological pathways by repressing the expression of coding genes both transcriptionally and posttranscriptionally.7 Numerous miRs have been shown to be involved in biological pathways and affect pathogenesis. Notably, we and other groups have shown previously that miR‐33 potentially affects many biological pathways, including cholesterol homeostasis.8, 9, 10, 11, 12, 13, 14, 15, 16, 17, 18 In vivo deletion or inhibition of miR‐33 using antisense oligonucleotide improved the serum cholesterol profile and enhanced cholesterol reverse transport of not only mice, but also nonhuman primates. These favorable changes in serum cholesterol profile or cholesterol reverse transport reduced atherosclerotic plaque progression in mice.11, 14 These observations suggest miR‐33 as a potential therapeutic target of atherosclerosis.
However, many challenges must be overcome before the clinical application of anti–miR‐33 therapy is realized. First, we and other groups found that in vivo deletion of miR‐33 results in obesity and impaired glucose tolerance in mice,17, 18 which could be a potential adverse effect of anti–miR‐33 therapy. Moreover, the human genome harbors miR‐33b in the intron 16 of sterol regulatory element‐binding factor (SREBF) 1, as a paralog of miR‐33a (Figure 1A). These miR sequences are almost the same, except at the 9th and 10th nucleotide position immediately after the seed sequences (Figure 1B). Notably, mouse, which is the most conventional animal model of atherosclerosis, lacks miR‐33b. Thus, the target gene signature, spatiotemporal expression pattern, and environmental regulation of miR‐33b remain largely unknown. Further investigation of the differences and similarities between miR‐33a and miR‐33b in vivo is essential to confirm the efficacy and safety of anti–miR‐33 therapy.
Figure 1.
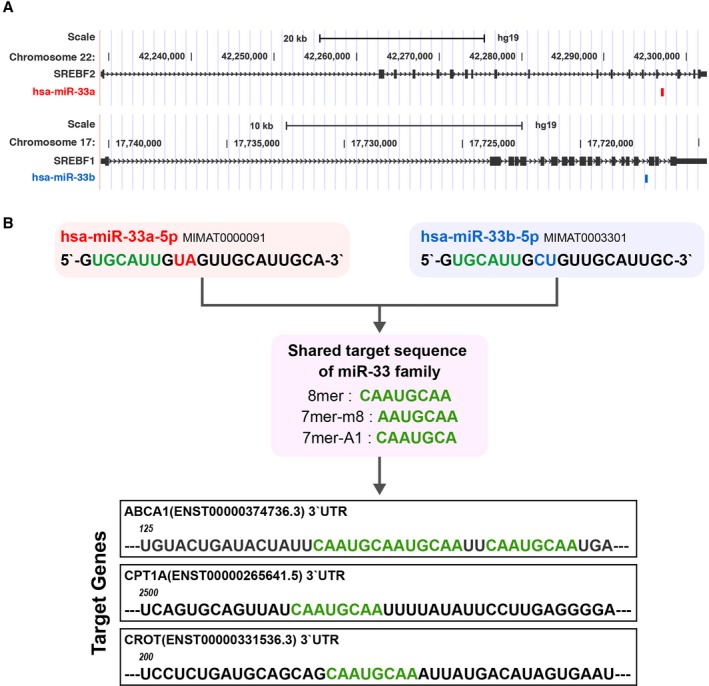
Similarities and differences between microRNAs (miR‐33a and miR‐33b). A, Genomic loci of sterol regulatory element‐binding factor (SREBF) 2/miR‐33a and SREBF1/miR‐33b in the human genome. B, Reference sequence, seed sequence, and targeting sequence of miR‐33a and miR‐33b. UTR indicates untranslated region.
In this study, we assessed the differences between miR‐33a and miR‐33b in vitro and in vivo using genetically modified miR‐33a knockout and miR‐33b knock in (KI) mice, reported previously.10, 19 The organ distributions of these 2 miRs were different. In particular, the 2 most atherosclerosis responsible organs, macrophages and liver, showed distinct patterns of distribution of miR‐33a or miR‐33b. Moreover, through modification of the dietary cholesterol burden, we found that these 2 miRs are strictly and distinctly regulated by cholesterol burden. In particular, miR‐33b was induced by high dietary fat and cholesterol, which is a common composition of current diets and is considered to be atherogenic. Overall, the apolipoprotein E–deficient (ApoE−/−) mice with only miR‐33b showed greater atherosclerotic burden than ApoE−/− mice with only miR‐33a. These data suggest that miR‐33b is a more potent therapeutic target than miR‐33a during atherosclerosis progression.
Materials and Methods
Animals
We crossbred previously generated miR‐33 knockout mice and miR‐33b KI mice and obtained 4 genetically modified mice. In this article, we named miR‐33a+/+ and miR‐33b−/− as miR‐33 wild‐type (WT) mice and miR‐33a−/− and miR‐33b+/+ as miR‐33 knock out knock in (KOKI) mice. We used male mice for all the experiments, except for bone marrow transplantation experiments. To assess the expression pattern of miR‐33a and miR‐33b with a Western‐type diet (WTD) containing 0.15% cholesterol and 40% fat (Oriental Yeast, Japan) feeding, we fed 8‐week‐old miR‐33b KI mice with WTD for 4 weeks. For cholesterol‐lowering experiments, miR‐33b KI mice were placed on WTD and in the second week, 10 mg/kg body weight pitavastatin (KOWA, Japan) and ezetimibe (Santa Cruz, TX) dissolved in carboxymethyl cellulose were administrated by oral gavage every 24 hours for 7 days. Mice were euthanized 24 hours after the last administration. For the plaque formation analysis, we also obtained ApoE−/− miR‐33a WT and ApoE−/− miR‐33 KOKI mice by crossbreeding. These mice are weaned at the age of 4 weeks and fed normal chow (Oriental yeast) and switched to WTD at 6 weeks of age, until 18 weeks of age. Aortic root frozen sections were stained with oil‐red O, picrosirius red, anti‐CD68 antibody (1 μg/mL), and anti–ATP‐binding cassette A1 (ABCA1; 2 μg/mL; NB400‐105; Novus Biologicals); and the positive area was quantified by Adobe Illustrator and in‐house R script. Polymerase chain reaction (PCR) primers used in genotyping PCR are provided in Table S1. Mice were euthanized by the IP injection of pentobarbital (50 mg/kg body weight; Kyoritsu Seiyaku, Japan), followed by cervical dislocation. Anesthesia was achieved by continuous inhalation of sevoflurane or IP injection of mixed anesthesia consisting of medetomidine (0.3 mg/kg body weight; Nihon Zen‐yaku, Japan), midazolam (4 mg/kg body weight; Sandoz, Japan), and butorphanol (4 mg/kg body weight; Meiji Seika Pharma, Japan). This study was approved by the Kyoto University Ethics Review Board. All methods were performed in accordance with the relevant guidelines.
Cell Culture
Primary hepatocytes were obtained from miR‐33 knockout mice by the collagenase perfusion method. Livers from mice were lysed by retrograde perfusion with collagenase type II (Worthington, OH). The cell suspension was passed through a 70‐μm cell strainer and centrifuged to isolate mature hepatocytes. Hepatocytes were seeded onto collagen type‐I coated dishes at a density of 2.5×10⁵ cells/mL in Dulbecco's modified Eagle's medium low glucose (Nacalai Tesque, Japan) supplemented with 10% fetal bovine serum (FBS). Primary mouse peritoneal macrophages were obtained from miR‐33 WT, miR‐33a knockout, miR‐33b KI, and miR‐33 KOKI mice by intraperitoneal lavage with cold phosphate‐buffered saline (PBS) 72 hours after the intraperitoneal administration of 3% (w/v) thioglycolate. Macrophages were resuspended in RPMI 1640 medium (Nacalai Tesque) containing 10% FBS, and seeded at a density of 5.0×10⁵ cells/mL. Hep‐G2 cells were cultured with DMEM supplemented with 10% FBS at a density of 1.0×10⁶ cells/mL. For cholesterol‐depletion experiments, the medium was replaced with DMEM containing 10% lipoprotein‐depleted serum and 10 nmol/L pitavastatin.
Gene Expression Analysis by Quantitative Real‐Time PCR
Total RNA was isolated using TriPure reagent (Sigma‐Aldrich, MO) from organs or cells. For coding genes, cDNA was synthesized using a Verso cDNA synthesis kit (Thermo Fisher Scientific, MA) and quantitative real‐time PCR was performed with THUNDERBIRD SYBR qPCR MIX (TOYOBO, Japan) in accordance with the manufacturer's instructions. Expression levels were normalized using the β‐actin expression level. Primers used in this study are listed in Table S2. For miR, quantitative PCR was performed using TaqMan MicroRNA Assays (Applied Biosystems, CA) in accordance with the manufacturer's instructions. Expression levels were normalized by U6 small nuclear RNA expression or quantified by the standard curve method. Both analyses were performed using a StepOnePlus real‐time PCR system (Applied Biosystems).
Western Blotting
Western blotting analysis was performed as described previously.17 Proteins were fractionated using NuPAGE 4% to 12% Bis‐Tris gels (Invitrogen) and transferred to Protran nitrocellulose transfer membrane (Whatman, Japan). The membrane was blocked using PBS containing 5% nonfat milk for 30 minutes at room temperature and incubated with the primary antibody (anti‐ABCA1: 1:2000, NB400‐105; anti‐ABCG1 (anti‐ATP binding cassette G1): 1:2000, NB400‐132 [Novus Biologicals, CO], anti–carnitine palmitoyltransferase Ia: 1:2000, ab128568 [Abcam, UK]; anti–β‐actin: 1:3000, A5441 [Sigma‐Aldrich]) overnight at 4°C. The membrane was washed in PBS containing 0.05% Tween‐20, and then it was incubated with the secondary antibody (anti‐rabbit IgG horseradish peroxidase linked: 1:2000; anti‐mouse IgG horseradish peroxidase linked: 1:2000 [GE Healthcare, UK]) for 30 minutes at room temperature. The membrane was washed in PBS containing 0.05% Tween‐20 and incubated with ECL Western Blotting Detection Reagent (GE Healthcare) for 5 minutes; then, the signal was detected using an LAS‐4000 system (Fuji Film, Japan).
Glucose and Insulin Tolerance Test
For the glucose tolerance test, 12‐week‐old miR‐33 WT mice and miR‐33 KOKI mice were starved overnight; then, 1.0 g/kg body weight glucose was administrated by IP injection. For the insulin tolerance test, miR‐33 WT mice and miR‐33 KOKI mice were starved for 4 hours; then, 1 U/kg body weight insulin was administrated by IP injection. Blood was obtained from the cut tail, and glucose concentrations were measured by a glucose sensor at each time point.
Metabolomic Analysis
The 8‐week‐old miR‐33 WT, knockout, or KI mice liver samples were subjected to capillary electrophoresis–time‐of‐flight mass spectrometry, capillary electrophoresis–triple quadrupole mass spectrometry, and liquid chromatography–time‐of‐flight mass spectrometry analyses (Agilent, Palo Alto, CA) and quantified by Human Metabolome Technologies, Inc.
miR‐Target Metabolite Integrating Pathway Analysis
Significantly dysregulated metabolites in miR‐33 KI mice liver were determined by t test for log‐transformed metabolite abundance. To integrate miR‐33 target gene information, we downloaded the predicted miR‐33 target site of mouse from the TargetScan website (http://www.targetscan.org/mmu_71). We performed gene‐metabolite integrated pathway analysis by Integrated Molecular Pathway Level Analysis framework (http://impala.molgen.mpg.de/impala/), by introducing these dysregulated metabolites and predicted miR‐33 targets. Pathways with a false discovery rate <0.05 are shown.
miR Transcriptome Analysis in the miR‐33 Knockout Mice
Liver total RNA was extracted from 8‐week‐old miR‐33 knockout mice and WT mice using TriPure reagent in accordance with the manufacturer's instructions. Whole miR transcriptome analysis was performed using miRNA Oligo chip (mouse, v19; TORAY, Japan).
Transcriptomic Analysis of miR‐Transfected Primary Hepatocytes
At 24 hours after incubation in DMEM supplemented with 10% FBS, the primary hepatocytes were transfected with miR‐33a, miR‐33b, or control‐miR mimic (Thermo Fisher Scientific) at a concentration of 30 nmol/L using Lipofectamine 2000 (Thermo Fisher Scientific) in accordance with the manufacturer's instructions. Total RNA was extracted using TriPure reagent in accordance with the manufacturer's instructions. Whole transcriptome analysis was performed using GeneChipMouseGene2.0ST Arrays (Affymetrix, CA). 3′‐Untranslated region sequences were obtained from bioMart (https://www.ensembl.org/biomart) and analyzed using an in‐house script. Motif enrichment analysis was performed using Sylamer software.20 Differences of the expression patterns between transcripts with different miR‐33 targeting motif were tested by Kolmogorov‐Smirnov test.
Cholesterol Efflux Via Mouse Apolipoprotein B Depleted Serum
Cholesterol efflux capacity of mouse apolipoprotein B depleted serum was measured as previously described.21 Briefly, J774 mouse macrophage cells were seeded at a density of 7×10⁴ cells/well in a 24‐well dish. These cells were labeled with 2 μCi/mL 3H‐cholesterol for 24 hours in RPMI 1640 medium with 1% FBS. Then, cells were incubated for 16 hours in RPMI 1640 medium containing 8‐(chlorophenylthio) adenosine 3′,5′‐cyclic monophosphate (0.3 mmol/L) and 0.2% BSA to upregulate ABCA1 in J774 cells. After washing 4 times with RPMI 1640 medium, cells were incubated with serum containing 2.8% apolipoprotein B depleted mouse serum. Apolipoprotein B depletion was achieved by polyethylene glycol. Cholesterol extraction properties were quantified as the percentage of radioactivity from the cells divided by the total radioactivity from the cells and medium.
Cholesterol Efflux From Mouse Peritoneal Macrophages
Cellular cholesterol efflux via apolipoprotein A‐1 and HDL was determined as described previously.10 Briefly, thioglycolate‐elicited mouse peritoneal macrophages were plated in 48‐well dishes (2.5×10⁶ cells/mL) and were cultured for 24 hours in RPMI 1640 medium containing 3H‐labeled acetylated low‐density lipoprotein (1.0 μCi/mL of 3H‐cholesterol and 25 μg/mL of acetylated low‐density lipoprotein; Biomedical Technologies Inc, MA). Cells were washed 4 times with medium and then incubated for 6 hours in RPMI 1640 medium with or without apolipoprotein A‐1 and HDL at indicated concentrations. Cholesterol efflux was expressed as a percentage of the radioactivity released from cells in medium relative to the total radioactivity in cells and medium.
Quantification of Cholesterol and Triglyceride in the Mouse Liver
Lipids in the liver were extracted by the Folch method, as previously described.17 Briefly, the lipids in the liver were extracted by addition of ice‐cold MeOH, followed by CHCl3. Water was added to the sample and incubated on ice for an additional 10 minutes, with occasional mixing. The sample was centrifuged for 5 minutes at 2000g, and the aqueous phase was discarded and reextracted by addition of ice‐cold CHCl3:MeOH (2:1, v/v). Organic phases were collected and dried under nitrogen stream. Lipids were quantified using the Cholesterol E‐test (WAKO, Japan) or Triglyceride E‐test (WAKO).
Bone Marrow Transplantation
Bone marrow transplantation experiments were performed using the same protocol as reported previously.14 Eight‐week‐old male miR‐33 WT or miR‐33 KOKI mice were used as bone marrow donors. Recipients were 8‐week‐old miR‐33 WT female mice. All mice used for bone marrow transplantation experiments had an ApoE−/− background. After euthanasia by cervical dislocation, femurs and tibias of donor mice were flushed with PBS containing 3% FBS and bone marrow cells were collected. The cell suspension was passed through a 40‐μm cell strainer, and contaminating red blood cells were lysed using ACK lysing buffer (Lonza, Switzerland). Bone marrow cells were washed twice with 3% PBS and suspended in RPMI 1640 medium. For donor mice, to induce bone marrow aplasia, whole body irradiation was performed twice, using 6 Gy, within an interval of 3 hours (137Cs; Gammacell 40 Exactor), and prepared bone marrow cells were transferred by retro‐orbital injection with 5×10⁶ bone marrow cells 6 hours after irradiation. Transplanted mice were placed on a standard normal diet for 4 weeks, and then switched to WTD for 12 weeks.
Reporter Assay
A complementary sequence of miR‐33a or miR‐33b was subcloned into psiCheck2 (Promega, WI) vector. Then, 50 ng of the reporter constructs was transfected into HepG2 cells with miR mimic at 1 nmol/L. At 24 hours after transfection, the cells were lysed and analyzed using a Piccagene dual luciferase reporter assay system (Toyo INK, Japan). Subsequently, 50 ng of liver‐X‐receptor (LXR) element reporter construct and sterol regulatory element reporter construct were transfected into HepG2 cells and incubated for 24 hours in the indicated medium composition.
Statistical Analysis
Numerical data are expressed as the mean±SEM. In the dot plots, horizontal bars indicate mean±SEM. Two sample data sets were tested using a 2‐tailed Student t test or a Wilcoxon rank sum test. The normality was tested beforehand by the Kolmogorov‐Smirnov normality test. If deviation from normality was observed, we applied a nonparametric test for the data set. For multiple comparisons, one‐way analysis of variance followed by Tukey and Dunnett multiple comparisons was used. P<0.05 was considered statistically significant. Data analyses and statistical tests were performed using R, version 3.3.1, and Prism, version 6.0 (GraphPad Software).
Results
Similar Potential Target Repression and Targeting Motif of miR‐33a/b in Vitro
To explore the similarities and differences in the targeting potency, and the target motifs of miR‐33a and miR‐33b, we performed transcriptomic analysis of primary cultured hepatocytes transfected with synthetic miR‐33a, miR‐33b, and a control miR (Figure 2A). To avoid the effects of endogenous miR‐33, hepatocytes were obtained from miR‐33a−/−/miR‐33b−/− (referred to as miR‐33a knock‐out) mice that were generated previously.9 The systemic miR expression remodeling in the liver of these mice was not observed (Figure S1). Hierarchical clustering analysis revealed that the gene expression signature of hepatocytes transfected with miR‐33a and miR‐33b formed a tight cluster that was distinct from the control (Figure 2B). To identify the difference between the target motifs, we performed the motif enrichment analysis in the 3′‐untranslated region (Figure 2C). We found that genes with miR‐33 canonical targeting sites were significantly repressed by synthetic miR‐33a and miR‐33b. However, we found no significantly repressed motifs in the comparison between miR‐33a and miR‐33b. This result suggested that miR‐33a and miR‐33b target virtually the same genes. These 2 synthetic miRs showed significant repression effects specifically on the genes with canonical miR‐33 targeting sites in the 3′‐untranslated region (Figure 2D). However, the repression potency of both these miRs showed no significant difference.
Figure 2.
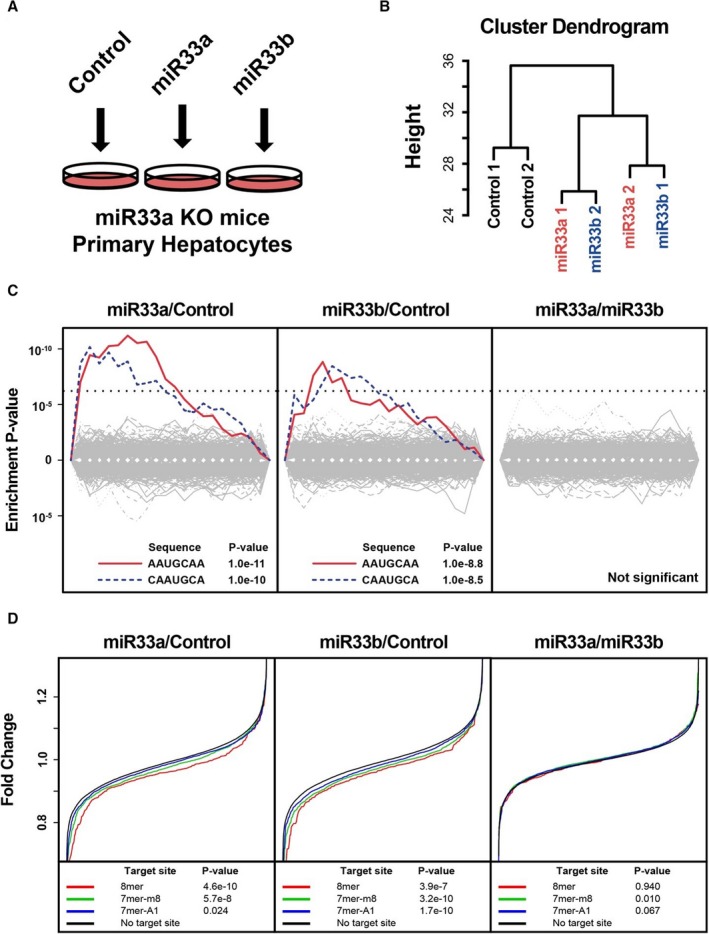
Transcriptomic analysis of targeting potency and targeting motifs in rodent primary hepatocytes. A, Experimental schema. B, Hierarchal clustering analysis of the expression pattern of primary hepatocytes. MicroRNAs (miR‐33a and miR‐33b) indicate miR‐33a or miR‐33b transfected primary hepatocytes. n=2 for each. C, Significantly suppressed motifs by synthetic miR transfection. miR‐33a vs miR‐control (left), miR‐33b/miR‐control (middle), and miR‐33a/miR‐33b (right). Dotted lines indicate significant threshold after multiple testing correction. D, Suppression of mRNAs with or without miR‐33 target sites in their 3′‐untranslated region. P values were calculated using the Kolmogorov‐Smirnov test. 7‐mer‐A1 indicates CAAUGCA; 7‐mer‐m8, AAUGCAA; 8‐mer, CAAUGCAA; KO, knock out.
Distinct Organ Distribution Patterns of miR‐33a and miR‐33b in Vivo
Because the targeting potency and targeting motif were relevant, we examined the spatial distributions of these 2 miRs. We obtained organs and thioglycolate‐elicited peritoneal macrophages from mice carrying the human miR‐33b sequence in Srebf1 intron 16 (miR‐33a+/+/miR‐33b+/+, referred to as miR‐33b knock in), which were reported previously.19 We found distinct expression patterns of miR‐33a and miR‐33b in several organs (Figure 3A). In particular, in the 2 most atherosclerosis‐responsive organs, macrophages and liver, the expression patterns showed distinct contrasts. In peritoneal macrophages, miR‐33a and miR‐33b were relevant, but in the liver, miR‐33b showed higher copy number than miR‐33a. Each intronic miR is coexpressed with its host gene. The expression patterns of miR‐33a and miR‐33b were closely correlated with those of Srebf2 and Srebf1 expression, respectively. To confirm its relevance in humans, we analyzed the expression patterns of these host genes and miR‐33 family in FANTOM5 human primary cultured cells.22, 23 We also found distinct expression patterns of the miR‐33 family and significant correlation between SREBF2 or SREBF1 and miR‐33a or miR‐33b (Figure 3B and 3C).
Figure 3.
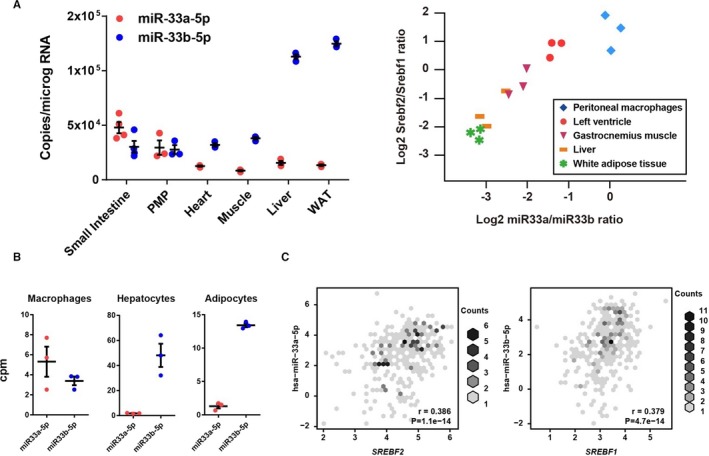
Organ expression patterns of microRNAs (miR‐33a and miR‐33b) and sterol regulatory element‐binding factor (Srebf) 1 and Srebf2. A, Absolute copy number of miR‐33a and miR‐33b (left) and correlations between the expression ratios of miR‐33a/miR‐33b and Srebf2/Srebf1 in organs of miR‐33b KI mice (right). n=3 for each organ. B, miR‐33 family abundance in human primary culture cells. C, Correlations between Srebf2 and miR‐33a (left) and Srebf1 and miR‐33b (right) expression levels in human primary cultured cells. Pearson's correlation coefficients (r) and P value were shown. Horizontal bars in the dot plots indicate mean±SEM. PMP indicates peritoneal macrophage; WAT, white adipose tissue; cpm, counts per million.
To dissect the functional difference in the different abundance of miR‐33a and miR‐33b in vivo, we generated 4 strains of mice in which miR‐33a and/or miR‐33b was specifically deleted by cross bleeding of miR‐33a knockout and miR‐33b KI mice (Figure 4A). These mice were born at mendelian ratio and did not show significant differences in body weight or liver weight (Figure 4B) at 8 weeks old. Previous studies confirmed the role of the miR‐33 family in cholesterol metabolism. Therefore, we assessed the serum cholesterol profile of these 4 strains of mice (Figure 4C). The level of serum HDL‐cholesterol was the highest in miR‐33a knockout mice and lowest in miR‐33b KI mice, as expected. Interestingly, the miR‐33a−/−/miR‐33b+/+ (referred to as miR‐33 KOKI) mice showed significantly decreased serum HDL‐cholesterol levels compared with miR‐33a+/+/miR‐33b−/− (referred to as miR‐33 WT) mice by ≈30%, and as low as miR‐33b KI mice. Hereafter, we mainly compared WT with KOKI mice because we want to clarify the in vivo functional difference between miR‐33a and miR‐33b. We assessed the absolute quantity of miR‐33 family in the liver and found dominant abundance of miR‐33b (Figure 4D). Although the expression of host genes was similar, the confirmed miR‐33 target genes were significantly repressed (Figure 4E through 4G). In addition, we noticed a slightly reduced LDL‐cholesterol level in miR‐33 KOKI than miR‐33 WT mice; however, genes involved in LDL‐cholesterol metabolism showed no significant difference between miR‐33 KOKI and miR‐33 WT mice (Figure 4H).
Figure 4.
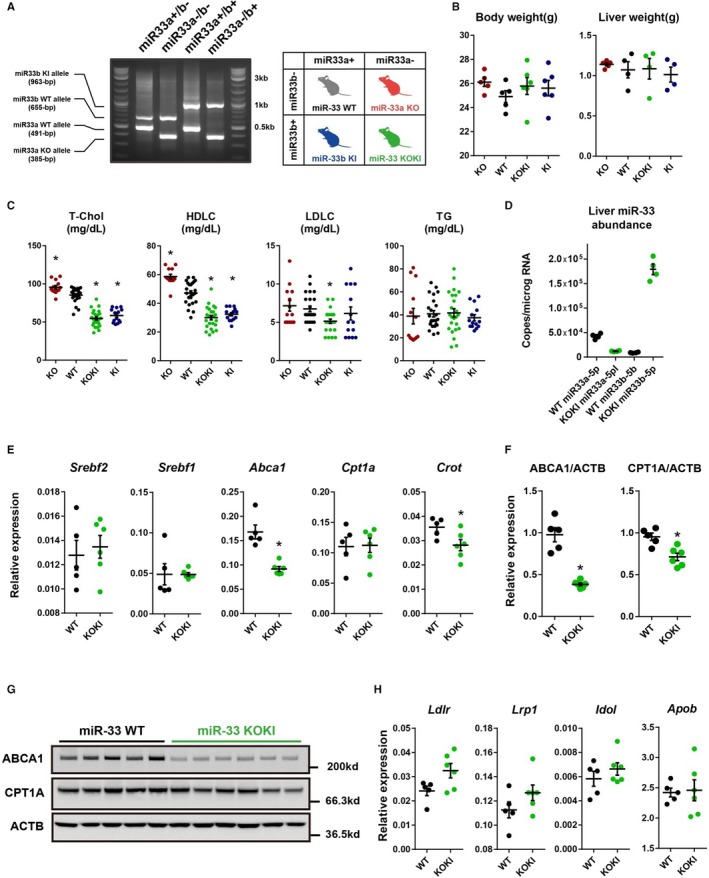
Generation, phenotype, and gene expression of microRNA (miR)‐33 wild‐type (WT) and miR‐33 knock out knock in (KOKI) mice. A, Representative polymerase chain reaction (PCR) genotyping results and nomenclatures of the 4 strains of mice. B, Body and liver weight of 8‐week‐old miR‐33 4 strain mice. n=5 for knockout, n=5 for WT, n=6 for KOKI, and n=6 for KI for body weight. n=5 for knockout, and n=4 for WT, KOKI, and KI for liver weight. C, Serum lipid levels of the 4 strains of mice. n=13 for knockout, n=24 for WT, n=24 for KOKI, and n=14 for KI. D, Absolute copy number of miR‐33a and miR‐33b in miR‐33 WT mice and miR‐33 KOKI mice liver. n=4 for each. E, Quantitative PCR analysis for miR‐33 host and target genes in the liver. F, Densitometric analysis of Western blotting of miR‐33 target genes in the liver. G, Representative Western blotting images of miR‐33 target genes in the liver. H, Quantitative PCR analysis for low‐density lipoprotein‐cholesterol (LDLC) related genes in the liver. n=5 for WT, and n=6 for KOKI. Horizontal bars in the dot plots indicate mean±SEM. ABCA indicates ATP‐binding cassette A; HDLC, high‐density lipoprotein‐cholesterol; T‐Chol, total cholesterol; ACTB, Beta acitin; CPT, Carnitine Palmitoyltransferase; KO, Knock out; TG, Triglyceride. *P<0.05 compared with WT.
As previous reports suggested the roles of miR‐33 in glucose homeostasis, we assessed glucose and insulin tolerance of the 2 strains of mice as potential atherogenic factors. We found significantly impaired glucose tolerance and decreased insulin sensitivity (Figure 5A) of miR‐33 KOKI mice than miR‐33 WT mice. In addition, we performed metabolomic analysis of the liver tissue in miR‐33 knockout, miR‐33 KI, and WT mice. We found that a greater number of metabolites showed different abundance compared with miR‐33 WT in the miR‐33 KI mice liver than miR‐33 knockout mice liver (Figure 5B). To characterize the metabolomic changes caused by miR‐33b, we also performed integrated pathway enrichment analysis of these metabolites and miR‐33 target genes. We identified several pathways on which these metabolites and miR‐33 target genes were enriched. These pathways included glucose homeostasis related pathways (Figure 5C and Figures S2 through S4).
Figure 5.
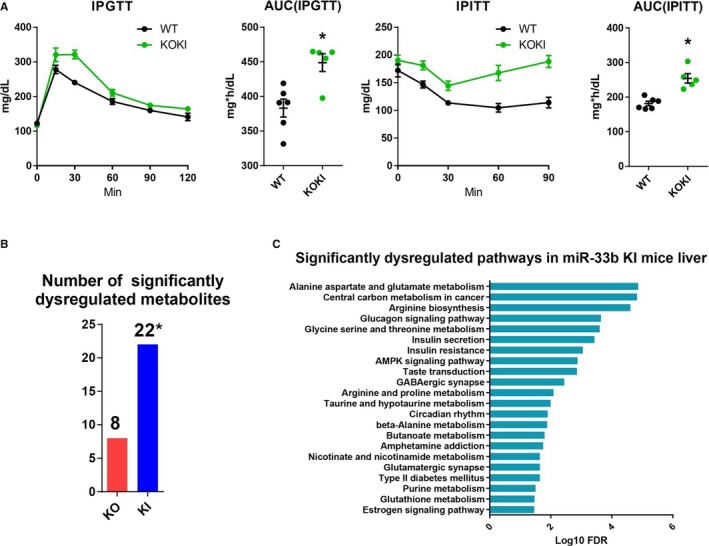
Impaired glucose tolerance and dysregulated liver metabolites in microRNA (miR)‐33 knock out knock in (KOKI) mice. A, Glucose and insulin tolerance of miR‐33 wild‐type (WT) and miR‐33 KOKI mice. n=6 for WT, and n=5 for KOKI. *P<0.05 compared with WT. B, Number of significantly dysregulated metabolites for miR‐33 knockout mice compared with WT and miR‐33b KI mice compared with WT mice. n=6 for each. *P<0.05 compared with knockout (tested by Fisher's exact test). C, Significantly dysregulated pathways in miR‐33b KI mice liver. Horizontal bars in the line chart or dot plots indicate mean±SEM. AMPK indicates AMP kinase; AUC, area under the curve; FDR, false discovery rate; IPGTT, intraperitoneal glucose tolerance test; IPITT, intraperitoneal insulin tolerance test; KO, Knock out.
Relevant Functions of miR‐33a and miR‐33b in Macrophages
Because miR‐33 in macrophages was also shown to be responsible for atherosclerosis, especially by repressing cholesterol reverse transport, we assessed the function of macrophages, where the abundance of miR‐33a and miR‐33b was relevant (Figure 3A). To assess the functional differences in macrophages obtained from these 4 strains of mice, we performed cholesterol efflux experiments. The experiments confirmed the similar functionality of macrophages obtained from miR‐33 WT and miR‐33 KOKI mice (Figure 6A). Supporting this result, gene expression analysis confirmed no significant difference in the expression of Abca1 or Abcg1 in macrophages obtained from miR‐33 KOKI mice compared with miR‐33 WT mice (Figure 6B and 6C). Although previous reports also suggested the participation of miR‐33 in macrophage inflammatory phenotypes,15, 16 inflammatory gene expression patterns were similar between macrophages obtained from miR‐33 KOKI mice compared with miR‐33 WT mice (Figure 6D).
Figure 6.
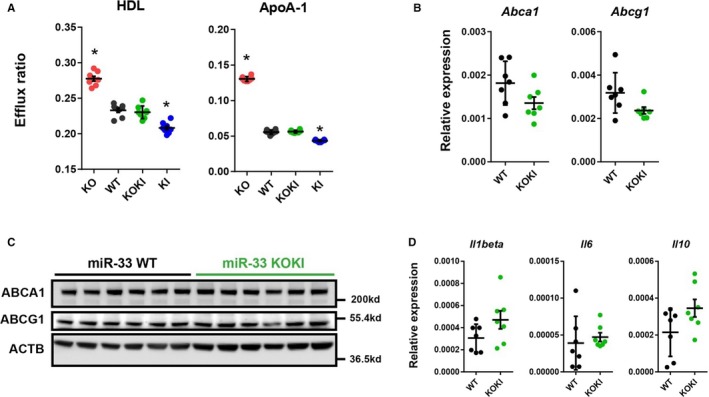
Similar characteristics of peritoneal macrophages obtained from microRNA (miR)‐33 wild‐type (WT) and miR‐33 knock out knock in (KOKI) mice. A, Cholesterol efflux to high‐density lipoprotein (HDL) or apolipoprotein A‐1 (ApoA‐1) from peritoneal macrophages from the 4 strains of mice. n=8 for each. B, Quantitative polymerase chain reaction (PCR) analysis for miR‐33 target genes in the peritoneal macrophages. n=7 for each. C, Representative images of Western blotting analysis for miR‐33 target genes in the peritoneal macrophages. n=6 for each. D, Quantitative PCR analysis for inflammatory markers in the peritoneal macrophages. n=7 for each. Horizontal bars in the dot plots indicate mean±SEM. ABCA indicates ATP‐binding cassette A; ABCG1, anti ATP binding cassete G1; ACTB, beta‐actin; KO, Knock out. *P<0.05 compared with WT.
Regulation of the miR‐33 Family in Cholesterol‐Burdened Conditions
Intronic miRs are expressed concurrently with their host genes. Srebf2, the host gene of miR‐33a, is the master regulator of cholesterol homeostasis. Decreased cellular cholesterol content enhances the activity of the sterol regulatory element‐binding protein 2 and increases the expression of the sterol regulatory element‐binding protein 2 target genes. On the contrary, Srebf1, the host gene of miR‐33b, is regulated by transcriptional regulation through the LXR. The activity of the LXR axis is enhanced by increased cellular cholesterol content. To assess the effect of hypercaloric and hypercholesteric diet on the expression of miR‐33a and miR‐33b, we fed miR‐33b KI mice with WTD (Figure 7A). Feeding the miR‐33b KI mice with WTD for 4 weeks successfully induced a hypercholesterolemic state (Figure 7B), resulting in a reduction in Srebf2 expression and an increase in Srebf1 expression (Figure 7C). Corresponding to these changes in the expression of host genes, reduced miR‐33a and increased miR‐33b expression levels were observed in the liver (Figure 7D); and these changes were accompanied by changes in the expression patterns of sterol regulatory element‐binding protein 2/LXR target genes (Figure 7E).
Figure 7.
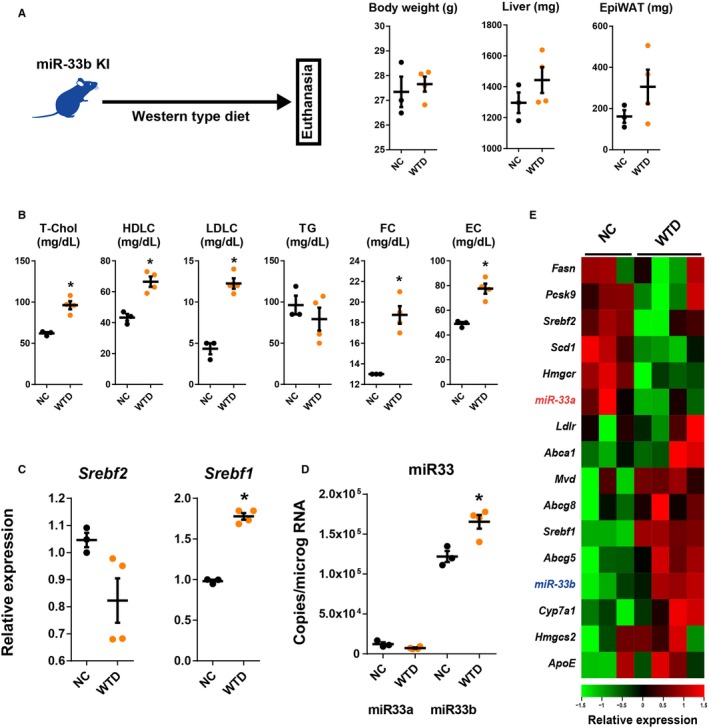
Changes in liver gene expression in microRNA (miR)‐33b knock in (KI) mice in the cholesterol‐burdened condition. A, Experimental scheme and changes in body, liver, and epidydimal white adipose tissue (EpiWAT) weight during experiment. B, Serum lipid profiles after 2 weeks of Western‐type diet (WTD) feeding experiment. Quantitative polymerase chain reaction analysis for sterol regulatory element‐binding factor (Srebf) 2 and Srebf1 (C) and miR‐33a and miR‐33b (D) in the liver under the cholesterol‐burdened condition. E, Heat map representation of liver gene expression levels of mice fed normal chow (NC) or WTD. n=3 for normal NC‐fed mice, and n=4 for WTD‐fed mice. Horizontal bars in the dot plots indicate mean±SEM. EC indicates esterified cholesterol; FC, free cholesterol; HDLC, high‐density lipoprotein‐cholesterol; LDLC, low‐density lipoprotein‐cholesterol; T‐Chol, total cholesterol; TG, Triglyceride. *P<0.05 compared with NC‐fed mice.
Regulation of the miR‐33 Family in Cholesterol‐Depleted Conditions
Cholesterol‐lowering treatment is the established therapeutic approach against atherosclerotic disease and is generally used in the clinical setting. In such conditions, the enhanced expression of miR‐33a was suggested; however, there was no evidence of the kinetics of miR‐33b in such conditions. To assess changes in the expression of miR‐33a and miR‐33b under these conditions, we performed cholesterol‐lowering experiments in vivo. We administrated statin or vehicle orally to WTD‐fed miR‐33b KI mice (Figure 8A). Because the dietary cholesterol intake was not negligible in mice, we also administrated intestinal cholesterol absorption inhibitor, ezetimibe, simultaneously. This treatment effectively decreased serum LDL‐cholesterol levels without affecting the body, liver, and adipose tissue weight of WTD‐fed miR‐33b KI mice (Figure 8A and 8B); and it significantly repressed Srebf1 and miR‐33b expression in the liver (Figure 8C and 8D). Indeed, the miR‐33a expression levels were also significantly increased; considering the prevalence of miR‐33b in the liver, the hepatic total miR‐33 copy number was significantly decreased by the treatment. Changes in cellular sterol regulatory element and LXR element signaling by statin treatment were also confirmed by reporter assays using the HepG2 human liver cell line (Figure 8E). These transcriptional changes in the miR‐33 family were also accompanied by changes in the expression patterns of sterol regulatory element‐binding protein 2/LXR target genes in the opposite direction to WTD‐fed mice (Figure 8F). These transcriptional changes resulting from the statin/ezetimibe treatment were replicated in human primary cultured hepatocytes24 (Figure 8G).
Figure 8.
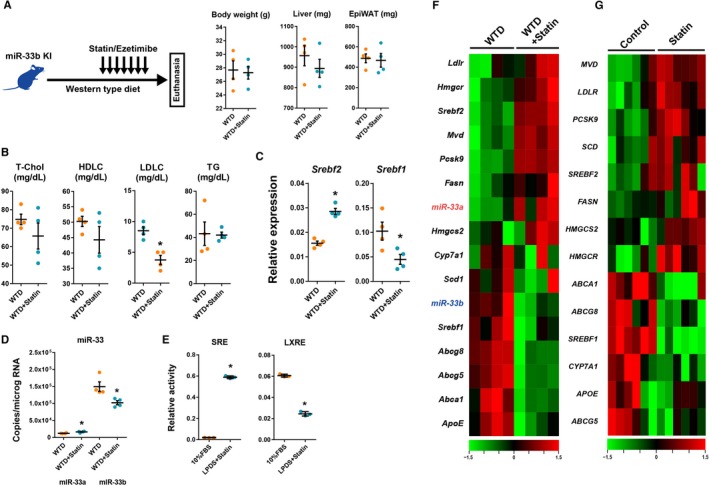
Changes in liver gene expression in microRNA (miR)‐33b knock in (KI) mice in the cholesterol‐depleted condition. A, Experimental scheme and changes in body liver and epidydimal white adipose tissue (EpiWAT) weight during experiment. B, Serum lipid profiles after 2 weeks of Western‐type diet (WTD) feeding and 1 week of treatment with vehicle or statin/ezetimibe. C and D, Quantitative polymerase chain reaction analysis for sterol regulatory element‐binding factor (Srebf) 2 and Srebf1 (C) and miR‐33a and miR‐33b (D) in the liver under the cholesterol‐depleted condition. n=4 for each. *P<0.05 compared with vehicle. E, Reporter assay containing sterol response element (SRE) and liver‐X‐receptor response element (LXRE) in HepG2 cells. n=3 for each. *P<0.05 compared with fetal bovine serum (FBS) containing medium. F, Heat map representation for liver gene expressions of mice treated with vehicle or statin/ezetimibe. Green indicates low expression level, and red indicates high expression level. n=4 for each. G, Heat map representation of gene expression in vehicle‐ or statin‐treated human primary culture hepatocytes. Data were obtained from GSE24187. n=6 for each. Horizontal bars in the dot plots indicate mean±SEM. HDLC indicates high‐density lipoprotein‐cholesterol; LDLC, low‐density lipoprotein‐cholesterol; LPDS, lipoprotein‐depleted serum; T‐Chol, total cholesterol; TG, Triglyceride.
Differential Roles of miR‐33a and miR‐33b in Atherosclerotic Plaque Formation
From the data presented above, miR‐33a and miR‐33b had similar targeting potency and targeting genes; however, the organ distribution was different. To compare the whole body atherogenic potency of miR‐33a and miR‐33b, we generated ApoE−/−/miR‐33 WT and ApoE−/−/miR‐33 KOKI mice. When fed a WTD for 12 weeks, ApoE−/−/miR‐33 KOKI mice showed higher plaque burden than ApoE−/−/miR‐33 WT mice (Figure 9A through and 9C). Serum HDL‐cholesterol level was reduced in ApoE−/−/miR‐33 KOKI mice versus ApoE−/−/miR‐33 WT mice (Figure 9D and 9E). As reported previously in miR‐33b KI mice, reduced serum triglyceride levels in miR‐33 KOKI mice were also observed. To confirm that reduced serum HDL‐cholesterol level resulted in increased atherogenicity in ApoE−/− miR‐33 KOKI mice, we assessed cholesterol extraction properties of serum obtained from these 2 strains of mice. According to the difference in serum HDL‐cholesterol levels, the serum obtained from ApoE−/− miR‐33b KOKI mice showed significantly decreased cholesterol extraction property than the serum obtained from ApoE−/− miR‐33 WT mice (Figure 9F). In addition, the miR‐33 KOKI mice showed blunted dose relationships between serum HDL‐cholesterol content and cholesterol efflux properties compared with WT mice. Moreover, the miR‐33 KOKI mice showed significantly reduced miR‐33 target gene expression in the liver (Figure 9G and 9H). This finding was consistent with the higher expression of miR‐33b than miR‐33a in mice livers. These results suggest that miR‐33b is more responsible for atherogenesis in vivo than miR‐33a, especially through the dysregulation of hepatic gene expression and worsened serum cholesterol profile. Because a previous report implicated the role of miR‐33 in cholesterol accumulation and inflammation in the liver, we assessed the liver triglyceride or cholesterol content and liver injury marker in the ApoE−/− WTD‐fed study. We observed a significant increase in the triglyceride content and a nonsignificant increase in the cholesterol content of the liver in ApoE−/−/miR‐33 KOKI mice compared with those in ApoE−/−/miR‐33 WT mice. Accordingly, a nonsignificant increase in the serum aspartate transaminase/alanine aminotransferase levels and a significant increase in hepatic gene expression of inflammatory makers were observed in ApoE−/−/miR‐33 KOKI mice (Figure 9I through 9K).
Figure 9.
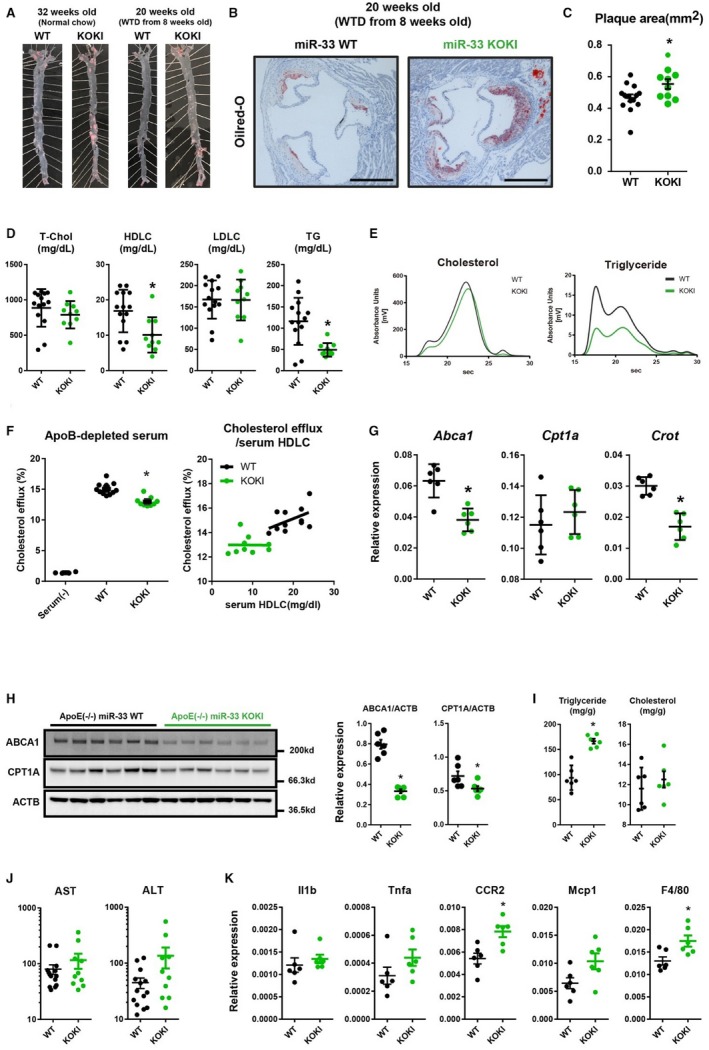
Increased atherosclerotic plaque burden in apolipoprotein E–deficient (ApoE−/−)/microRNA (miR)‐33 knock out knock in (KOKI) mice. Representative microscopic images of the en‐face analysis of aortic atherosclerotic plaque (A) and proximal aorta (B) in ApoE−/−/miR‐33 wild‐type (WT) mice and ApoE−/−/miR‐33 KOKI mice. Bar=500 μm. C, Quantification of the atherosclerotic plaque area in cross‐sections at the proximal aorta level. D, Serum lipid profiles of ApoE−/−/miR‐33 WT mice and ApoE−/−/miR‐33 KOKI mice. n=14 for WT, and n=10 for KOKI. E, High‐performance liquid chromatography analysis of serum cholesterol and triglyceride levels from ApoE−/−/miR‐33 WT mice and ApoE−/−/miR‐33 KOKI mice. F, Cholesterol extraction properties of serum obtained from ApoE−/−/miR‐33 WT or ApoE−/−/miR‐33 KOKI mice (left) and correlations between serum high‐density lipoprotein‐cholesterol (HDLC) level and cholesterol efflux (right). n=11 for WT, and n=9 for KOKI. G, Quantitative polymerase chain reaction (PCR) analysis for miR‐33 target genes in the liver. H, Western blot analysis for miR‐33 target genes in the liver. β‐Actin is used as loading control. I, Quantifications of triglycerides or cholesterol content in the liver. n=6 for each. J, Serum aspartate transaminase (AST) and alanine aminotransferase (ALT) levels from ApoE−/−/miR‐33 WT and ApoE−/−/miR‐33 KOKI mice. n=14 for WT, and n=10 for KOKI. K, Quantitative PCR analysis for gene expression of inflammatory makers in the liver. n=6 for each. Horizontal bars in the dot plots indicate mean±SEM. ApoB indicates apolipoprotein B; LDLC, low‐density lipoprotein‐cholesterol; T‐Chol, total cholesterol; WTD, Western‐type diet; TG, Triglyceride. *P<0.05 compared with WT.
To further characterize the atherogenic plaque, we performed the immunostaining of CD68 and ABCA1; and we could not detect significant differences of the positive area (Figure 10A and 10B). In addition, because a previous report suggested the role of miR‐33b in the unstable plaque formation,21 we assessed the area of picrosirius red staining. However, we also could not detect any difference in the area of unstable plaque. To compare the function of macrophages of these 2 genotypes in vivo, we performed bone marrow transplantation experiments using these 2 strains (Figure 11A). As a result, the genotype of miR‐33 in bone marrow did not affect the atherosclerotic lesion size (Figure 11B and 11C). In addition, no significant changes in serum lipid profile were detected between these 2 groups (Figure 11D). This result was consistent with the similar prevalence of miR‐33a and miR‐33b observed in the mice macrophages.
Figure 10.
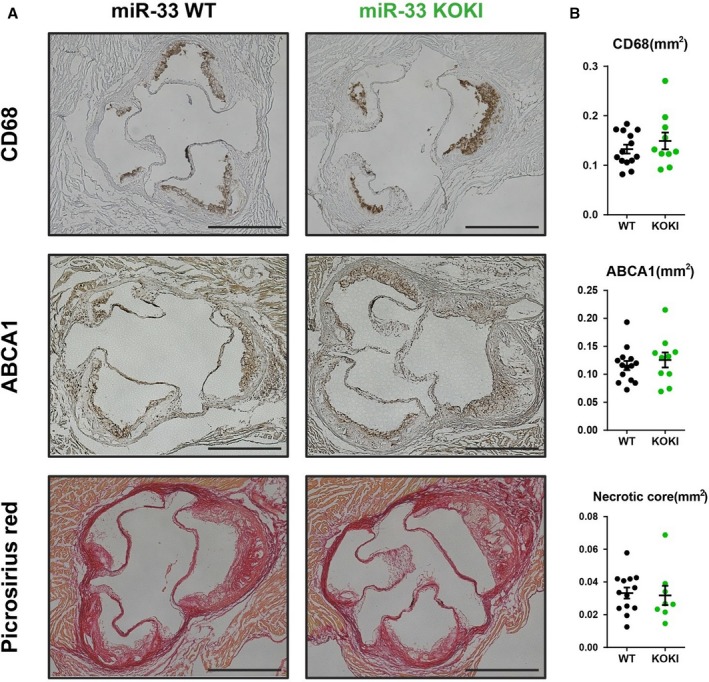
Plaque characterization of apolipoprotein E–deficient (ApoE−/−)/microRNA (miR)‐33 wild‐type (WT) or ApoE−/−/miR‐33 knock out knock in (KOKI) mice. A, Representative images of immunostaining for CD68, ATP‐binding cassette A (ABCA) 1, and picrosirius red staining. B, Quantification of positive area (CD68 or ABCA1) or negative area (picrosirius red). For CD68 and ABCA1 staining, n=14 for WT, and n=10 for KOKI. For picrosirius red staining, n=14 for WT, and n=8 for KOKI. Bar=500 μm.
Figure 11.
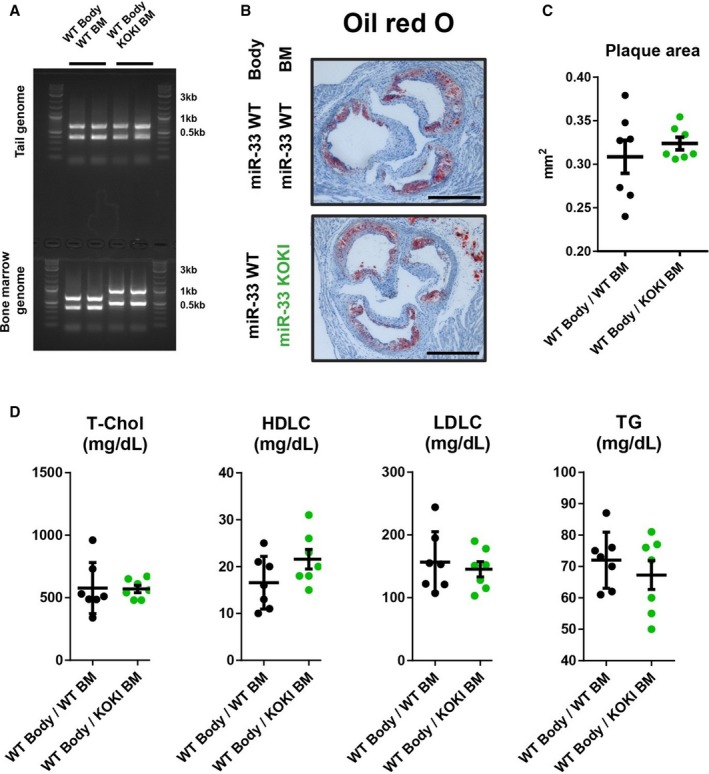
Hematopoietic microRNAs (miR‐33a and miR‐33b) have similar effects on atherosclerotic plaque formation. A, Representative genotyping polymerase chain reaction analysis of tail and blood cell genome. B, Representative microscopic images of the proximal aorta in apolipoprotein E–deficient (ApoE−/−)/miR‐33 wild‐type (WT) mice transplanted with bone marrow (BM) obtained from ApoE−/−/miR‐33 WT mice or ApoE−/−/miR‐33 knock out knock in (KOKI) mice. Bar=500 μm. C, Quantification of the atherosclerotic plaque area in cross‐sections at the proximal aorta level. D, Serum lipid profiles of ApoE−/−/miR‐33 WT mice transplanted with BM obtained from ApoE−/−/miR‐33 WT mice or ApoE−/−/miR‐33 KOKI mice. n=7 for each. Horizontal bars in the dot plots indicate mean±SEM. HDLC indicates high‐density lipoprotein‐cholesterol; LDLC, low‐density lipoprotein‐cholesterol; T‐Chol, total cholesterol; TG, Triglyceride.
Discussion
In the current study, we comprehensively analyzed the differential roles of miR‐33a and miR‐33b in various physiological conditions and during the progression of atherosclerosis using genetically modified mice in detail. In vitro transcriptomic assays confirmed the similar functionality of miR‐33a and miR‐33b. However, in vivo, these miRs were differently distributed and regulated. The cholesterol burden of the body regulated these miRs differently, especially when fed an atherosclerosis‐prone diet, which contained high fat and high cholesterol, resulting in significantly increased miR‐33b expression in the liver through the enhancement of the LXR signaling axis. On the contrary, statins, which are commonly used as antiatherosclerotic drugs, reduced expression of miR‐33b in the liver. miR‐33 KOKI mice showed increased plaque formation versus miR‐33 WT mice. From these data, we considered that miR‐33b could be more responsible for the atherosclerotic plaque formation in vivo.
We showed that miR‐33a and miR‐33b play distinct biological roles in vivo. As expected from the targeting mechanisms of miRs,25 the result of our transcriptomic evaluation using miR‐33–null hepatocytes and artificially synthesized miRs confirmed the same functionalities of miR‐33a and miR‐33b in repressing the target gene expression. Although there are many reports focusing on the biological function or disease relevance of miRs as a family, reports focused on the difference among members of an miR family are rare. One example is the miR‐1/miR‐133a and miR‐133b/miR‐206 cluster. miR‐1 and miR‐206 share a common seed sequence, as do miR‐133a and miR‐133b. These miR families show distinct organ distribution and involvement in different biological processes.26 In addition, members of the same miR family may show distinct biological functions through their distinct subcellular localization.27 In line with these data, the observed differences between miR‐33 WT and miR‐33 KOKI mice in this study are also based on the different spatiotemporal localizations. From these observations, we believe that a comprehensive assessment of the spatiotemporal distribution is important to understand the precise functionality of miRs. In particular, the experiments using genetically modified mice gave us clear data, and these data are also important to establish an effective and safe therapeutic approach.
In this study, the miR‐33 KOKI mice exhibited increased plaque formation versus miR‐33 WT mice. This result was reasonable because miR‐33b was more abundant than miR‐33a in the liver; on the other hand, miR‐33a and miR‐33b were relevant in macrophages. Because previous reports showed that whole‐body miR‐33 knockdown resulted in attenuated atherosclerosis through functional changes in these organs,11, 14, 28, 29, 30, 31 we considered that our result is consistent with these observations. In addition, enhanced expression of miR‐33b with a cholesterol‐rich diet could also contribute to the worsening of atherogenic phenotype in the miR‐33 KOKI mice. From these observations, we considered that miR‐33b is a more potent therapeutic target of miR‐33–repressing therapy against atherosclerotic disease than miR‐33a. The deletion of miR‐33a results in worsened conditions in several cases, including not only obesity and glucose intolerance, as mentioned above, but also reduced cardiac function in pressure overload conditions in our previous report.32 Nonselective miR‐33 inhibition may cause such adverse effects through the repression of miR‐33a, especially in miR‐33a dominant organs. Considering this possibility, miR‐33b–specific inhibition therapy for atherosclerosis may be a better treatment strategy for atherosclerosis.
In addition to the increased miR‐33b expression levels in the liver associated with a high‐fat and a high‐cholesterol diet, we showed that the abundance of miR‐33b was significantly repressed by cholesterol‐decreasing interventions, such as treatment with a statin and ezetimibe. This is consistent with the previous observation that SREBF1 expression was repressed with cholesterol‐depletion treatment.33 These data confirm that the miR‐33 expression levels are tightly regulated by cholesterol burden. Increased expression of miR‐33a, responding to decreased cholesterol burden, is reasonable as a negative feedback mechanism, to maintain cellular cholesterol level through the downregulation of ABCA1. However, enhanced expression of miR‐33b in response to increased cholesterol burden was paradoxical. If this response works as a positive feedback mechanism, it results in overaccumulation of cholesterol in cells and could lead to cellular toxicity. Inconsistent with this hypothesis, we observed increased lipid content and expression levels of inflammatory genes in the ApoE−/− miR‐33 KOKI mice liver in the WTD‐fed study. Systemic inflammation, including steatosis, has been suggested as a contributing factor to atherosclerosis.34, 35 Liver inflammation in the miR‐33 KOKI mice also may have contributed to the increased atherogenicity.
Previously, it was a concern that enhanced expression of miR‐33a during statin treatment, through enhanced Srebf2 expression, resulted in hepatotoxicity.36 However, in the current study, statin treatment decreased the transcriptional activity of downstream genes in the LXR signaling, including Srebf1, and reduced the expression of miR‐33b. Because miR‐33b is expressed in the liver at levels 10 times higher than miR‐33a, statin treatment reduced the overall level of miR‐33 in the liver. Taking into consideration that the previous report36 used WT mice with only miR‐33a, further evaluation of the miR‐33 family and statin treatment is warranted.
Also, miR‐33 WT mice showed significantly increased HDL‐cholesterol levels than miR‐33 KOKI mice. There are 2 reports that evaluated the effects on the serum lipid profiles after pharmacological inhibition of the miR‐33 family in nonhuman primates that carry both miR‐33a and miR‐33b.12, 13 These reports showed that simultaneous inhibition of miR‐33a and miR‐33b increased serum HDL‐cholesterol levels. In the second report,13 the authors focused on the selective inhibition of miR‐33a and miR‐33b using selective anti‐miR approaches. However, these selective approaches failed to increase serum HDL‐cholesterol levels or liver ABCA1 expression levels. In this study, we showed distinct effects of miR‐33a and miR‐33b on serum HDL‐cholesterol levels and the expression of their target genes. We considered that the difference between the previous report and ours may be rooted in the incompleteness of pharmacologic inhibition. In our results, in the presence of miR‐33b, the deletion of miR‐33a did not result in increased serum HDL‐cholesterol levels. On the other hand, miR‐33b was highly abundant in the liver, and complete inhibition of miR‐33b could be difficult. Thus, it was reasonable that only the simultaneous inhibition of miR‐33a and miR‐33b increased in serum HDL‐cholesterol levels and hepatic ABCA1 expression levels. As support for this discussion, the authors reported that the absolute copy number of miR‐33b is 7 times higher than that of miR‐33a in the primate liver.
Contrary to the abbreviating phenotypes on HDL‐cholesterol level, miR‐33 KOKI mice in the ApoE−/− background showed a decreased triglyceride level. In the previous report, we showed decreased triglyceride absorption in miR‐33 KI mice. In this study, the liver phenotype of miR‐33 KOKI mice was similar to that of miR‐33 KI mice because of the abundance of miR‐33b. However, in the small intestine, miR‐33a was more abundant compared with miR‐33b. From these data, we assume that the liver miR‐33 plays an important role in the triglyceride absorption; however, to elucidate the precise roles of the miR‐33 family in small intestine, organ‐specific deletion of the miR‐33 family is necessary.
In addition, in the cholesterol extraction experiments by mice serum, we found a blunted slope of cholesterol efflux against serum HDL‐cholesterol in the miR‐33 KOKI mice serum compared with the miR‐33 WT mice. This suggests that not only the quantity but also the quality of HDL‐cholesterol was worsened in the miR‐33b KOKI mice. Recent studies emphasize the importance of the quality of HDL‐cholesterol for atherosclerosis progression.6 These factors might contribute to the increased atherogenicity in miR‐33 KOKI mice.
Because of the lack of miR‐33b in the mice, which is the most widely used animal model of atherosclerosis, the role of miR‐33b in atherosclerotic plaque formation has not been well studied. Recently, the role of miR‐33b was reported during atherosclerotic plaque formation in mice.28 However, the mice used in the this study did not grow to adulthood and could not be used to assess the whole‐body roles of miR‐33b in adult mice. In this study, we used our previously reported miR‐33b KI mice, which showed mendelian segregation and showed no significant difference in adult body weight with a normal diet. The data obtained from this strain showed many consistencies with external data and previous findings. In particular, the strong correlation between Srebf2/Srebf1 and miR‐33a/b expression patterns was also confirmed in human primary cultured cell lines. This observation supported the generalizability of the data obtained from these mice. We suggest that this strain will also be useful for assessing the roles of miR‐33b in the adult mice, and comparison of the results with previously reported strains is also important to understand the biological roles of Srebf1 and miR‐33b in vivo.
Sources of Funding
This work was supported by the Ministry of Education, Culture, Sports, Science and Technology and the Japan Society for the Promotion of Science KAKENHI Grants, whose numbers are 17K09860 (Dr Horie), 1605297 (Dr Kimura), 17H04177, and 17H05599 (Dr Ono); and by a visionary research grant “Step” from Takeda Science Foundation (Dr Ono).
Disclosures
None.
Supporting information
Table S1. List of the Primers for Real‐Time qPCR Assay Used in This Study
Table S2. List of the Primers for Mice Genotyping Used in This Study
Figure S1. Liver miR transcriptome obtained from miR‐33 KO mice and miR‐33 WT mice.
Figure S2. Dysregulated metabolite and miR‐33 target genes on the KEGG pathways (glucagon signaling pathway).
Figure S3. Dysregulated metabolite and miR‐33 target genes on the KEGG pathway (insulin secretion pathway).
Figure S4. Dysregulated metabolite and miR‐33 target genes on the KEGG pathways (AMPK signaling pathway).
Acknowledgments
Experiments using radioisotopes were performed at the Radioisotope Research Center, Kyoto University.
(J Am Heart Assoc. 2019;8:e012609 DOI: 10.1161/JAHA.119.012609.)
Contributor Information
Takahiro Horie, Email: kohono@kuhp.kyoto-u.ac.jp.
Koh Ono, Email: thorie@kuhp.kyoto-u.ac.jp.
References
- 1. Collins R, Reith C, Emberson J, Armitage J, Baigent C, Blackwell L, Blumenthal R, Danesh J, Smith GD, DeMets D, Evans S, Law M, MacMahon S, Martin S, Neal B, Poulter N, Preiss D, Ridker P, Roberts I, Rodgers A, Sandercock P, Schulz K, Sever P, Simes J, Smeeth L, Wald N, Yusuf S, Peto R. Interpretation of the evidence for the efficacy and safety of statin therapy. Lancet. 2016;388:2532–2561. [DOI] [PubMed] [Google Scholar]
- 2. Barter P, Gotto AM, LaRosa JC, Maroni J, Szarek M, Grundy SM, Kastelein JJP, Bittner V, Fruchart J‐C. HDL cholesterol, very low levels of LDL cholesterol, and cardiovascular events. N Engl J Med. 2007;357:1301–1310. [DOI] [PubMed] [Google Scholar]
- 3. Mora S, Glynn RJ, Ridker PM. High‐density lipoprotein cholesterol, size, particle number, and residual vascular risk after potent statin therapy. Circulation. 2013;128:1189–1197. [DOI] [PMC free article] [PubMed] [Google Scholar]
- 4. Sarwar N, Danesh J, Eiriksdottir G, Sigurdsson G, Wareham N, Bingham S, Boekholdt SM, Khaw K‐T, Gudnason V. Triglycerides and the risk of coronary heart disease: 10 158 incident cases among 262 525 participants in 29 Western prospective studies. Circulation. 2007;115:450–458. [DOI] [PubMed] [Google Scholar]
- 5. Miller M, Cannon CP, Murphy SA, Qin J, Ray KK, Braunwald E. Impact of triglyceride levels beyond low‐density lipoprotein cholesterol after acute coronary syndrome in the PROVE IT‐TIMI 22 trial. J Am Coll Cardiol. 2008;51:724–730. [DOI] [PubMed] [Google Scholar]
- 6. Sacks FM, Jensen MK. From high‐density lipoprotein cholesterol to measurements of function. Arterioscler Thromb Vasc Biol. 2018;38:487–499. [DOI] [PMC free article] [PubMed] [Google Scholar]
- 7. He L, Hannon GJ. MicroRNAs: small RNAs with a big role in gene regulation. Nat Rev Genet. 2004;5:522–531. [DOI] [PubMed] [Google Scholar]
- 8. Rayner KJ, Suarez Y, Davalos A, Parathath S, Fitzgerald ML, Tamehiro N, Fisher EA, Moore KJ, Fernandez‐Hernando C. MiR‐33 contributes to the regulation of cholesterol homeostasis. Science. 2010;328:1570–1573. [DOI] [PMC free article] [PubMed] [Google Scholar]
- 9. Najafi‐Shoushtari SH, Kristo F, Li Y, Shioda T, Cohen DE, Gerszten RE, Naar AM. MicroRNA‐33 and the SREBP host genes cooperate to control cholesterol homeostasis. Science. 2010;328:1566–1569. [DOI] [PMC free article] [PubMed] [Google Scholar]
- 10. Horie T, Ono K, Horiguchi M, Nishi H, Nakamura T, Nagao K, Kinoshita M, Kuwabara Y, Marusawa H, Iwanaga Y, Hasegawa K, Yokode M, Kimura T, Kita T. MicroRNA‐33 encoded by an intron of sterol regulatory element‐binding protein 2 (Srebp2) regulates HDL in vivo. Proc Natl Acad Sci USA. 2010;107:17321–17326. [DOI] [PMC free article] [PubMed] [Google Scholar]
- 11. Rayner KJ, Sheedy FJ, Esau CC, Hussain FN, Temel RE, Parathath S, van Gils JM, Rayner AJ, Chang AN, Suarez Y, Fernandez‐Hernando C, Fisher EA, Moore KJ. Antagonism of miR‐33 in mice promotes reverse cholesterol transport and regression of atherosclerosis. J Clin Invest. 2011;121:2921–2931. [DOI] [PMC free article] [PubMed] [Google Scholar]
- 12. Rayner KJ, Esau CC, Hussain FN, McDaniel AL, Marshall SM, van Gils JM, Ray TD, Sheedy FJ, Goedeke L, Liu X, Khatsenko OG, Kaimal V, Lees CJ, Fernandez‐Hernando C, Fisher EA, Temel RE, Moore KJ. Inhibition of miR‐33a/b in non‐human primates raises plasma HDL and lowers VLDL triglycerides. Nature. 2011;478:404–407. [DOI] [PMC free article] [PubMed] [Google Scholar]
- 13. Rottiers V, Obad S, Petri A, McGarrah R, Lindholm MW, Black JC, Sinha S, Goody RJ, Lawrence MS, deLemos AS, Hansen HF, Whittaker S, Henry S, Brookes R, Najafi‐Shoushtari SH, Chung RT, Whetstine JR, Gerszten RE, Kauppinen S, Naar AM. Pharmacological inhibition of a microRNA family in nonhuman primates by a seed‐targeting 8‐mer antimiR. Sci Transl Med. 2013;5:212ra162. [DOI] [PMC free article] [PubMed] [Google Scholar]
- 14. Horie T, Baba O, Kuwabara Y, Chujo Y, Watanabe S, Kinoshita M, Horiguchi M, Nakamura T, Chonabayashi K, Hishizawa M, Hasegawa K, Kume N, Yokode M, Kita T, Kimura T, Ono K. MicroRNA‐33 deficiency reduces the progression of atherosclerotic plaque in ApoE‐/‐ mice. J Am Heart Assoc. 2012;1:e003376 DOI: 10.1161/JAHA.112.003376. [DOI] [PMC free article] [PubMed] [Google Scholar]
- 15. Nakao T, Horie T, Baba O, Nishiga M, Nishino T, Izuhara M, Kuwabara Y, Nishi H, Usami S, Nakazeki F, Ide Y, Koyama S, Kimura M, Sowa N, Ohno S, Aoki H, Hasegawa K, Sakamoto K, Minatoya K, Kimura T, Ono K. Genetic ablation of microRNA‐33 attenuates inflammation and abdominal aortic aneurysm formation via several anti‐inflammatory pathways. Arterioscler Thromb Vasc Biol. 2017;37:2161–2170. [DOI] [PubMed] [Google Scholar]
- 16. Baba O, Horie T, Nakao T, Hakuno D, Nakashima Y, Nishi H, Kuwabara Y, Nishiga M, Nishino T, Ide Y, Nakazeki F, Koyama S, Kimura M, Hanada R, Kawahara M, Kimura T, Ono K. MicroRNA‐33 regulates the population of peripheral inflammatory Ly6Chigh monocytes through dual pathways. Mol Cell Biol. 2018;38:e00604–e00617. DOI: 10.1128/MCB.00604-17. [DOI] [PMC free article] [PubMed] [Google Scholar]
- 17. Horie T, Nishino T, Baba O, Kuwabara Y, Nakao T, Nishiga M, Usami S, Izuhara M, Sowa N, Yahagi N, Shimano H, Matsumura S, Inoue K, Marusawa H, Nakamura T, Hasegawa K, Kume N, Yokode M, Kita T, Kimura T, Ono K. MicroRNA‐33 regulates sterol regulatory element‐binding protein 1 expression in mice. Nat Commun. 2013;4:2883 DOI: 10.1038/ncomms3883. [DOI] [PMC free article] [PubMed] [Google Scholar]
- 18. Price NL, Singh AK, Rotllan N, Goedeke L, Wing A, Canfrán‐Duque A, Diaz‐Ruiz A, Araldi E, Baldán Á, Camporez J‐P, Suárez Y, Rodeheffer MS, Shulman GI, de Cabo R, Fernández‐Hernando C. Genetic ablation of miR‐33 increases food intake, enhances adipose tissue expansion, and promotes obesity and insulin resistance. Cell Rep. 2018;22:2133–2145. [DOI] [PMC free article] [PubMed] [Google Scholar]
- 19. Horie T, Nishino T, Baba O, Kuwabara Y, Nakao T, Nishiga M, Usami S, Izuhara M, Nakazeki F, Ide Y, Koyama S, Sowa N, Yahagi N, Shimano H, Nakamura T, Hasegawa K, Kume N, Yokode M, Kita T, Kimura T, Ono K. MicroRNA‐33b knock‐in mice for an intron of sterol regulatory element‐binding factor 1 (Srebf1) exhibit reduced HDL‐C in vivo. Sci Rep. 2014;4:5312 DOI: 10.1038/srep05312. [DOI] [PMC free article] [PubMed] [Google Scholar]
- 20. van Dongen S, Abreu‐Goodger C, Enright AJ. Detecting microRNA binding and siRNA off‐target effects from expression data. Nat Methods. 2008;5:1023–1025. [DOI] [PMC free article] [PubMed] [Google Scholar]
- 21. Nishino T, Horie T, Baba O, Sowa N, Hanada R, Kuwabara Y, Nakao T, Nishiga M, Nishi H, Nakashima Y, Nakazeki F, Ide Y, Koyama S, Kimura M, Nagata M, Yoshida K, Takagi Y, Nakamura T, Hasegawa K, Miyamoto S, Kimra T, Ono K. SREBF1/microRNA‐33b axis exhibits potent effect on unstable atherosclerotic plaque formation in vivo. Arterioscler Thromb Vasc Biol. 2018;38:2460–2473. [DOI] [PubMed] [Google Scholar]
- 22. Lizio M, Harshbarger J, Shimoji H, Severin J, Kasukawa T, Sahin S, Abugessaisa I, Fukuda S, Hori F, Ishikawa‐Kato S, Mungall CJ, Arner E, Baillie J, Bertin N, Bono H, de Hoon M, Diehl AD, Dimont E, Freeman TC, Fujieda K, Hide W, Kaliyaperumal R, Katayama T, Lassmann T, Meehan TF, Nishikata K, Ono H, Rehli M, Sandelin A, Schultes EA, ‘t Hoen P, Tatum Z, Thompson M, Toyoda T, Wright DW, Daub CO, Itoh M, Carninci P, Hayashizaki Y, Forrest A, Kawaji H; the FANTOM consortium . Gateways to the FANTOM5 promoter level mammalian expression atlas. Genome Biol. 2015;16:22. [DOI] [PMC free article] [PubMed] [Google Scholar]
- 23. de Rie D, Abugessaisa I, Alam T, Arner E, Arner P, Ashoor H, Åström G, Babina M, Bertin N, Burroughs AM, Carlisle AJ, Daub CO, Detmar M, Deviatiiarov R, Fort A, Gebhard C, Goldowitz D, Guhl S, Ha TJ, Harshbarger J, Hasegawa A, Hashimoto K, Herlyn M, Heutink P, Hitchens KJ, Hon CC, Huang E, Ishizu Y, Kai C, Kasukawa T, Klinken P, Lassmann T, Lecellier C‐H, Lee W, Lizio M, Makeev V, Mathelier A, Medvedeva YA, Mejhert N, Mungall CJ, Noma S, Ohshima M, Okada‐Hatakeyama M, Persson H, Rizzu P, Roudnicky F, Sætrom P, Sato H, Severin J, Shin JW, Swoboda RK, Tarui H, Toyoda H, Vitting‐Seerup K, Winteringham L, Yamaguchi Y, Yasuzawa K, Yoneda M, Yumoto N, Zabierowski S, Zhang PG, Wells CA, Summers KM, Kawaji H, Sandelin A, Rehli M, Hayashizaki Y, Carninci P, Forrest ARR, de Hoon MJL. An integrated expression atlas of miRNAs and their promoters in human and mouse. Nat Biotechnol. 2017;35:872–878. [DOI] [PMC free article] [PubMed] [Google Scholar]
- 24. Hafner M, Juvan P, Rezen T, Monostory K, Pascussi J‐M, Rozman D. The human primary hepatocyte transcriptome reveals novel insights into atorvastatin and rosuvastatin action. Pharmacogenet Genomics. 2011;21:741–750. [DOI] [PubMed] [Google Scholar]
- 25. Ambros V. The functions of animal microRNAs. Nature. 2004;431:350–355. [DOI] [PubMed] [Google Scholar]
- 26. Mitchelson KR, Qin W‐Y. Roles of the canonical myomiRs miR‐1, ‐133 and ‐206 in cell development and disease. World J Biol Chem. 2015;6:162. [DOI] [PMC free article] [PubMed] [Google Scholar]
- 27. Das A, Morley M, Moravec CS, Tang WHW, Hakonarson H, Margulies KB, Cappola TP, Jensen S, Hannenhalli S. Bayesian integration of genetics and epigenetics detects causal regulatory SNPs underlying expression variability. Nat Commun. 2015;6:8555. [DOI] [PMC free article] [PubMed] [Google Scholar]
- 28. Price NL, Rotllan N, Canfrán‐Duque A, Zhang X, Pati P, Arias N, Moen J, Mayr M, Ford DA, Baldán Á, Suárez Y, Fernández‐Hernando C. Genetic dissection of the impact of miR‐33a and miR‐33b during the progression of atherosclerosis. Cell Rep. 2017;21:1317–1330. [DOI] [PMC free article] [PubMed] [Google Scholar]
- 29. Karunakaran D, Thrush AB, Nguyen M‐A, Richards L, Geoffrion M, Singaravelu R, Ramphos E, Shangari P, Ouimet M, Pezacki JP, Moore KJ, Perisic L, Maegdefessel L, Hedin U, Harper M‐E, Rayner KJ. Macrophage mitochondrial energy status regulates cholesterol efflux and is enhanced by anti‐miR33 in atherosclerosis novelty and significance. Circ Res. 2015;117:266–278. [DOI] [PMC free article] [PubMed] [Google Scholar]
- 30. Ouimet M, Ediriweera HN, Gundra UM, Sheedy FJ, Ramkhelawon B, Hutchison SB, Rinehold K, van Solingen C, Fullerton MD, Cecchini K, Rayner KJ, Steinberg GR, Zamore PD, Fisher EA, Loke P, Moore KJ. MicroRNA‐33–dependent regulation of macrophage metabolism directs immune cell polarization in atherosclerosis. J Clin Invest. 2015;125:4334–4348. [DOI] [PMC free article] [PubMed] [Google Scholar]
- 31. Ouimet M, Ediriweera H, Afonso MS, Ramkhelawon B, Singaravelu R, Liao X, Bandler RC, Rahman K, Fisher EA, Rayner KJ, Pezacki JP, Tabas I, Moore KJ. MicroRNA‐33 regulates macrophage autophagy in atherosclerosis. Arterioscler Thromb Vasc Biol. 2017;37:1058–1067. [DOI] [PMC free article] [PubMed] [Google Scholar]
- 32. Nishiga M, Horie T, Kuwabara Y, Nagao K, Baba O, Nakao T, Nishino T, Hakuno D, Nakashima Y, Nishi H, Nakazeki F, Ide Y, Koyama S, Kimura M, Hanada R, Nakamura T, Inada T, Hasegawa K, Conway SJ, Kita T, Kimura T, Ono K. MicroRNA‐33 controls adaptive fibrotic response in the remodeling heart by preserving lipid raft cholesterol. Circ Res. 2017;120:835–847. [DOI] [PubMed] [Google Scholar]
- 33. Wong J, Carmel M, Brown AJ. Statins inhibit synthesis of an oxysterol ligand for the liver X receptor in human macrophages with consequences for cholesterol flux. Arterioscler Thromb Vasc Biol. 2004;24:2365–2371. [DOI] [PubMed] [Google Scholar]
- 34. Libby P. Inflammation in atherosclerosis. Arterioscler Thromb Vasc Biol. 2012;32:2045–2051. [DOI] [PMC free article] [PubMed] [Google Scholar]
- 35. Targher G, Byrne CD, Lonardo A, Zoppini G, Barbui C. Non‐alcoholic fatty liver disease and risk of incident cardiovascular disease: a meta‐analysis. J Hepatol. 2016;65:589–600. [DOI] [PubMed] [Google Scholar]
- 36. Allen RM, Marquart TJ, Albert CJ, Suchy FJ, Wang DQ‐H, Ananthanarayanan M, Ford DA, Baldán Á. miR‐33 controls the expression of biliary transporters, and mediates statin‐ and diet‐induced hepatotoxicity. EMBO Mol Med. 2012;4:882–895. [DOI] [PMC free article] [PubMed] [Google Scholar]
Associated Data
This section collects any data citations, data availability statements, or supplementary materials included in this article.
Supplementary Materials
Table S1. List of the Primers for Real‐Time qPCR Assay Used in This Study
Table S2. List of the Primers for Mice Genotyping Used in This Study
Figure S1. Liver miR transcriptome obtained from miR‐33 KO mice and miR‐33 WT mice.
Figure S2. Dysregulated metabolite and miR‐33 target genes on the KEGG pathways (glucagon signaling pathway).
Figure S3. Dysregulated metabolite and miR‐33 target genes on the KEGG pathway (insulin secretion pathway).
Figure S4. Dysregulated metabolite and miR‐33 target genes on the KEGG pathways (AMPK signaling pathway).


