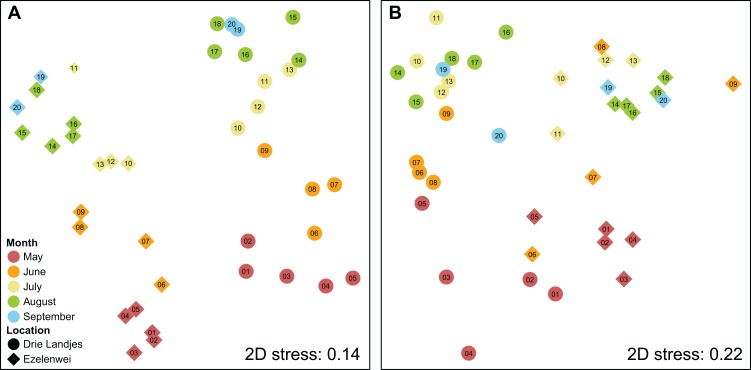
Figure 2. NMDS plots representing the dissimilarities between sampling sites.
Two-dimensional NMDS plots constructed based on Sørenson dissimilarities between sampling sites using (A) all MOTUs and (B) only metazoan MOTUs. 2D stress values are displayed in the panels. Each point represents the combined community of the three spatial sampling replicates taken at each of the two locations on each of the 20 time points, with the PCR replicates combined using the “additive” strategy. Shapes indicate the location, colors are used to indicate the month in which samples were obtained, with numbers labeling the consecutive weeks from 2 May to 12 September. ANOSIM supported grouping of the samples belonging to one lake for both all MOTUs as the metazoan-only dataset (R = 0.710 and R = 0.424, respectively, p = 0.001). Seasonal grouping was similarly supported by ANOSIM, splitting samples into two seasonal groups (2 May–13 June, and 20 June–12 September) (R = 0.486 and R = 0.587, respectively, p = 0.001) for all MOTUs and metazoan-only.

