

Abstract
INTRODUCTION:
Neuroimaging biomarkers are important for early diagnosis of Alzheimer’s disease and comparing multimodality neuroimaging to autopsy data is essential.
METHODS:
We compared the pathologic findings from a prospective autopsy cohort (n=100) to PiB-PET, FDG-PET and MRI. Correlations between neuroimaging biomarkers and neuropathologic schemes were assessed.
RESULTS:
PiB-PET showed strong correlations with Thal amyloid phase and CERAD score and categorized 44% of Thal phase 1 participants as positive. FDG-PET and MRI correlated modestly with Braak tangle stage in Alzheimer’s-type pathology. A subset of participants with “none” or “sparse” neuritic plaque scores had elevated PiB-PET signal due to diffuse amyloid plaque. Participants with findings characterized as “suspected non-Alzheimer’s pathophysiology” (SNAP) represented 15% of the group.
DISCUSSION;
PiB-PET is associated with Alzheimer’s disease, neuritic plaques and diffuse plaques. FDG-PET and MRI have modest correlation with neuropathologic schemes. Participants with findings characterized as SNAP most commonly had primary age-related tauopathy.
Keywords: Autopsy, Braak Tangle Stage, CERAD, Thal Amyloid Stage, Dementia, Alzheimer’s disease, Mild cognitive impairment, tau-PET, Amyloid-PET, MRI, amyloid, neurodegeneration, SNAP
1.0. Introduction
Pittsburgh compound B (PiB-PET) and other ligands are used to infer the presence of amyloid-β (Aβ) plaque accumulation in the brain [1–5]. Structural MRI and 18F-fluorodeoxy-glucose PET (FDG-PET) are used to infer neuropathology [6]. Diagnostic guidelines for Alzheimer’s disease dementia and preclinical Alzheimer’s disease now include biomarkers in the diagnostic algorithm [7]. Neuroanatomic distribution of neurofibrillary tangle pathology is characterized by a staging scheme described by Braak and Braak [8] has been validated in clinicopathologic studies investigating correlates of cognitive impairment [8–12]. The Consortium to Establish a Registry for Alzheimer’s Disease (CERAD) score is a semi-quantitative assessment of neuritic plaques [13], which has been shown to correlate with a range of fibrillar Aβ deposits that should have signal on amyloid-PET as suggested by early pathologic correlation [14, 15]. CERAD does not assess diffuse plaques, characterized as non-compact Aβ deposits without neuritic components, which are commonly found in aged brains [11]. Similar to the Braak tangle staging, Thal amyloid phase describes the topographic distribution of Aβ deposits in the brain [16]. Thal amyloid phase has been incorporated into recent neuropathologic assessment guidelines, along with Braak tangle stage and CERAD neuritic plaque score [17, 18]. It is important to understand the pathologic underpinnings of antemortem imaging to allow more accurate assessments of in vivo neuropathologic changes [19].
Existing neuropathologic and antemortem neuroimaging studies are mostly limited to single modality imaging studies for amyloid-PET [1, 2, 4, 14, 15, 20, 21], FDG-PET [22–24], and MRI [25–33], with a few small multi-modality studies [30, 34, 35]. We previously showed the association of Thal amyloid phase and amyloid-PET [36]. Nevertheless, larger multimodality studies are needed. In addition, a group of individuals with no or mild cognitive impairment who have neurodegenerative biomarker abnormalities without evidence of Aβ deposits on PET or CSF studies have been reported, a cohort referred to as “Suspected Non-Alzheimer Pathophysiology (SNAP)” [37] and have yet to be correlated with pathology. The contribution from diffuse plaques to amyloid-PET is debated [4, 15], and has yet to be well defined using neuropathologic data. Therefore, our goal was to investigate the relationship of multimodal neuroimaging and neuropathology in a prospective autopsy series to interrogate these issues.
2.0. Materials and Methods
2.1. Participants
Participants were part of the Mayo Clinic Study of Aging (MCSA) or Mayo Clinic Alzheimer’s Disease Research Center (ADRC) as described previously [38]. All participants or their designees provided written consent with approval of Mayo Clinic and Olmsted Medical Center Institutional Review Boards. There were 1678 participants enrolled between March 2006 and July 2017. Of the 234 who died, 111 came to autopsy and 100 had complete multimodality imaging data within 5 years of death and complete autopsy data. Antemortem clinical information about age of onset of cognitive symptoms, education, and Mini-Mental State Examination (MMSE) score [39] were abstracted from clinical records.
2.2. Neuroimaging
These 100 participants all had PiB-PET, FDG-PET and MRI on average two years prior to death. MRIs were performed a median of 7 days prior to FDG- and PiB-PET imaging. PiB-PET with parietal, prefrontal, orbitofrontal, temporal, anterior cingulate, posterior cingulate, and precuneus composite regions normalized to cerebellar crus, FDG-PET with angular and posterior cingulate composite regions normalized to pons, MRI AD signature thickness of entorhinal, fusiform, parahippocampal, middle temporal, inferior temporal and angular composite cortices, and MRI hippocampal volumes represented the respective regions sampled. Additional participant and imaging methods are shown in the Appendix A.
2.3. Neuropathology methods
Brains were sampled according to the CERAD protocol [13] (See Appendix A for tissue processing). The neuritic plaque score is a 4-point semi-quantitative assessment: 0=none, 1=sparse, 2=moderate, and 3=frequent (neuritic plaque score differs from the CERAD score in that we did not include an age component with neuritic plaque score but are analogs in scoring and herein we consider them interchangeable). Aβ immunohistochemistry in the neocortex, hippocampus, basal ganglia and cerebellum was used to assign Thal amyloid phase as: Phase 1-neocortex; Phase 2-CA1/subiculum; Phase 3-basal ganglia or dentate fascia of the hippocampus; Phase 4–midbrain or CA4 of the hippocampus; and Phase 5-cerebellum. Diffuse plaques were scored as 0=none, 1=sparse, 2=moderate or 3=frequent, according to National Alzheimer Coordinating Center Neuropathology Guidelines, Version 9. The distribution of Lewy bodies was classified as brainstem, limbic or diffuse Lewy body disease following guidelines of Kosaka [40].
For the purposes of statistical analyses, cases were considered consistent with AD if they had a Braak tangle stage of IV and at least sparse neuritic plaque score. Cases were defined as pathological aging [41] (also referred to as Alzheimer changes insufficient to diagnose AD) if they had a Braak tangle stage of III or less, at least a moderate diffuse plaque score, and no more than a sparse neuritic plaque score. Cases were defined as senile change if they had a Braak tangle stage of III or less, at least sparse diffuse plaques, and no neuritic plaques. To facilitate translation of our findings, senile change and pathological aging cases were re-assigned as primary age-related tauopathy (PART) if they met published criteria – Braak tangle stage IV or less and Thal amyloid phase 2 or less [42]. Frontotemporal lobar degeneration (FTLD) with TDP-43[43] corticobasal degeneration (CBD)[44] and progressive supranuclear palsy (PSP)[45] were diagnosed according to standard criteria. Lewy body disease (LBD) was classified following guidelines of Kosaka [40] and a recent consensus report [46]. Based upon the distribution and severity of Lewy bodies and neurites, cases were classified as: diffuse (neocortical) (DLBD), transitional (Limbic) (TLBD), brainstem-predominant (BLBD), amygdala-predominant (ALB), or olfactory bulb only, according to standard criteria [46]. Neurofibrillary tangle predominant dementia [47] and hippocampal sclerosis (HpScl)[48] were diagnosed as previously described.
2.4. Statistical Analyses
The imaging measures were PiB-PET SUVr, FDG-PET SUVr, MRI AD signature thickness and MRI hippocampal volume. Four pathology measures were: Braak tangle stage, Thal amyloid phase, neuritic plaque score, and diffuse plaque score. Spearman’s rank correlation was used to assess the relationship between imaging and pathology variables. To assess correlations for Aβ, Thal, neuritic plaque, and diffuse plaque variables were correlated with PiB-PET. Braak and Thal variable were correlated with FDG-PET and MRI. Sensitivity and specificity were calculated by using NIAA “not” and “low” as negative and “intermediate” and “high” as positive as compared to each imaging modality cut point [49]. Choi’s large sample test of equality of dependent correlations was used to assess particular PiB-PET and FDG-PET combinations of cortical sampling (see Appendix A) (gray matter (GM) or gray matter plus white matter (GM+WM) region sampling) or partial volume correction (PVC) produced optimal correlations with pathology measures [50]. Correlations of Braak tangle stage and Thal amyloid phase with FDG-PET AD specific regions and MRI AD signature thickness were further measured in subgroups of participants based on pathology classification: AD, pathological aging and senile change (AD spectrum) versus all other diagnoses. Fisher’s r-to-z transformation was used to evaluate the difference between the two correlation coefficients found in these two independent samples. All analyses were performed using R Statistical Software (v3.4.1).
A group of SNAP participants were identified for descriptive purposes as having abnormal AD signature thickness and/or abnormal FDG SUVr with normal PiB-PET SUVr and a clinical diagnosis of normal or MCI.
The findings in inconsistent cases were reviewed for descriptive purposes. Respective images of PiB-PET, FDG-PET and MRI, clinical data, correlative pathology and Aβ antibody staining to supplement Thal amyloid phase scoring was performed. Participants with normal PiB-PET plus Thal amyloid phases 3-5 (n=4); elevated PiB-PET plus Thal amyloid phase 0 (n=3); and elevated PiB-PET plus no neuritic plaques (n=7) were reviewed.
3.0. Results
3.1. Characterization of multimodal imaging and autopsy cohort
The participants with multimodal imaging who came to autopsy were pathologically heterogeneous. There were 71 men and 29 women. The most frequent primary pathologic diagnoses (n= 52) were in the AD spectrum. AD participants had more severe cognitive deficits (average MMSE 17) with the exception of DLBD. Details of the study cohort are shown in Table 1.
Table 1.
Participants Demographics
| Pathologic Dx | SC (N=2) | PA (N=6) | AD (N=44) | PART (N=12) | AGD (N=9) | PSP (N=5) | BLBD (N=1) | TLBD (N=6) | DLBD (N=11) | ALS (N=1) | FTLD-TDP (N=3) |
|---|---|---|---|---|---|---|---|---|---|---|---|
| Male, n (%) | 2 (100%) | 5 (83%) | 27 (61%) | 8(67%) | 8 (89%) | 4 (80%) | 0 | 6(100%) | 8 (73%) | 0 | 3 (100%) |
| Education | 15.5 (3.54) | 13.0 (5.29) | 15.4 (2.56) | 14.9 (3.12) | 14.6 (2.88) | 14.6 (3.44) | 20.0 | 14.7 (2.42) | 14.5 (1.92) | 18.0 | 16.3 (1.53) |
| Age at scan | 88.6 (5.57) | 83.0 (5.83) | 76.4 (11.3) | 78.6 (6.30) | 85.5 (3.95) | 82.3 (4.78) | 84.2 | 73.8 (10.00) | 74.3 (5.22) | 80.2 | 71.4 (5.35) |
| Age at autopsy | 89.5 (6.11) | 85.1 (5.92) | 79.2 (11.5) | 80.6 (6.33) | 87.6 (3.84) | 84.9 (5.33) | 86.1 | 75.3 (10.3) | 77.1 (4.96) | 81.9 | 73.2 (5.71) |
| Scan-death, mons | 11 (7) | 25 (14) | 34 (17) | 24 (12) | 25 (18) | 31 (12) | 22 | 19 (11) | 34 (15) | 19 | 22 (4) |
| APOE ε4, n (%) | 1(50%) | 4 (67%) | 32 (73%) | 1 (8%) | 2 (22%) | 2 (40%) | 0 | 3 (50%) | 5 (46%) | 0 | 1 (33%) |
| MMSE | 26.5(0.71) | 28.0 (1.26) | 17.8 (7.86) | 28.0 (1.41) | 24.2 (3.73) | 27.2 (1.48) | 26.0 | 23.3 (4.50) | 15.2 (5.36) | 28.0 | 19.0 |
| Global Z-score | −1.70 (0.578) | −1.60 (0.79) | −2.00 (1.18) | −0.46 (1.33) | −2.30 (1.52) | −1.10 (1.27) | 0.32 | −2.40 (0.84) | −4.60 | NA | −3.90 |
| PiB-PET SUVr | 1.70 (0.022) | 2.19 (0.360) | 2.61 (0.594) | 1.50 (0.333) | 1.64 (0.294) | 1.57 (0.229) | 1.32 | 1.82 (0.681) | 1.93 (0.376) | 1.42 | 1.34 (0.137) |
| FDG-PET SUVr | 1.41 (0.143) | 1.60 (0.237) | 1.21 (0.235) | 1.58 (0.180) | 1.45 (0.173) | 1.58 (0.231) | 1.64 | 1.31 (0.076) | 1.15 (0.177) | 1.56 | 0.987 (0.376) |
| SPM ANTS thickness | 2.94 (0.396) | 3.36 (0.274) | 2.90 (0.483) | 3.49 (0.420) | 3.28 (0.384) | 3.42 (0.445) | 3.521 | 3.06 (0.518) | 3.23 (0.175) | 3.21 | 2.47 (0.025) |
All time variables are in years. Values shown are mean (Standard Deviation when applicable) unless otherwise indicated. Abbreviations: AD=Alzheimer’s disease; SC= senile change; PART = Primary age-related tauopathy; PA= pathological aging; AGD=argyrophilic grain disease; PSP= progressive supranuclear palsy; BLBD= brainstem Lewy body disease; TLBD=transitional (limbic) Lewy body disease; DLBD=diffuse Lewy body disease; ALS= amyotrophic lateral sclerosis; FTLD-TDP=frontotemporal degeneration with TDP-43 pathology, NA= not available.
3.2. PiB-PET correlation with Neuropathology
There were meaningful relationships between the three Aβ-related neuropathologic measures and PiB-PET (Fig 1D; rho 0.68-0.78). Statistically there were no differences in the correlation of PiB-PET sampling methods with the neuropathologic measures (Figures C1–C3). PiB-PET values cited hereafter are produced with GM segmentation and PVC. Sensitivity and specificity vs NIA-AA were 95% and 53%. There were 7/23 (30%) participants with neuritic plaques score of “none” who had elevated PiB-PET values and 5/15 (33%) participants in the “sparse” plaques score category without elevated Aβ on PiB-PET. As neuritic plaque score does not include diffuse plaques, we also classified participants by diffuse plaques scores (Fig 1A and 1B, call out boxes) which showed that participants with frequent or moderate diffuse plaques often had elevated PiB-PET. Among moderate or frequent diffuse plaques groups, 73/76 (96%) of participants had elevated PiB-PET. Notably, there were several participants (15%) that had either “frequent,” “moderate,” or “sparse” diffuse plaques who had elevated PiB-PET with either “no” or “sparse” neuritic plaques (callout box Fig 1C). The mean PiB-PET SUVr of these 15 participants was 1.99 ± 0.52 (range 1.49-3.19) compared to 2.11 ± 0.67 (range 1.18-4.37) for the other 85.
Figure 1. PiB-PET SUVr and Amyloid Neuropathologic Measures.
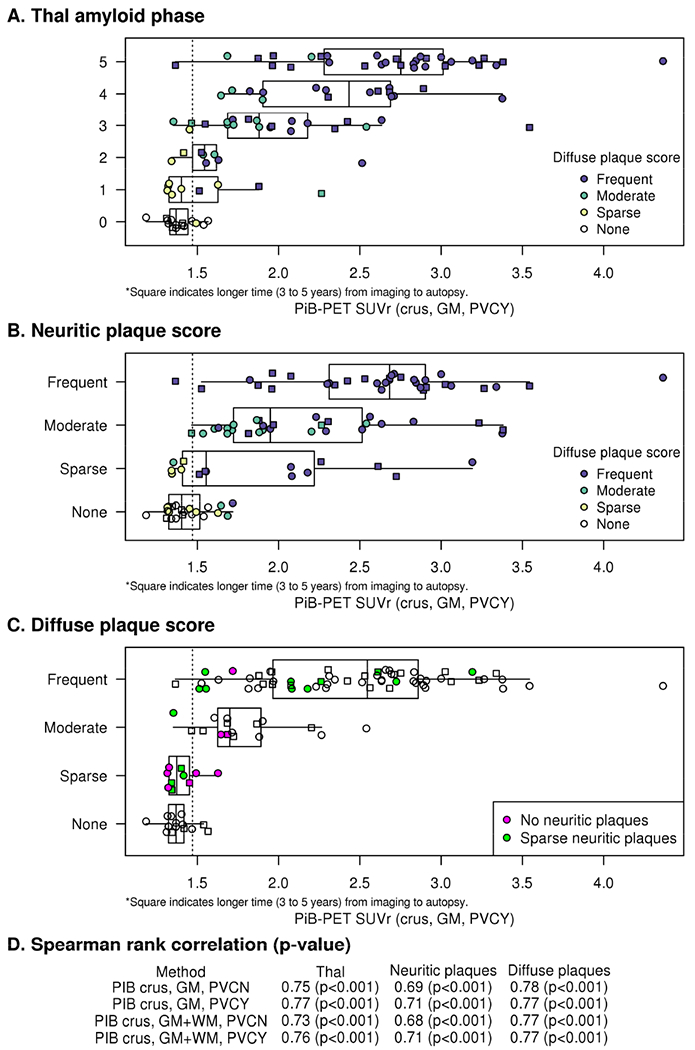
Relationships between PiB-PET and Thal amyloid phase (A), neuritic plaque score (B) and diffuse plaque score (C) are shown. PiB-PET SUVr is based on the crus reference region with GM segmentation and partial volume correction (crus, GM, PVCY). Spearman rank correlation rho (p-value) between different PiB-PET analysis methods and pathology score are shown (D). Call out boxes in the panels A and B show subcategorizations for diffuse plaque scores in colors and in the panel C show SUVr for “sparse” neuritic plaques score (green) or “none” neuritic plaques score (purple). Dotted line on the “x”axis represents the PiB cutoff of 1.47. Squares indicate 3-5 years from imaging to autopsy. PiB-PET correlations with Thal amyloid phase was not statistically different with the various methods of PiB-PET quantitative analysis (Choi’s test comparing analytic methods; p-value range: 0.08 to 0.3) (D, Appendix Figure C1). PiB-PET and neuritic plaque scores also correlated strongly regardless of the method of PiB-PET quantitative analysis with Spearman’s rho ranging from 0.68 to 0.71 (Choi’s test comparing analytic methods, p-value 0.09 to 0.6; D, Appendix Figure C2). Correlations of diffuse plaques with PiB-PET were high and indistinguishable for the various methods of quantitative analyses (C) with rho ranging from 0.77 to 0.78 (Choi’s test comparing analytic methods, p-value 0.29 to 0.97; Appendix Figure C3).
The distribution of PiB-PET SUVr for different primary pathologic diagnoses is shown in Fig 2. Two participants with pathologically-diagnosed AD didn’t have elevated PiB-PET. One of these two participants (SUVr=1.42) was considered possible AD dementia clinically when scanned (3 yr, 10 months prior to death) and neuropathologically had sparse neuritic plaques and sparse diffuse plaques with a Braak tangle stage of IV. The other was clinically unimpaired when scanned (4 yrs prior to death), had a PiB-PET SUVr =1.37 and was Braak tangle stage V and Thal phase 5. Most participants with diffuse or transitional Lewy body disease had elevated SUVr values (15/17, 88%). Participants with pathological aging as either a primary or a secondary diagnosis (Fig 2, call out on lower right) most often had elevated PiB-PET SUVr values (15/17, 88%).
Figure 2: PiB-PET, FDG-PET and MRI by Primary Neuropathologic Diagnoses.
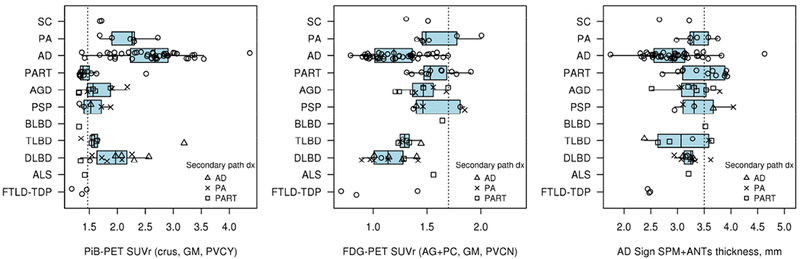
Imaging modality findings are shown vs. neuropathologic diagnosis. Subgroups noted in the call-out box show additional secondary neuropathologic diagnoses of AD (triangle), PA (X), and PART (square). Dotted line on the “x” axes represents the imaging modality cut points. All modalities are abnormal in most of the cohort. This represents the high sensitivity of the tests with limited specificity in the AD centric quantitation methods.
3.3. FDG-PET correlation with Neuropathology
The distribution of FDG-PET SUVr for different primary neuropathologic diagnoses is shown in Fig 3. Most in the group showed abnormal SUVr by using an AD-specific cutoff value. Spearman correlations of various FDG-PET calculation measures and Braak tangle stage ranged from rho = −0.36 to −0.45 (Supplementary Figure C4). The correlation was better (rho = −0.61 (p=<0.001) when only those in the AD disease spectrum were included (Figure 4a). Sensitivity and specificity vs NIA-AA were 95% and 11%. Correlations with Thal stage were weaker (rho=−0.24). This is not unexpected as in those with low Thal stage and non-AD neurodegenerative diseases, the metabolism may be reduced, even in AD-typical brain regions, because of non-AD pathology.
Figure 3: FDG-PET correlation with Neuropathologic Measures in the AD spectrum.
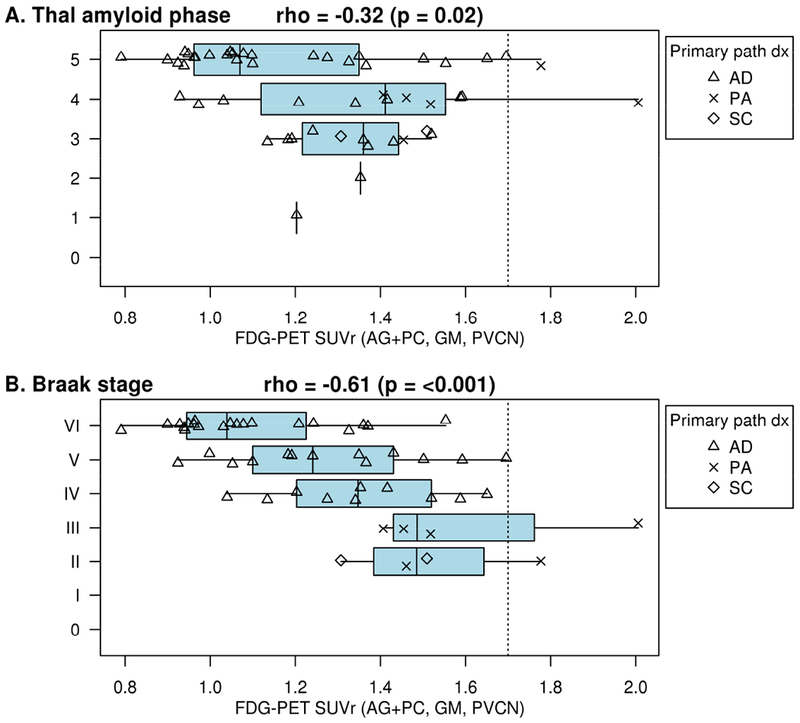
FDG-PET by Thal amyloid phase (A) and by Braak neurofibrillary tangle stage (B). In the AD spectrum, FDG-PET association with Thal amyloid phase is poor. Most participants have an SUVr below the FDG cutoff even for low Thal amyloid phase and Braak stage demonstrating nonspecificity and a probable influence in the regions from multiple neurodegenerative diseases. FDG-PET identified 45/48 (96%) participants as abnormal among Braak neurofibrillary tangle stage stages III or greater in the AD spectrum and 21/25 (84%) in the entire cohort (Appendix Figure C4) with a Braak neurofibrillary tangle stage of 2 or less as abnormal. The correlations were larger (better) when only those in the AD disease spectrum (AD, pathological aging, or senile change) were included vs. participants with non-AD pathologic diagnoses (rho = −0.61 and −0.13, respectively; Fisher’s r-to-z transformation p=0.005).
Figure 4. MRI correlation with Neuropathologic Measures in the AD spectrum.
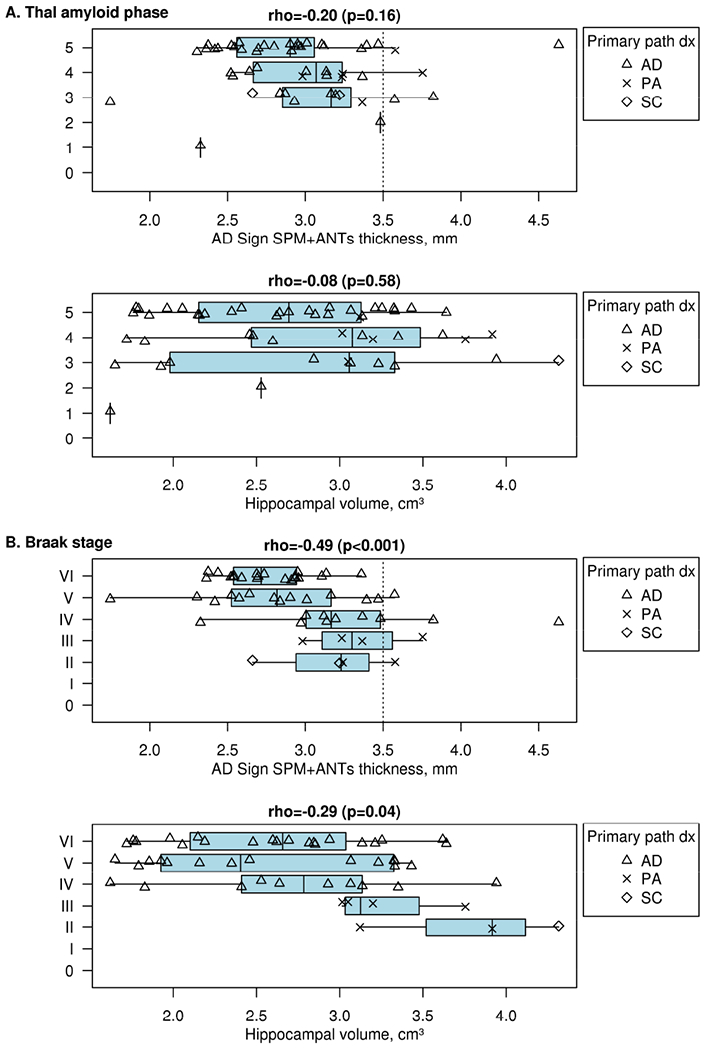
MRI by Thal amyloid phase (A) and by Braak neurofibrillary tangle stage (B) with both AD signature ROI and hippocampal volume assessments. Call out boxes in panels show subcategorizations for disease groups. Dotted line on the “x” axes represents the MRI AD signature cutoff of 3.50mm. In the AD spectrum, MRI association with Thal amyloid phase is poor by either quantitation method. The MRI AD signature thickness cut point of < 3.5 identified 44/48 (92%) participants with a Braak neurofibrillary tangle stage of III or greater in the AD spectrum as abnormal and 19/25 (76%) in the entire cohort (Appendix Figure C5) with a Braak neurofibrillary tangle stage of 2 or less as abnormal. Among the 3 diagnostic groups in the AD neuropathologic spectrum, AD (triangles, n=42, 2.82mm) and SC (diamonds, n=2, 2.75mm) had the thinnest mean AD signature. Hippocampal volume correlation with Braak was no better than MRI AD signature thickness.
3.4. MRI correlation with Neuropathology
Participants in the AD neuropathologic spectrum had similar correlation using MRI AD signature thickness measurement with Braak tangle stage as compared to the entire population (rho = −0.49 vs rho = −0.42). Hippocampal volume correlation with Braak was no better than MRI thickness (Fig 4, Supplementary Figure C5). Correlations with Thal stage were weaker (rho=−0.20). Sensitivity and specificity vs NIA-AA were 88% and 36%.
3.5. Characterization of the SNAP Cohort
SNAP criteria excluded most pathologic AD participants in this study (except for 1 of the 2 AD, PiB-PET negative participants described above), most pathological aging (often with elevated PiB-PET), and most Lewy body dementia participants (one BLBD by path was PiB-PET negative). Table B1 (supplemental) summarizes the features of the SNAP cohort, which represents 15% (15/100) of the entire autopsy cohort. There were 11/15 (73%) participants with a primary (n=8) or secondary (n=3) pathologic diagnosis of PART. Other neurodegenerative disorders included AGD (n=2, 13%), PSP (n=2), brainstem type LBD (n=1), AD (n=1; met SNAP criteria 4 years prior to death, see 3.2 above), and ALS (n=1). These findings suggest a role of these disorders in the abnormal neurodegenerative findings on MRI or FDG-PET in the characterization of SNAP participants. All FTLD-TDP cases (n=3) were symptomatic and were therefore not categorized as SNAP.
3.6. Observations from Inconsistent Cases
In those with normal PiB-PET by SUVr who were also assigned Thal amyloid phases 3-5, 2 of the 4 were positive on visual assessment (Fig 5, B and C) and had pathological aging. FDG-PET and MRI findings were also inconsistent with AD in some and helped categorize FTLD (A) and LBD (C).
Figure 5. Examples of inconsistent findings.
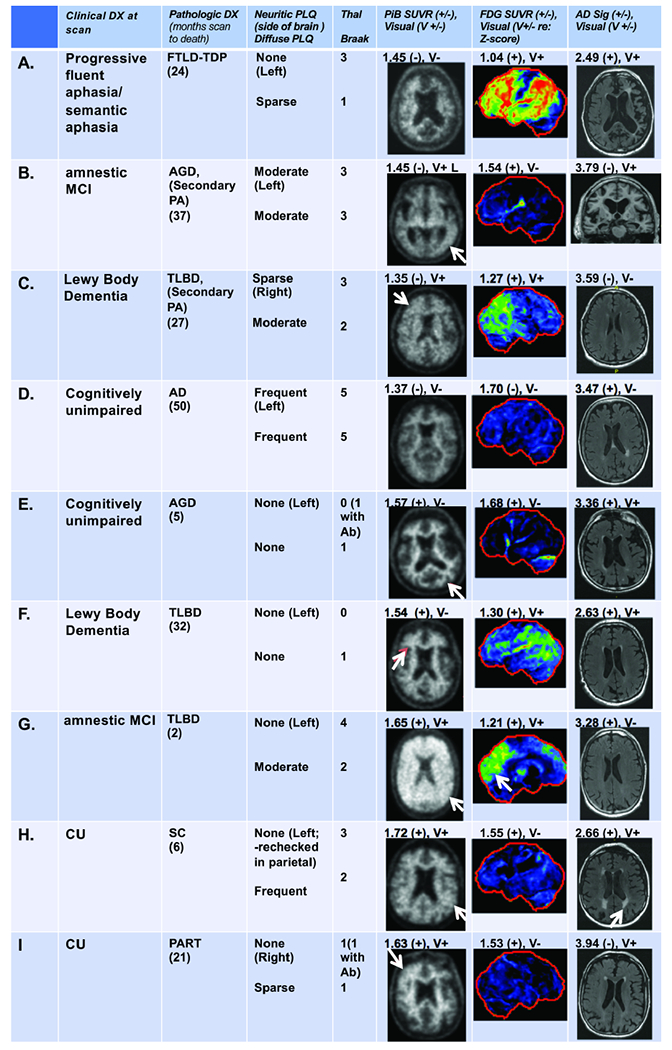
Amyloid negative and Thal amyloid phase 3-5 participants (A-D) and participants with elevated amyloid but Thal amyloid phase 0 and/or no neuritic plaque (E-I) are shown. Clinical diagnosis at the time of scanning, neuropathologic data and PiB-PET, FDG-PET, and MRI images (with their respective quantitative and visual findings) are shown for each participant. For A, left sided atrophy and hypometabolism on FDG corresponded to the FTLD diagnosis. Visual assessment showed asymmetrically increased PiB-PET signal (arrow) in the left temporal lobe in B and in the right hemisphere in C (arrow). For B, focally positive temporal PiB-PET signal may have been averaged out in the metaROI but could be consistent with moderate plaque. FDG and MRI were contradictory for abnormality suggesting borderline changes that may be consistent with early pathologic aging changes in these two. For C, diffuse, mild PiB-PET signal, greater on the right, was seen that may have been caused mainly by diffuse plaques. The FDG-PET findings in this case were consistent with LBD (MRI was negative). For D, only MRI was abnormal (AD sig only) in this participant with a neuropathology diagnosis of AD, yet cognitively unimpaired at the time of the scans, suggesting rapid onset of AD. Visual assessment showed preserved contrast between white matter and grey matter suggesting a negative PiB-PET (arrows) in E and F and was consistent with neuropathology that showed no neuritic plaques or diffuse plaques. The white matter signal is high in E and F suggesting possible “bleed-in” of white matter signal. By using Ab antibodies, a Thal 1 phase was assigned to E. Both FDG (but only on SUVr) and MRI measurements were positive (E), suggesting non-specific atrophy changes. In F, FDG findings reflected LBD while the MRI showed generalized cerebral atrophy. In G and H (no neuritic plaques) SUVr and visual PiB-PET assessment was positive (arrows). Diffuse plaques may have caused the elevated SUVr and visual findings (as typically seen in LBD (G)). Both FDG and MRI measurements were also positive in G and H. FDG-PET in G showed occipital hypometabolism (arrow) suggesting LBD. The MRI findings in H showed moderate diffuse cerebral atrophy and white matter infarcts (arrow). In I, increased PiB-PET retention in the right frontal lobe seen visually (arrow) correlated with focal amyloid on neuropathology. The FDG-PET SUVr was positive but the visual interpretation was negative and the MRI showed moderate diffuse cortical atrophy with a small right hippocampus.
Participants with elevated PiB-PET SUVr and a Thal phase of 0 (Fig 5, E and F) were visually negative suggesting that high WM PiB-PET signal may have influenced the “falsely” elevated SUVr. These had abnormal FDG-PET and MRI findings and suggested nonspecific atrophy (E) and LBD (F). There were 7 participants with elevated PiB-PET and no neuritic plaques (examples, Fig 5, G–I) with diffuse or asymmetric plaque likely causing the PiB-PET findings. FDG-PET and MRI findings were also instructive demonstrating LBD (G) and vascular disease (H).
4.0. Discussion
We made several important observations in this study. First, about half of the participants with Thal amyloid phase 1, most with Thal amyloid phase 2 or greater and most with sparse to frequent neuritic plaques had elevated PiB-PET SUVr. Second, diffuse plaques were strongly related to greater Aβ load as seen on PiB-PET. Third, there were modest correlations of MRI and FDG-PET AD measures with neuropathologic schemes in the whole group consistent with non-specificity of both of these biomarkers. However, correlations between FDG PET were stronger when only the AD spectrum subset was considered, consistent with the AD-specific ROI that was used. Fourth, a significant number of participants (15%) were “SNAP” by multimodality biomarker criteria, none of whom had neuropathologic features of AD but most commonly had PART on neuropathology.
Thal amyloid phase assesses the topographic distribution of Aβ across multiple brain regions. Since Thal amyloid phase 1 indicates amyloid deposition limited to neocortex without deposition in limbic or subcortical areas, a PiB-PET scan could be expected to be positive. However, the definition for Thal amyloid phase 1 includes participants with as little as a single neocortical Aβ plaque pathologically [16], and does not distinguish participants with few vs. numerous cortical deposits. Accordingly, Thal amyloid phase 1 participants with little Aβ burden may reasonably be negative on PiB-PET. In our population Thal amyloid phase 1 participants had either normal or elevated PiB-PET. Improved correlation with Thal 1 would necessitate additional neuropathologic measures that consider not only presence, but also density of neocortical Aβ deposits. While the measurement of global PiB-PET SUVr did not include measurement of the related allocortical regions, eg. striatum, that define higher Thal amyloid phases, PiB-PET correlated well with Thal amyloid phase and can be seen as correlating with the implied cortical Aβ worsening inherent in Thal amyloid phase.
Neuritic and diffuse plaque scores are measures of lesion density in the most severely affected cortex rather than topographic distribution. Correlations seen between diffuse plaque score vs. PiB-PET and neuritic plaque score vs. PiB-PET were similar and was expected given that the scores differ only in the presence of dystrophic neurites (in neuritic plaques). The contribution of diffuse plaques to PiB-PET signal was evident in participants with “moderate” or “frequent” diffuse plaques who had “sparse” or “none” neuritic plaque scores (Fig 1C) and can lead to high PiB SUVr even with sparse neuritic plaque scores (Figures 1B and 5). These participants often had pathological aging [41] (also referred to as Alzheimer changes insufficient to diagnose AD [51]) either as a primary or secondary neuropathologic diagnosis. These findings indicate that PiB-PET identifies both neuritic and diffuse Aβ.
We observed variable correlations of MRI and FDG-PET with neuropathologic measures depending on the group selected. In 20 autopsy participants Toledo et al, found that occipital FDG-PET hypometabolism accurately classified DLB and hippocampal sclerosis showed lower hippocampal volume on MRI [35]. Kantarci used PiB-PET and MRI in 5 autopsy participants and showed that occipital and posterior parietotemporal lobe hypometabolism is a distinguishing feature of DLB and is independent of the Aβ pathology [34]. These studies described the regional imaging features of DLB and AD while we focused on AD centric imaging regions to assess correlations with AD pathology in a broader group of participants. A previous literature review [52] of MRI findings in participants with autopsy showed that AD neuropathology is associated with whole-brain and hippocampal atrophy [32, 53]. The reviewed literature also showed that atrophy is not specific for AD and this was best demonstrated when population samples with a variety of neuro pathology were studied [27, 33, 54]. Higher tau burden in AD associated best with atrophy in one report [53]. These findings concur with our findings of MRI volume loss associated with Braak stage and emphasize the importance of considering the variety of neuropathology in the groups studied. Our findings are also consistent with prior work verified by autopsy that regional FDG-PET metabolic abnormalities predict progression of AD by Braak Stage [24]. Quantitative neurofibrillary tangle data rather than Braak stage could potentially improve the correlations. More specific neurodegenerative biomarkers, potentially tau-PET, may add diagnostic specificity to the neurodegenerative imaging multimodalities in aging cohorts. The finding that the Braak tangle stage scheme was highly correlated with FDG in the AD neuropathological spectrum, helps to validate FDG as a neurodegenerative biomarker for AD [7]. Correlations with Thal amyloid phase for both FDG and MRI (by either hippocampal volume or AD signature cortical thickness) were poor.
Multiple modalities as used in this study allowed for the characterization of SNAP participants in whom any neurodegeneration observed is presumed to be attributable to non-Alzheimer etiologies and support the validity of this construct. We observed 1 SNAP participant who had AD pathology at death, 50 months after imaging. Interestingly, this participant (shown on Fig 5, D) was clinically unimpaired at the time of imaging but had positive MRI suggesting that neurodegeneration may have preceded AD pathology. There were 6 other SNAP participants with Thal amyloid phases 1-3 all with non-AD spectrum neuropathologic diagnoses. Together these findings suggest the imperfect sensitivity of PiB-PET vs. low Aβ density not defined on Thal phase. Neuropathologic disorders found in SNAP participants included argyrophilic grain disease, LBD, ALS, PSP, PART, and cerebrovascular disease--PART being the most common. The implication in the aging population is that the presence of multiple neuropathologies and their effects on neurodegenerative imaging biomarkers needs to be considered for appropriate diagnosis. The premise that having an elevated amyloid scan is necessary for the neuropathological diagnosis of AD, even in the early stages, is largely supported by the neuropathologic data seen in this SNAP group. Our findings are consistent with those reported by Vos et al. [55], in 4 SNAP participants, none of whom met neuropathologic criteria for AD. Neurodegeneration in that study was characterized by cerebrospinal fluid testing. Taken together, the two studies provide evidence supporting the construct of SNAP as a heterogeneous set of non-Alzheimer disorders leading to Aβ-independent neurodegeneration.
We observed that some falsely normal and falsely elevated PiB-PET SUVr findings in our inconsistent participant group were better understood with visual analyses and assessment of all 3 imaging modalities. In some participants (Fig 5) we noted the presence of asymmetric PiB-PET signal. Presumably, small focal areas of elevated Aβ signal could be averaged in the PiB-PET metaROI and produce a negative SUVr. In addition, some low plaque burdens (ranging from none to moderate) were undetected by PET imaging. In Thal phase 0 and/or no neuritic plaque cases, the intensity of WM PiB-PET signal was sometimes high and may have influenced the “falsely” elevated SUVr. Overall, diffuse plaques, high WM PiB-PET signal, and asymmetric PiB signal likely contributed to some of the discrepant PiB-PET findings seen. Others in this group likely had elevated PiB-PET signal due to diffuse plaque only. FDG-PET was helpful in characterizing 3 cases as LBD. MRI was supportive showing non-AD related atrophy and vascular disease in some. Assessment of the full range of abnormalities on FDG-PET and MRI can be instructive in understanding mixed pathology that can confound quantitative assessment. Use of more disease specific regions for both FDG-PET and MRI would help improve specificity in this cohort [56].
4.1. Study limitations
Limitations of our study include neuroimaging data obtained a few years (but not more than 5 years) before autopsy. Our ability to refine PiB-PET and FDG-PET SUVr, or MRI AD signature thickness cutoffs for individual neuropathologic categorization was challenged by low numbers in some categories.
4.2. Summary
This study shows that PiB-PET is a reliable biomarker of underlying Aβ neuropathologic burden, as demonstrated by correlation with Thal amyloid phase, neuritic plaque score and diffuse plaque score. It demonstrates that diffuse plaques contribute significantly to elevated PiB-PET signal. Neurodegenerative imaging with FDG-PET and MRI associate modestly with neurodegenerative AD pathology findings. SNAP participants accounted for 15% of the autopsy group in this study and can be well defined by multimodality imaging. To the extent that SNAP is a diagnosis of “not-AD,” more disease-specific neurodegenerative markers to characterize non-AD neurodegenerative disorders in the aging population are needed.
Supplementary Material
Research in Context:
Systematic review: The authors reviewed the literature using traditional (e.g., PubMed) sources and meeting abstracts and presentations. The correlation of antemortem imaging and autopsy in dementia cohorts has been performed in some small groups with single imaging modalities. These publications are appropriately cited.
Interpretation: Our findings demonstrate the contributions of multimodality neuroimaging findings to diagnosis and demonstrate the impact of multiple neuropathologies on antemortem imaging findings.
-
Future directions: The manuscript suggests possible improvement in pathological and imaging data techniques and analyses that could be considered to improve correlations.
Examples include further understanding: (a) quantification of amyloid burden in neuropathologic assessments. (c) development and inclusion of new, specific neurodegenerative imaging biomarkers and (b) inclusion of visual interpretation of neuroimaging data.
5.0. Acknowledgements
Grant support: R01-AG040042, R01-AG011378, R01-AG041851, P50-AG016574/P1, U01-AG006786; Mangurian Foundation; Robert H. and Clarice Smith and Abigail vanBuren AD Research Program; the Elsie and Marvin Dekelboum Family Foundation. We thank the patients and their families who have participated in these prospective clinical and imaging studies, and especially for the generous donation of their brain tissue to help further our knowledge in Alzheimer’s disease. The authors would like to acknowledge the continuous commitment and teamwork offered by Mark Jacobsen, Ping Fang, Ariston Librero, Virginia R. Phillips, and Monica Castanedes-Casey. We would like to also thank Kris Johnson for assistance in collection of neuropathologic material.
6.0 Funding:
This research was supported by NIH grants, P50 AG016574, R01 NS89757, R01 NS089544, R01 DC10367, R01-AG054449, U01 AG006786, R21 NS094489, by the Robert Wood Johnson Foundation, The Elsie and Marvin Dekelboum Family Foundation, The Liston Family Foundation and by the Robert H. and Clarice Smith and Abigail van Buren Alzheimer’s Disease Research Program, The GHR Foundation, Foundation Dr. Corinne Schuler and the Mayo Foundation.
Disclosures/Potential Conflicts of Interest:
Dr. Lowe serves is a consultant for Bayer Schering Pharma, Philips Molecular Imaging, Piramal Imaging and GE Healthcare and receives research support from GE Healthcare, Siemens Molecular Imaging, AVID Radiopharmaceuticals, the NIH (NIA, NCI), and the MN Partnership for Biotechnology and Medical Genomics.
Ms. Lundt reports none.
Ms. Albertson reports none.
Mr. Przybelski reports none.
Mr. Weigand reports none.
Mr. Senjem reports none.
Dr. Parisi reports none.
Dr. Kantarci serves on the data safety monitoring board for Pfizer Inc and Jannsen Alzheimer’s Immunotherapy; data safety monitoring board for Takeda Global Research & Development Center, Inc. She is funded by the NIH and Minnesota Partnership for Biotechnology and Medical Genomics.
Dr. Boeve receives royalties from the publication of Behavioral Neurology of Dementia and receives research support from Cephalon, Inc., Allon Therapeutics, GE Healthcare, the NIH/NIA, and the Mangurian Foundation.
Dr. Knopman serves on a Data Safety Monitoring Board for the DIAN study; is an investigator in clinical trials sponsored by, Lilly Pharmaceuticals, Biogen and the Alzheimer’s Treatment and Research Institute at the University of Southern California; and receives research support from the NIH.
Dr. Jones reports no disclosures.
Dr. Jack serves on a scientific advisory board for Eli Lilly & Company and on A data safety monitoring board for Roche; receives research support from the NIH/NIA, and the Alexander Family Alzheimer’s Disease Research Professorship of the Mayo Foundation; and holds stock in Johnson & Johnson.
Dr. Dickson reports none
Dr. Petersen serves on scientific advisory boards for Pfizer, Inc., Janssen Alzheimer Immunotherapy, Elan Pharmaceuticals, and GE Healthcare; receives royalties from the publication of Mild Cognitive Impairment (Oxford University Press, 2003); and receives research support from the NIH /NIA.
Dr. Murray receives research support from the NIH/NIA.
Abbreviations:
- MCI
Mild cognitive impairment
- SNAP
Suspected non-Alzheimer’s pathophysiology
- PART
Primary age-related tauopathy
- SUVr
Standardized uptake value ratios
- ROI
Regions of interest
- PVC
Partial volume correction
Footnotes
Publisher's Disclaimer: This is a PDF file of an unedited manuscript that has been accepted for publication. As a service to our customers we are providing this early version of the manuscript. The manuscript will undergo copyediting, typesetting, and review of the resulting proof before it is published in its final citable form. Please note that during the production process errors may be discovered which could affect the content, and all legal disclaimers that apply to the journal pertain.
7.0 References
- [1].Clark CM, Pontecorvo MJ, Beach TG, Bedell BJ, Coleman RE, Doraiswamy PM, et al. Cerebral PET with florbetapir compared with neuropathology at autopsy for detection of neuritic amyloid-beta plaques: a prospective cohort study. Lancet neurology. 2012;11:669–78. [DOI] [PubMed] [Google Scholar]
- [2].Driscoll I, Troncoso JC, Rudow G, Sojkova J, Pletnikova O, Zhou Y, et al. Correspondence between in vivo (11)C-PiB-PET amyloid imaging and postmortem, region-matched assessment of plaques. Acta neuropathologica. 2012;124:823–31. [DOI] [PMC free article] [PubMed] [Google Scholar]
- [3].Johnson KA, Gregas M, Becker JA, Kinnecom C, Salat DH, Moran EK, et al. Imaging of amyloid burden and distribution in cerebral amyloid angiopathy. Ann Neurol. 2007;62:229–34. [DOI] [PubMed] [Google Scholar]
- [4].Kantarci K, Yang C, Schneider JA, Senjem ML, Reyes DA, Lowe VJ, et al. Antemortem amyloid imaging and beta-amyloid pathology in a case with dementia with Lewy bodies. Neurobiology of aging. 2012;33:878–85. [DOI] [PMC free article] [PubMed] [Google Scholar]
- [5].Klunk WE, Engler H, Nordberg A, Wang Y, Blomqvist G, Holt DP, et al. Imaging brain amyloid in Alzheimer’s disease with Pittsburgh Compound-B. Annals of Neurology. 2004;55:306–19. [DOI] [PubMed] [Google Scholar]
- [6].Jack CR Jr., Lowe VJ, Senjem ML, Weigand SD, Kemp BJ, Shiung MM, et al. 11C PiB and structural MRI provide complementary information in imaging of Alzheimer’s disease and amnestic mild cognitive impairment. Brain : a journal of neurology. 2008;131:665–80. [DOI] [PMC free article] [PubMed] [Google Scholar]
- [7].Jack CR Jr., Bennett DA, Blennow K, Carrillo MC, Dunn B, Haeberlein SB, et al. NIA-AA Research Framework: Toward a biological definition of Alzheimer’s disease. Alzheimers Dement. 2018;14:535–62. [DOI] [PMC free article] [PubMed] [Google Scholar]
- [8].Braak H, Braak E. Neuropathological stageing of Alzheimer-related changes. Acta Neuropathol. 1991;82:239–59. [DOI] [PubMed] [Google Scholar]
- [9].Bennett DA, Schneider JA, Wilson RS, Bienias JL, Arnold SE. Neurofibrillary tangles mediate the association of amyloid load with clinical Alzheimer disease and level of cognitive function. Arch Neurol. 2004;61:378–84. [DOI] [PubMed] [Google Scholar]
- [10].Duyckaerts C, Bennecib M, Grignon Y, Uchihara T, He Y, Piette F, et al. Modeling the relation between neurofibrillary tangles and intellectual status. Neurobiol Aging. 1997;18:267–73. [DOI] [PubMed] [Google Scholar]
- [11].Nelson PT, Alafuzoff I, Bigio EH, Bouras C, Braak H, Cairns NJ, et al. Correlation of Alzheimer disease neuropathologic changes with cognitive status: a review of the literature. J Neuropathol Exp Neurol. 2012;71:362–81. [DOI] [PMC free article] [PubMed] [Google Scholar]
- [12].Sabbagh MN, Cooper K, DeLange J, Stoehr JD, Thind K, Lahti T, et al. Functional, global and cognitive decline correlates to accumulation of Alzheimer’s pathology in MCI and AD. Current Alzheimer research. 2010;7:280–6. [DOI] [PMC free article] [PubMed] [Google Scholar]
- [13].Mirra SS, Heyman A, McKeel D, Sumi SM, Crain BJ, Brownlee LM, et al. The Consortium to Establish a Registry for Alzheimer’s Disease (CERAD). Part II. Standardization of the neuropathologic assessment of Alzheimer’s disease. Neurology. 1991;41:479–86. [DOI] [PubMed] [Google Scholar]
- [14].Lockhart A, Lamb JR, Osredkar T, Sue LI, Joyce JN, Ye L, et al. PIB is a non-specific imaging marker of amyloid-beta (Abeta) peptide-related cerebral amyloidosis. Brain : a journal of neurology. 2007;130:2607–15. [DOI] [PubMed] [Google Scholar]
- [15].Ikonomovic MD, Klunk WE, Abrahamson EE, Mathis CA, Price JC, Tsopelas ND, et al. Postmortem correlates of in vivo PiB-PET amyloid imaging in a typical case of Alzheimer’s disease. Brain : a journal of neurology. 2008;131:1630–45. [DOI] [PMC free article] [PubMed] [Google Scholar]
- [16].Thal DR, Rub U, Orantes M, Braak H. Phases of A beta-deposition in the human brain and its relevance for the development of AD. Neurology. 2002;58:1791–800. [DOI] [PubMed] [Google Scholar]
- [17].Hyman BT, Phelps CH, Beach TG, Bigio EH, Cairns NJ, Carrillo MC, et al. National Institute on Aging-Alzheimer’s Association guidelines for the neuropathologic assessment of Alzheimer’s disease. Alzheimers Dement. 2012;8:1–13. [DOI] [PMC free article] [PubMed] [Google Scholar]
- [18].Montine TJ, Phelps CH, Beach TG, Bigio EH, Cairns NJ, Dickson DW, et al. National Institute on Aging-Alzheimer’s Association guidelines for the neuropathologic assessment of Alzheimer’s disease: a practical approach. Acta Neuropathol. 2012;123:1–11. [DOI] [PMC free article] [PubMed] [Google Scholar]
- [19].Jack CR Jr., Albert MS, Knopman DS, McKhann GM, Sperling RA, Carrillo MC, et al. Introduction to the recommendations from the National Institute on Aging-Alzheimer’s Association workgroups on diagnostic guidelines for Alzheimer’s disease. Alzheimers Dement. 2011;7:257–62. [DOI] [PMC free article] [PubMed] [Google Scholar]
- [20].Sojkova J, Driscoll I, Iacono D, Zhou Y, Codispoti KE, Kraut MA, et al. In vivo fibrillar beta-amyloid detected using [11C]PiB positron emission tomography and neuropathologic assessment in older adults. Archives of neurology. 2011;68:232–40. [DOI] [PMC free article] [PubMed] [Google Scholar]
- [21].Thurfjell L, Lilja J, Lundqvist R, Buckley C, Smith A, Vandenberghe R, et al. Automated quantification of 18F-flutemetamol PET activity for categorizing scans as negative or positive for brain amyloid: concordance with visual image reads. Journal of nuclear medicine : official publication, Society of Nuclear Medicine. 2014;55:1623–8. [DOI] [PubMed] [Google Scholar]
- [22].Durand-Martel P, Tremblay D, Brodeur C, Paquet N. Autopsy as gold standard in FDG-PET studies in dementia. The Canadian journal of neurological sciences Le journal canadien des sciences neurologiques. 2010;37:336–42. [DOI] [PubMed] [Google Scholar]
- [23].Hoffman JM, Welsh-Bohmer KA, Hanson M, Crain B, Hulette C, Earl N, et al. FDG PET imaging in patients with pathologically verified dementia. Journal of nuclear medicine : official publication, Society of Nuclear Medicine. 2000;41:1920–8. [PubMed] [Google Scholar]
- [24].Mosconi L, Mistur R, Switalski R, Tsui WH, Glodzik L, Li Y, et al. FDG-PET changes in brain glucose metabolism from normal cognition to pathologically verified Alzheimer’s disease. European journal of nuclear medicine and molecular imaging. 2009;36:811–22. [DOI] [PMC free article] [PubMed] [Google Scholar]
- [25].Brickman AM, Tosto G, Gutierrez J, Andrews H, Gu Y, Narkhede A, et al. An MRI measure of degenerative and cerebrovascular pathology in Alzheimer disease. Neurology. 2018;91:e1402–e12. [DOI] [PMC free article] [PubMed] [Google Scholar]
- [26].Burton EJ, Barber R, Mukaetova-Ladinska EB, Robson J, Perry RH, Jaros E, et al. Medial temporal lobe atrophy on MRI differentiates Alzheimer’s disease from dementia with Lewy bodies and vascular cognitive impairment: a prospective study with pathological verification of diagnosis. Brain : a journal of neurology. 2009;132:195–203. [DOI] [PubMed] [Google Scholar]
- [27].Jack CR Jr., Dickson DW, Parisi JE, Xu YC, Cha RH, O’Brien PC, et al. Antemortem MRI findings correlate with hippocampal neuropathology in typical aging and dementia. Neurology. 2002;58:750–7. [DOI] [PMC free article] [PubMed] [Google Scholar]
- [28].Kantarci K, Ferman TJ, Boeve BF, Weigand SD, Przybelski S, Vemuri P, et al. Focal atrophy on MRI and neuropathologic classification of dementia with Lewy bodies. Neurology. 2012;79:553–60. [DOI] [PMC free article] [PubMed] [Google Scholar]
- [29].Kantarci K, Murray ME, Schwarz CG, Reid RI, Przybelski SA, Lesnick T, et al. White-matter integrity on DTI and the pathologic staging of Alzheimer’s disease. Neurobiology of aging. 2017;56:172–9. [DOI] [PMC free article] [PubMed] [Google Scholar]
- [30].McGeer PL, Kamo H, Harrop R, McGeer EG, Martin WR, Pate BD, et al. Comparison of PET, MRI, and CT with pathology in a proven case of Alzheimer’s disease. Neurology. 1986;36:1569–74. [DOI] [PubMed] [Google Scholar]
- [31].Vemuri P, Whitwell JL, Kantarci K, Josephs KA, Parisi JE, Shiung MS, et al. Antemortem MRI based STructural Abnormality iNDex (STAND)-scores correlate with postmortem Braak neurofibrillary tangle stage. NeuroImage. 2008;42:559–67. [DOI] [PMC free article] [PubMed] [Google Scholar]
- [32].Whitwell JL, Dickson DW, Murray ME, Weigand SD, Tosakulwong N, Senjem ML, et al. Neuroimaging correlates of pathologically defined subtypes of Alzheimer’s disease: a case-control study. Lancet neurology. 2012;11:868–77. [DOI] [PMC free article] [PubMed] [Google Scholar]
- [33].Zarow C, Weiner MW, Ellis WG, Chui HC. Prevalence, laterality, and comorbidity of hippocampal sclerosis in an autopsy sample. Brain and behavior. 2012;2:435–42. [DOI] [PMC free article] [PubMed] [Google Scholar]
- [34].Kantarci K, Lowe VJ, Boeve BF, Weigand SD, Senjem ML, Przybelski SA, et al. Multimodality imaging characteristics of dementia with Lewy bodies. Neurobiology of aging. 2012;33:2091–105. [DOI] [PMC free article] [PubMed] [Google Scholar]
- [35].Toledo JB, Cairns NJ, Da X, Chen K, Carter D, Fleisher A, et al. Clinical and multimodal biomarker correlates of ADNI neuropathological findings. Acta Neuropathol Commun. 2013;1:65. [DOI] [PMC free article] [PubMed] [Google Scholar]
- [36].Murray ME, Lowe VJ, Graff-Radford NR, Liesinger AM, Cannon A, Przybelski SA, et al. Clinicopathologic and 11C-Pittsburgh compound B implications of Thal amyloid phase across the Alzheimer’s disease spectrum. Brain : a journal of neurology. 2015;138:1370–81. [DOI] [PMC free article] [PubMed] [Google Scholar]
- [37].Jack CR Jr., Knopman DS, Weigand SD, Wiste HJ, Vemuri P, Lowe V, et al. An operational approach to National Institute on Aging-Alzheimer’s Association criteria for preclinical Alzheimer disease. Ann Neurol. 2012;71:765–75. [DOI] [PMC free article] [PubMed] [Google Scholar]
- [38].Jack CR Jr., Lowe VJ, Weigand SD, Wiste HJ, Senjem ML, Knopman DS, et al. Serial PIB and MRI in normal, mild cognitive impairment and Alzheimer’s disease: implications for sequence of pathological events in Alzheimer’s disease. Brain. 2009;132:1355–65. [DOI] [PMC free article] [PubMed] [Google Scholar]
- [39].Folstein MF, Folstein SE, McHugh PR. “Mini-mental state”. A practical method for grading the cognitive state of patients for the clinician. J Psychiatr Res. 1975;12:189–98. [DOI] [PubMed] [Google Scholar]
- [40].Kosaka K, Yoshimura M, Ikeda K, Budka H. Diffuse type of Lewy body disease: progressive dementia with abundant cortical Lewy bodies and senile changes of varying degree--a new disease? Clin Neuropathol. 1984;3:185–92. [PubMed] [Google Scholar]
- [41].Dickson DW, Crystal HA, Mattiace LA, Masur DM, Blau AD, Davies P, et al. Identification of normal and pathological aging in prospectively studied nondemented elderly humans. Neurobiol Aging.1992;13:179–89. [DOI] [PubMed] [Google Scholar]
- [42].Crary JF, Trojanowski JQ, Schneider JA, Abisambra JF, Abner EL, Alafuzoff I, et al. Primary age-related tauopathy (PART): a common pathology associated with human aging. Acta Neuropathol. 2014;128:755–66. [DOI] [PMC free article] [PubMed] [Google Scholar]
- [43].Mackenzie IR, Neumann M, Bigio EH, Cairns NJ, Alafuzoff I, Kril J, et al. Nomenclature for neuropathologic subtypes of frontotemporal lobar degeneration: consensus recommendations. Acta Neuropathologica. 2009;117:15–8. [DOI] [PMC free article] [PubMed] [Google Scholar]
- [44].Dickson DW, Bergeron C, Chin SS, Duyckaerts C, Horoupian D, Ikeda K, et al. Office of Rare Diseases neuropathologic criteria for corticobasal degeneration. Journal of neuropathology and experimental neurology. 2002;61:935–46. [DOI] [PubMed] [Google Scholar]
- [45].Hauw JJ, Daniel SE, Dickson D, Horoupian DS, Jellinger K, Lantos PL, et al. Preliminary NINDS neuropathologic criteria for Steele-Richardson-Olszewski syndrome (progressive supranuclear palsy). Neurology. 1994;44:2015–9. [DOI] [PubMed] [Google Scholar]
- [46].McKeith IG, Boeve BF, Dickson DW, Halliday G, Taylor JP, Weintraub D, et al. Diagnosis and management of dementia with Lewy bodies: Fourth consensus report of the DLB Consortium. Neurology. 2017;89:88–100. [DOI] [PMC free article] [PubMed] [Google Scholar]
- [47].Janocko NJ, Brodersen KA, Soto-Ortolaza AI, Ross OA, Liesinger AM, Duara R, et al. Neuropathologically defined subtypes of Alzheimer’s disease differ significantly from neurofibrillary tangle-predominant dementia. Acta Neuropathol. 2012;124:681–92. [DOI] [PMC free article] [PubMed] [Google Scholar]
- [48].Murray ME, Cannon A, Graff-Radford NR, Liesinger AM, Rutherford NJ, Ross OA, et al. Differential clinicopathologic and genetic features of late-onset amnestic dementias. Acta Neuropathologica. 2014;128:411–21. [DOI] [PMC free article] [PubMed] [Google Scholar]
- [49].krzanowski Wj, Hand DJ. ROC curves for continuous data. London: Chapman and Hall.; 2009. [Google Scholar]
- [50].Choi SC. Tests of Equality of Dependent Correlation Coefficients. Biometrika. 1977;64:645–7. [Google Scholar]
- [51].Murray ME, Dickson DW. Is pathological aging a successful resistance against amyloid-beta or preclinical Alzheimer’s disease? Alzheimers Res Ther. 2014;6:24. [DOI] [PMC free article] [PubMed] [Google Scholar]
- [52].Dallaire-Theroux C, Callahan BL, Potvin O, Saikali S, Duchesne S. Radiological-Pathological Correlation in Alzheimer’s Disease: Systematic Review of Antemortem Magnetic Resonance Imaging Findings. Journal of Alzheimer’s disease : JAD. 2017;57:575–601. [DOI] [PubMed] [Google Scholar]
- [53].Whitwell JL, Josephs KA, Murray ME, Kantarci K, Przybelski SA, Weigand SD, et al. MRI correlates of neurofibrillary tangle pathology at autopsy: a voxel-based morphometry study. Neurology. 2008;71:743–9. [DOI] [PMC free article] [PubMed] [Google Scholar]
- [54].Erten-Lyons D, Woltjer R, Kaye J, Mattek N, Dodge HH, Green S, et al. Neuropathologic basis of white matter hyperintensity accumulation with advanced age. Neurology. 2013;81:977–83. [DOI] [PMC free article] [PubMed] [Google Scholar]
- [55].Vos SJ, Xiong C, Visser PJ, Jasielec MS, Hassenstab J, Grant EA, et al. Preclinical Alzheimer’s disease and its outcome: a longitudinal cohort study. Lancet neurology. 2013;12:957–65. [DOI] [PMC free article] [PubMed] [Google Scholar]
- [56].Minoshima S, Foster NL, Sima AA, Frey KA, Albin RL, Kuhl DE. Alzheimer’s disease versus dementia with Lewy bodies: cerebral metabolic distinction with autopsy confirmation. Annals of neurology. 2001;50:358–65. [DOI] [PubMed] [Google Scholar]
Associated Data
This section collects any data citations, data availability statements, or supplementary materials included in this article.